2021.06.04.3
Files > Volume 6 > Vol 6 No 4 2021
INVESTIGATION / RESEARCH
Comparative study on Biochar salt absorption capacity in different saline concentrated solutions

Vanessa Mishell Rocha Cabuyales
Available from: http://dx.doi.org/10.21931/RB/2021.06.04.3
ABSTRACT
Salt-affected soils are caused by excess accumulation of salts. As soil salinity increases, salt effects can result in the degradation of soils. Previous studies have determined that biochar has the potential to reduce salt stress in soils. In this study, the electroconductive properties of biochar to adsorb salts were investigated in different saline-concentrated solutions. Pelletized, fragmented and powdered biochar were placed in solutions with concentrations of 0, 50, 500, 1000, and 2000 parts per million sodium chloride, respectively. Control treatments consisted of deionized water mixed with salt and no biochar addition. A week after setting the experiment, the electroconductivity measurements were significantly higher relative to the first day. Significant differences were observed among treatments for pelletized, fragmented, and powdered biochar treatments. Increases in electroconductivity values are attributed to ambient temperature changes and differences in particle size. However, pelletized biochar declined in electroconductive values, which is attributed to ions being retained inside the pores of bigger particles. Our study concludes that biochar can adsorb salts at lower sodium chloride concentrations; therefore, it may help mitigate soil salt stress.
Keywords: biochar, salinity, electroconductivity, soil, salt
INTRODUCTION
The accumulation of salts may cause soil degradation due to agricultural, industrial, or urban activities1. Soil salinization is a widespread limitation where over 397 million hectares of the world's soils are unproductive saline patches of land2. One of the most severe problems related to salinization is the progressive degradation of soil fertility1. The excessive concentration of soluble salts in soils inhibits beneficial microbiological activity, causes accumulation of toxic ions, limits plant growth, and accelerates organic matter loss due to wind erosion or leaching3,1. Because soil fertility is essential for nutrient cycling, structure, stability, and cation exchange processes, most management strategies aim to improve this property1. There is currently much research regarding the amelioration of saline soils4. For this reason, biochar has been widely proposed to improve soil quality and crop productivity4. Biochar can enhance soil organic matter quality by dealing with soil salinity problems because of its salt sorption capacity5.
Biochar is obtained from a process known as pyrolysis, which is the thermo-chemical decomposition of organic biomass at temperatures generally ranging from 300 to 700 °C in the absence of oxygen6,7. Pyrolysis processes stabilize the existing carbon in organic matter to be more resistant to chemical and biological decomposition8. When biochar is incorporated into soils, it degrades very slowly so that carbon is not emitted into the atmosphere, in contrast to non-pyrolyzed organic matter decomposition9. Moreover, biochar has the potential to decrease Na+ uptake by adsorbing salts10. These characteristics give biochar the capacity to improve the physical-chemical properties of soils, increase soil productivity, contribute to carbon sequestration, and alleviate salt stress in vegetation8.
To enhance the understanding of the salt adsorption properties of biochar, it is necessary to measure its ion electroconductivity (EC). The analysis of biochar's electroconductive properties allows measuring the concentration of salts present in a solution based on a conductivity meter, and this can be used to determine whether biochar might help mitigate salt stress in plants and soils11,4. In addition, the effects of salinity amelioration on soils may vary depending on the biochar's physical characteristics12. Biochars in this study range from pelleted, powdered, and fragmented particle types and at a range of sizes. It is essential to consider the use of different biochar morphologies because of their varied porosity. Porosity determines the conductivity and ability of biochar to retain ions on its surface13. It is predicted that biochar can reduce the electroconductivity of saline treatments because of its salt sorption capacity. Since biochar's salt adsorption potential has no tests, this study conducted electroconductivity measurements to understand biochar's salt adsorption capacity and identify the physical-chemical properties of biochar's particle morphology. Biochar salt adsorption analysis can be used to enhance the limited studies on biochar's amendment of salt stress on soils and vegetation. The objective of this study is to understand which variables affect biochar's salt adsorption capacity. This research paper focuses on the following specific objectives:
1. Measure the salt adsorption capacity of biochar through electroconductivity.
2. Evaluate the salt adsorption function of different biochar morphologies under different salinity conditions.
METHODS
Biochar and salt stock solutions: Different types of biochar were analyzed based on particle morphology, including pelletized, fragmented, and powdered biochar. We used biochar pellets in the range of 2.8-2.00mm. These pellets were processed from highly compacted wood and manufactured by BioForest. We also used biochar fragments processed from sugar maple (Acer saccharum Marshall) and conifer wood. The size of the biochar fragments ranged from 0.5mm to 4mm. These sugar maple biochar fragments were manufactured at Haliburton Forest and Wildlife Reserve Ltd, whereas the conifer fragments and biochar powder were processed at Titan Carbon Smart Technologies. The titan fragments and titan powdered biochar were dried at 100°C for 24 hours.
In this study, five different salinity stock solutions were prepared with 99% pure reagent-grade sodium chloride (NaCl) and deionized water (DI) on a weight-in-volume basis. The choice of deionized water as solvent was motivated by its neutral electron conductance potential (5.5μS/m at 23°C). Deionized water is characterized by a lack of minerals and contaminants usually present in tap water, which could otherwise affect the experiment. The addition of sodium chloride was motivated by the specific salt concentration concerning seawater, which known measure acted as our reference (35ppt or 35g/L)14. Thus, 0.5g of sodium chloride was weighted in a mechanical balance and dissolved in a 250mL bulb flask to obtain a stock solution with 500ppm Na+ solution per every 15mL of deionized water. We assumed that a more concentrated solution would require double the number of salts, so we prepared a series of stock solutions with 1000ppm and 2000ppm and a negligible salt concentration stock solution with 50ppm Na+. The saline solutions consisted of low (50mmol NaCl), medium (500mmol NaCl), high (1000mmol NaCl), and saturated (2000mmol NaCl) sodium chloride concentrations in a fixed amount of 15 milliliters of deionized water. All the stock solutions were prepared 24 hours to let the sodium chloride dissolve and come to equilibrium before mixing them with biochar.
Experimental procedure: Preliminary tests were conducted on biochar and salt solutions at room temperature (23 – 25°C) to learn when equilibrium could be reached. The preparation of the preliminary samples took at least five days, so it was decided to conduct preliminary samples by adding solutions to biochar at 1:20 biochar: solution ratio. This ratio reflects the usual mix of 1g of solid biochar per every 20mL of liquid. Because of flask size, we adjusted the ratio to 15mL; thus, the fixed amount of biochar added was 0.75g (w:v). Biochar was weighted on a mechanical balance, and 0.75 grams were immersed in 25mL glass containers. Then, a plastic pipette was used to transfer 15 mL of each stock solution into lidded glass containers with moderate stirring. All of the treatments were performed in triplicate as was the control group. For the control samples, we mixed sodium chloride with deionized water without the addition of biochar. All the prepared samples were shaken at a speed of 80 rpm on a WWR DS-500E Orbital Shaker for an hour at room temperature. Initial electron conductivity measurements were taken after one hour of shaking the samples. Electrical conductivity was measured at room temperature (23°C) using a bench-top conductivity meter (Orion Star A112, Thermo Electron Co., Mass., U.S.A.) coupled to a conductivity cell (Orion 013005MD). The conductivity cell was calibrated to two standard solutions at 1413um and 12.0mS. After every measurement, the conductivity cell was washed with deionized water to remove any adhering sample and was blotted before using it in the subsequent measurement. Once the results of the initial measurements were recorded, all the samples were placed in the shaker for seven days, and electroconductivity values were taken at room temperature (25°C ± 0.5°C). At the end of the experiment, we dried all biochar samples in small aluminum sample holders so they could be used to measure salt content later on. After drying, the samples were transferred back to the identical washed vials, where the measurements were taken initially and stored with lids.
A detailed experimental design chart is depicted in Table 1. Statistical data and graphs were analyzed with R studio version 1.1.463 (R Core Team 2018). Data for each dependent variable were first analyzed for normal distribution by the Shapiro-Wilks normality test and equality of variances among biochar and salinity treatments by the Levene test. Data meeting these assumptions were further tested on the influence of biochar type and salinity level on the variability of electroconductivity by a two-way analysis of variance test or ANOVA. Statistics reported for each test are F-values, P-values, and standard errors. Microsoft Excel was used to show tables corresponding to the means and standard errors (Table 2). A line graph of electroconductivity grouped by salinity treatment is presented in Figure 1.
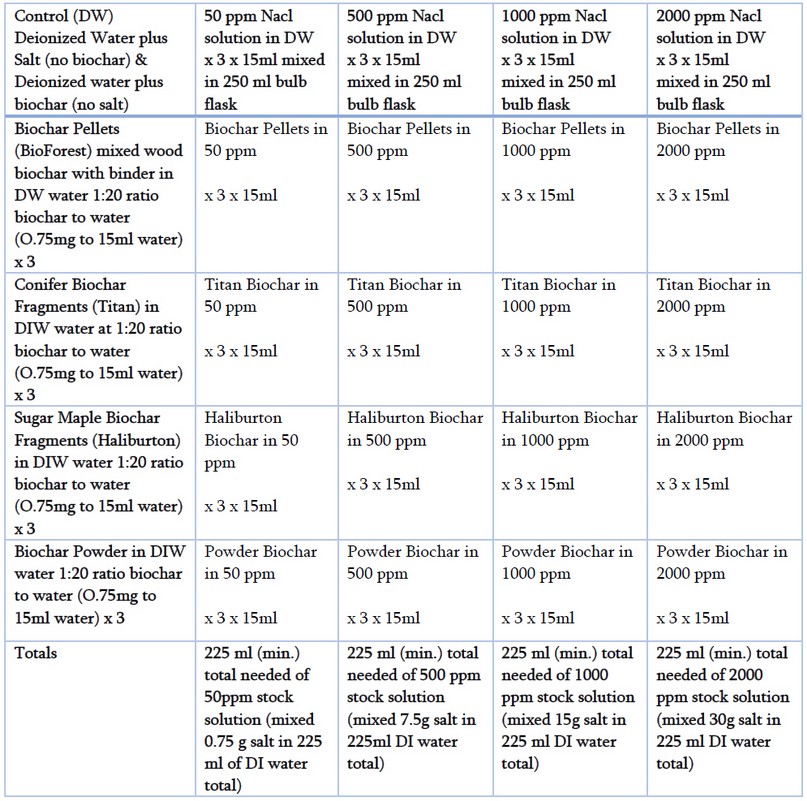
Table 1 Detailed experimental procedure and design.
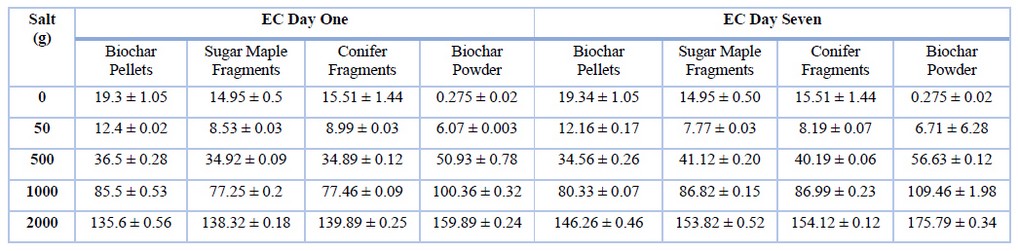
Table 2. Average (mean ± standard error N=3) for EC salinity treatments by biochar type (1:20 w/v ratio).
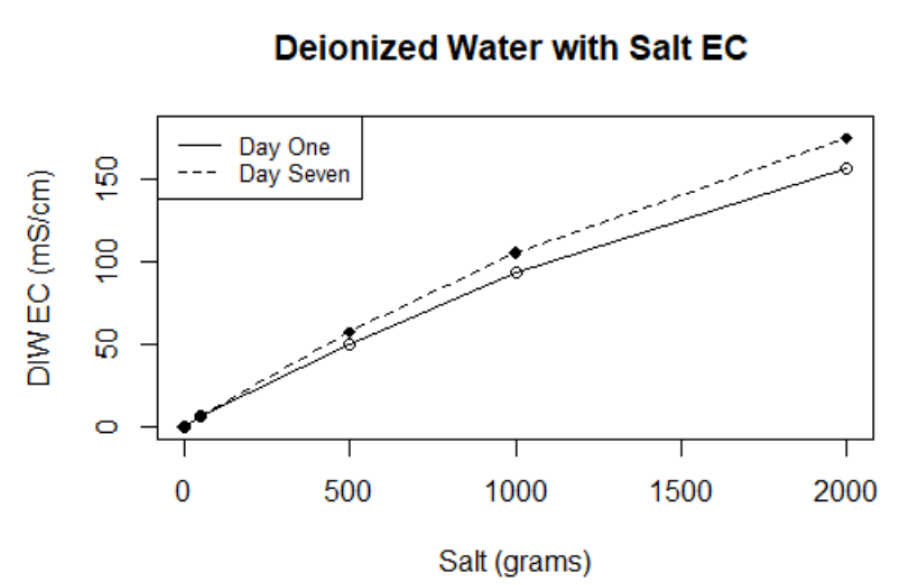
Figure 1. The graph shows the EC values obtained for the control group (deionized water with NaCl without biochar). The x-axis represents salinity levels in grams, whereas the y axis represents the EC of deionized water.
RESULTS
Contrary to our initial hypotheses, biochar particles did not consistently result in decreased salinity. Electroconductivity values showed a considerable increase in response to biochar added to saline treatments except for the low concentration solutions, while powder biochar did not show any decrease in EC values at any saline level. A two-way analysis of variance was conducted on the influence of biochar type and salinity level on the variability of electroconductivity values. For day one, the ANOVA test yields an F-value of 4.528 and a P-value of 2.2*10-16, indicating that the ANOVA is statistically significant according to the standard significance level of p<0.05. This result demonstrates that EC does differ from one salinity treatment to another. For day seven, where biochar and salinity are the independent variables, and EC values are the dependent variable, a significant relationship is found, supported by a p-value of 0.00191 (no log transformation). In other words, biochar type and salt concentration are the factors that influence EC values. Results of the variability in the EC measurements between saline solutions of the biochar samples are listed in Table 2. The results are discussed as the interaction of biochar on the different saline concentration treatments over time, and a comparison is made between the four different biochar types.
DISCUSSION
Electrical conductivity is a way to determine the concentration of ions present in an aqueous solution16. In an ionic solution, the specific conductivity measurement depends on the concentration and, therefore, on the number of ions (cations and anions)15. The more ions that are present, the higher the electroconductivity of the aqueous solutions16. These conductive ions include dissolved salts (NaCl) and organic and inorganic matter that composes biochar16. The duration of biochar's exposure to saline solutions had a pronounced effect on electroconductivity. As shown in Table 2, day-seven EC values were higher than day-one saline treatments and across the four types of biochar.
Salinity was not measured directly but is instead derived from electrical conductivity measurements15. For biochar pellets, the relationship between EC and salt is statistically significant (p< 0.0026). As shown in Figure 2a-b, low (50 ppm), medium (500ppm), and high (1000ppm) saline concentrations of Na+ presented a slight decrease in electroconductivity, with values ranging from 1% to 5% variation over a week. In contrast to other biochar types, pellets have a low surface area to volume ratio. For this reason, we believe that biochar pellets might be able to retain and hold more ions on their surface. However, the saturated saline concentration (2000ppm) presented an increment of 8% on the EC measurements. We attribute the observed EC variation to the fact that once biochar reaches equilibrium, it adsorbs salts, but these salts could also be released in the presence of saturated saline solutions because the particle might no longer be able to hold more ions.
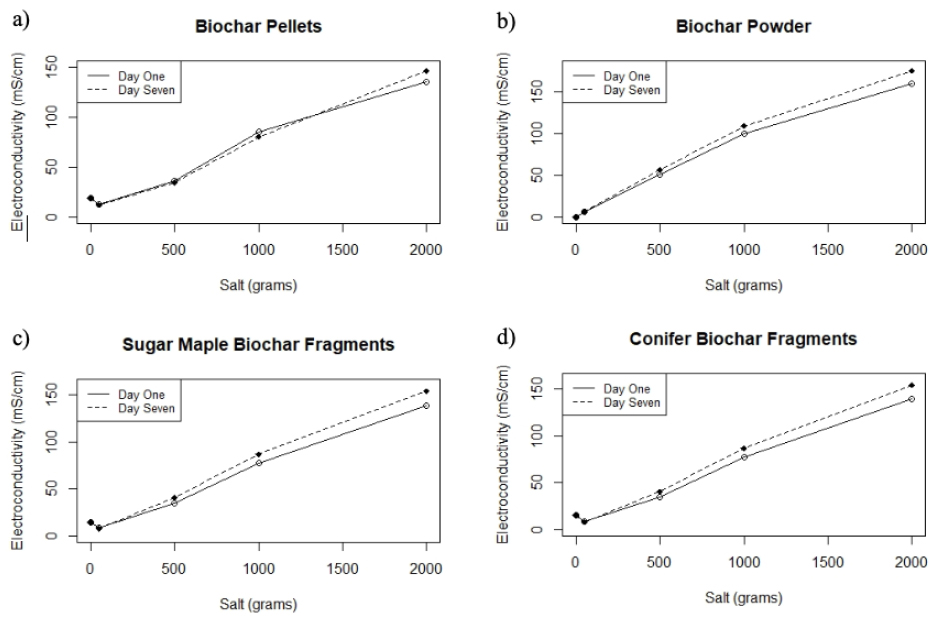
Figure 2. The figure illustrates the electroconductivity values for the four types of biochar tested: pellets, fragments (sugar maple and conifer) and powder. Graph a) shows biochar pellets, b) biochar powder, c) sugar maple fragments and d) conifer biochar fragments. For all four graphs, the x axis shows the salinity level concentration in grams whereas the y axis shows the electroconductivity values for the respective biochar in saline treatments.
EC values increased at the 500, 1000, and 2000 salinity levels (Table 2). The relationship between salinity level and EC measurements is supported by a significant p-value of 0.0025 for sugar maple fragments and a significant p-value of 0.0026 for biochar conifer fragments (Figure 2c-d). The electroconductivity measurements show that the values increased significantly across all five salinity treatments (p<0.0029). In contrast to pellets, values for powdered and fragmented biochar increased at each salinity level. Biochar powder particles have a higher surface area to volume ratio; such characteristics might allow the biochar to adsorb and de-adsorb Na+ salts at a different rate16,17. Therefore, salt ions are prevented from holding onto the powder's particle surface and are subsequently leached into the salinity solution, and since these ions are leached into the solution, electroconductivity values tend to increase.
Biochar particle size, shape, and internal structure likely play essential roles in controlling sodium-ion storage because they might alter pore characteristics. For instance, biochar has pores inside of its particles. These pores are called intrapores and might provide additional space for ion storage beyond the pore space between particles or interpores16. As a result, electroconductivity values tend to decrease. A larger particle size, which is the case of pelletized and fragmented biochar, may increase sodium adsorption capacity, whereas a smaller particle size might not. Bigger biochar particles can store more ions inside their internal structure (Figure 3a).
In contrast, smaller biochar particles, such as powdered and fragmented biochar, might have limited ion storage capacity to hold ions on their internal structures (Figure 3b-c-d). Therefore, finely powdered biochar particles will not adsorb many ions, unlike bigger biochar particles like pellets. This addition of biochar grains with different shapes and sizes will eventually change the adsorption of minerals in the salinity solutions.
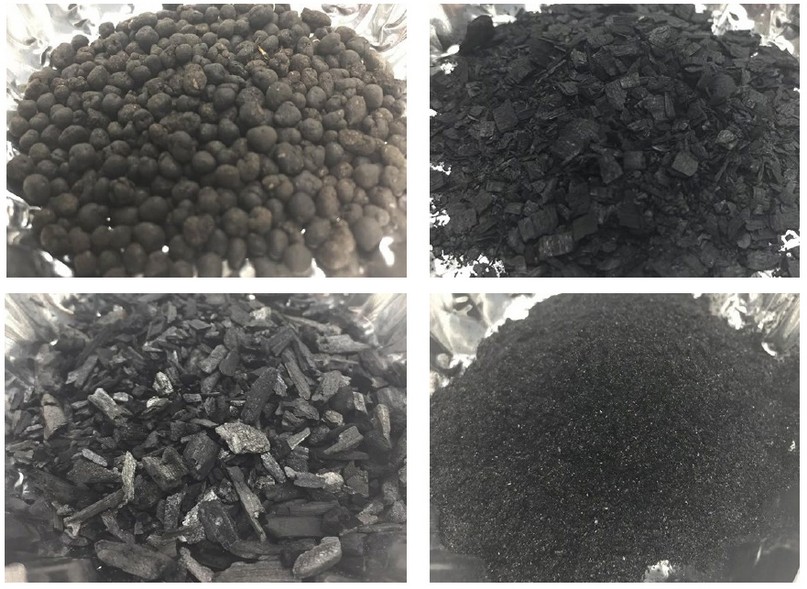
Figure 3. The four different biochar types were used in the study. From left to right: Biochar pellets, Sugar Maple fragments, Conifer fragments, and Biochar Powder
According to the Food and Agriculture Organization19, the higher EC variability of the salinity treatments may be attributed to increments in temperature. As shown in Table 2, the temperature of the saline solutions increased from 23°C ± 0.3°C in day one to 25°C ± 0.5°C on day seven. Unlike metallic conductivity, electrical conductivity increases at approximately 1.9% per Celsius degree increase in temperature19. When sodium electrolytes dissolve in water, they produce positive cation and harmful anion particles; this means that the electron conductance of the solutions increases with added ions10. An increase in EC may also be attributed to including substantial amounts of biochar ions and minerals into salinity solutions19. The presence of phenolic, carboxylic, pyrones, and ketone groups in biochar samples due to pyritization may in part explain the higher variability with the EC values between day one and seven10. An additional finding supporting this assumption is the increased electroconductivity presented by the control group, consisting of pure deionized water and different saline concentrations without biochar addition (Figure 2). Electroconductivity increased by approximately 0.5 to 12% from day one to day seven. It is important to note that temperature for day one was recorded to be 23°C ± 0.5°C whereas temperature for day seven was 25°C ± 0.5°C instead. Therefore, we believe that temperature played a significant role in rising EC values as higher temperatures might evaporate water, leaving saline ions behind.
Even though most of the biochar treatments showed increased EC values, low salt concentration treatments (50ppm) tend to progress toward a decrease in electroconductivity. All biochar types, except for powder, showed a decrease of 0.2-1.0 mS/cm in EC values at the 50ppm salinity concentration level. This finding suggests that biochar can adsorb salts in solutions with a small number of dissolved ions in contrast to solutions with a saturated number of ions20,21.
CONCLUSIONS
This study concludes that biochar can adsorb salts at lower sodium chloride concentrations; therefore, it may help mitigate salt stress in soils. Under a chemical-biological approach, the findings of this research will help select the best Canadian wood biochar options for different soil saline conditions in the environment. The presented information can serve as a guide to develop conservation strategies that aim to mitigate the adverse impacts of salt on vegetation and soils. However, further research still needs to be conducted to analyse a more precise interaction between biochar type and sodium sorption capacity. These analyses should implement different techniques to measure salinity values to get the exact sodium sorption levels.
Acknowledgments
Foremost, I would like to express my sincere gratitude to my advisor Prof. Sandy Smith, my research labmate Ph.D. candidate Melanie Sifton for the continuous support of this research, for their patience, motivation, enthusiasm, and immense knowledge. Their guidance helped me in all the time of research and writing this paper. Besides them, I would like to thank Prof. Sean Thomas Laboratory for providing me with all the necessary facilities and the University of Toronto for supporting this research project.
REFERENCES
1. Rietz, D. N., and Haynes, R. J. Effects of irrigation-induced salinity and sodicity on soil microbial activity. Soil Biology and Biochemistry, 35(6), 845-854.
2. FAO 2000. Extent and causes of salt-affected soils in participating countries. Global network on integrated soil management for sustainable use of salt-affected soils. FAO-AGL website.
3. Amini, S., Ghadiri, H., Chen, C., and Marschner, P. Salt-affected soils, reclamation, carbon dynamics, and biochar: a review. Journal of Soils and Sediments, 2016,16:939–953.
4. Drake, J. A., Cavagnaro, T. R., Cunningham, S. C., Jackson, W. R., and Patti, A. F. Does biochar improve establishment of tree seedlings in saline sodic soils? Land Degradation & Development, 2016, 27(1), 52-59.
5. Akhtar, S., Andersen, M and Liu, F. Biochar mitigates salinity stress in potato. Journal Agronomy and Crop Science, 2015, 201: 368-378.
6. Hossain, M. K., Strezov, V., Chan, K. Y., Ziolkowski, A., and Nelson, P. F. Influence of pyrolysis temperature on production and nutrient properties of wastewater sludge biochar. Environmental Management, 2011, 92(1), 223-228.
7. Lehmann, S. J. Biochar for environmental management: science, technology and implementation. 2nd edition. Routledge, Taylor & Francis Group, London, 2015.
8. Thomas, S. C., Frye, S., Gale, N., Garmon, M., Launchbury, R., Machado, N and Winsborough, C. Biochar mitigates negative effects of salt additions on two herbaceous plant species. Journal of Environmental Management, 2013, 129, 62.
9. Matovic, D. Biochar as a viable carbon sequestration option: Global and Canadian perspective. Energy, 2016, 36(4).
10. Ali, S., Rizwan, M., Qayyum, M. F., Ok, Y. S., Ibrahim, M., Riaz, M., and Shahzad, A. Biochar soil amendment on alleviation of drought and salt stress in plants: A critical review. Environmental Science and Pollution Research International, 2017, 24(14), 12700-12712.
11. Suliman, W., Harsh, J. B., Abu-Lail, N. I., Fortuna, A., Dallmeyer, I., and Garcia-Pérez, M. The role of biochar porosity and surface functionality in augmenting hydrologic properties of a sandy soil. Science of the Total Environment, 2017, 574(Complete), 139-147.
12. Graber, E., Tsechansky, L., Gerstl, Z., and Lew, B. High surface area biochar negatively impacts herbicide efficacy. Plant and Soil, 2012, 353(1-2), 95-106.
13. Dumroese, R. K., Heiskanen, J., Englund, K., and Tervahauta, A. Pelleted biochar: Chemical and physical properties show potential use as a substrate in container nurseries. Biomass and Bioenergy, 2011, 35(5), 2018-2027.
14. UNESCO. Joint Panel on Oceanographic Tables and Standards, 11th, Sidney, Canada 1980.
15. Kushch, L. A., Yagubskii, E. B., Konovalikhin, S. V. Synthesis, structure, and electroconductivity of new radical cation salt. Russian Chemical Bulletin, 1999, 48, 1513–1515.
16. Sinmyo, R., and Keppler, H. Electrical conductivity of NaCl-bearing aqueous fluids to 600 °C and 1 GPa. Journal of Contributions to Mineral Petrol, 2017, 172,
17. Liu, Z., Dugan, B., Masiello, C. A., Gonnermann, H. M. Biochar particle size, shape, and porosity act together to influence soil water properties. Plos one Journal, 2017, 12:0179079.
18. Mahmud, A. F., Camps-Arbestain, M., and Hedley, M. Investigating the Influence of Biochar Particle Size and Depth of Placement on Nitrous Oxide (N2O) Emissions from Simulated Urine Patches. Journal of Agriculture, 2018, 8:175.
19. FAO. Soil Salinity assessment: Methods and interpretation of electrical conductivity measurements. FAO Irrigation and Drainage Paper 1999.
20. Akuma, H., and Ichiki, M. Electrical conductivity of NaCl‐H2O fluid in the crust. Journal of Geophysic Resources Solid Earth, 2016, 121, 577– 594.
21. Bowden-Green, B., and Briens, L. An investigation of drum granulation of biochar powder. Journal of Powder Technology, 2016, 288(Complete), 249-254.
22. Ippolito, J. A., Laird D. A., and Busscher, W. J. Environmental benefits of biochar. Journal of Environmental Quality, 2012, 41, 967– 972.
Received: 7 July 2021
Accepted: 24 October 2021
Vanessa Rocha1
https://orcid.org/0000-0003-4545-405X
1. Universidad de Toronto , Canadá
Corresponding Author: [email protected], +593 999757919