2022.07.01.20
Files > Volume 7 > Vol 7 No 1 2022
Identification of Some Breast Cancer Related Genes by RAPD Technique in Maysan Province, Iraq

Zainab Zamil Gataa Allami 1,* , Maytham Abdulkadhim Dragh 1
1 Department of Biology, College of Science, University of Misan, Maysan, Iraq; zainabzamil @ uomisan.edu.iq
1 Department of Biology, College of Science, University of Misan, Maysan, Iraq; maithamdragh @ uomisan.edu.iq
* Correspondence: zainabzamil @ uomisan.edu.iq
Available from: http://dx.doi.org/10.21931/RB/2022.07.01.20
ABSTRACT
Breast cancer is a heterogeneous disease regarding its morphology, invasive behavior, metastatic capacity, hormone receptor expression and clinical outcome. Many risk factors for breast cancer, including genetic factors, account for 25-30% of the incidence. About 15-30% of breast cancer is heritable due to known familiar highly penetrates genes and the others are sporadic; It is worthy to state that this study was the first in the world to include amplified genes as a PCR template to determine the relationship between their polymorphism and breast cancer incidence using, RAPD of amplified genes. The study was designed first to evaluate the association of ABCG2 gene polymorphism beside miRNA-152 and ER-a using the RAPD technique with breast cancer incidence in Maysan province women, and second to use those genes as indicators for breast cancer prediction and diagnosis. The study included 100 patients with breast cancer and 30 control healthy women, and then all samples were amplified by conventional PCR by specific F and R primer for (ABCG2, ER-α, miRNA-152) genes and then the best (20 PCR product) from which was chosen as the template for PCR RAPD PCR technique. The results revealed there are significant differences (P < 0.05) in the unique band of ABCG2 at marker OPAA 11, OPU 15, OPAA 17, significant differences (P < 0.05) in the total band of ER- α at marker OPAA11, significant differences in the polymorphic band of ER- α at marker OPU 15, significant differences in the unique band of ER- α at marker OPAA11, OPU 15, and significant differences (P < 0.05) in the bands that had been size (50-60) bp, (140 - 150) bp, (170-180 ) bp of miRNA-152 at marker OPAA 17, OPD 18 between breast cancer patients and control. Our study proved the relationship between genetic polymorphism of breast cancer-related genes (ABCG2, ER-α, miRNA-152) and a higher incidence of cancer; The current study recommends employing these results for future prediction and diagnosis of breast cancers.
Keywords. Polymorphism; Iraqi; Breast cancer; Drug resistance gene; Estrogen receptor α gene; regulatory gene
INTRODUCTION
Breast cancer (BC) is the most common type of cancer among women worldwide. It accounts for 15% of cancer deaths among women and is the leading cause of cancer death in females worldwide 1. In Iraq, it is the most typical type of female malignancy, accounting for approximately one-third of the registered female cancers according to the Iraqi cancer registry in 2004 2,3. About 5-10% of breast cancer is inherited 4; while 90-95% is sporadic and revealed randomly and is not predetermined genetically 5,6.
The alteration in the expression of ATG5, caspase 3, and Bax genes can cause induction of both apoptosis and necrosis in human cancer cells 7. The susceptibility genes are considered a critical risk factor for hereditary and sporadic breast cancer. However; The genesis of breast cancer is usually cumulative mutations of different genes 8. Several genes linked to breast cancer have been found 9. Such as the ABCG2 gene that is located on the human chromosome at the locus 4q 22.1 10,11, 12. ABCG2 belongs to a sizeable ATP-binding cassette (ABC) transporters affecting P - glycoprotein (P-gp), overexpression of ABC transporters, increased anti-apoptotic machinery, DNA damage repair machinery, and enhanced drug inactivation mechanism are concerned in the intrinsic or acquired resistance to chemotherapy 13, 14. ER-α gene is located on chromosome 6q25.1, ERα receptor superfamily has the primary function in the development and progression of cancer, it also stimulates mammary epithelial tissue proliferation and differentiation through combining with estrogen 15, 16, 17. However, the allele variant is associated with BC risk in different populations 18. miRNA -152 gene is situated on chromosome 17q21.32 19,20, which has the primary function in regulating biological processes such as differentiation, proliferation, and apoptosis 21, 22.
RAPD technique (Random Amplified polymorphic DNA) can be defined as a DNA fingerprinting technique based on Polymerase Chain Reaction (PCR) amplification of random fragments of genomic DNA with single short primers (markers) of arbitrary nucleotide sequences 23,24. RAPD is a semi-quantitative method more used to detect genetic alterations or polymorphisms in genetic mapping, taxonomy and phylogenetic studies and later in genotoxicity and carcinogenesis studies25. Applying RAPD analysis is used in the studies in genetic instability or genetic alterations of breast cancer 26.
In this study, we performed a new procedure with some modifications to the traditional RAPD technique when we used the amplified gene as a template in RAPD. This procedure resulted in more accuracy and more yielded specific data. We named it PCR-RAPD-PCR (PRP). This study aims to evaluate the genetic polymorphism of the BC gene in breast cancer women patients in Maysan province, south of Iraq.
MATERIALS AND METHODS
Study sites
The study was undertaken in the genetic engineering laboratory/ Department of Biology / College of Science/Misan University. A total of (100) blood samples were collected from the breast cancer women patients and ( 30 ) healthy in Maysan Health Directorate/ AL-Sader Teaching Hospital /AL-Shifa Tumor Treatment Center in/ AL-Amarah city (sub-districts of Maysan province/south of Iraq ).
Samples collection and identification
100 blood samples (2-3 mL) were collected from each breast cancer female patient (in case patient woman in good healthy) or blood samples (1mL) were collected from each breast cancer patient woman (in case the patient woman in critical condition). Blood samples were collected from each woman patient through the median cubital vein or carpel veins (according to a health condition) into EDTA-containing tubes and were stored at -20 ◦C till DNA extraction.
Genomic DNA isolation
All samples were collected from the breast cancer women patients at a different time for three months (September to November). All samples were kept under the same condition. DNA was extracted from whole blood by using the gSYNCTM DNA Extraction Kit Functional Test Data (Geneaid, Taiwan).
Column purification
Genomic DNA was isolated from the blood sample. The amount of isolated DNA was varied from 523.92 to 887.12 ng/µl DNA and an absorbance ratio of A260/280 was obtained in the range of 1.71–1.98 according to 27.
Polymerase chain reaction for isolated PCR product (specific BC genes)
Isolated DNA from all 100 women BC Patient and 30 normal; genomic DNA samples were prepared by pooling the same amount of genomic DNA from each individual. The DNA fragments of the PCR product of BC genes were amplified through the polymerase chain reaction technique. The following components: 2.5 µl primer F, 2.5µl primer R, 2.5µl Nuclease free water, 12.5µl GO Taq ®G2 Green master mix, and 5µl DNA template were added for each 25 reaction mixture. The primer sequences are shown in Table 1.
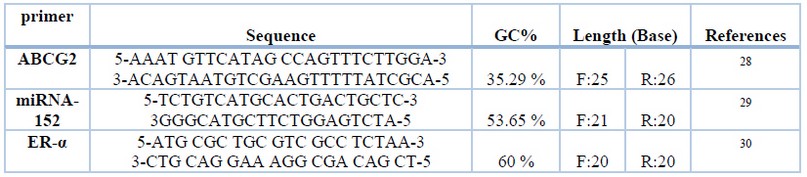
Table 1. Sequence of ABCG2, miRNA-152, ER-α primers, GC% and length
The PCR reaction consisted of 35 cycles following three essential steps: initial denaturation (5 min at 94◦C ), DNA denaturation (1 min at 94 ◦C ), primer annealing ABCG2 (45 sec at gradient 53.5 -58.5 ◦C ), primer annealing ER-α (45 sec at gradient 52-58 ◦C), primer annealing miRNA -152 (15 sec at 65 ◦C ), and primer extension (1 min at 72 ◦C ). There was a Final extension cycle for 7 min at 72 ◦C. The size of the amplified PCR product was subjected to electrophoresis in 1.2 % agarose gel,1X TBE buffer with ethidium bromide 2%, at 80 V for 60 min. The bands were visualized under ultraviolet trans-illumination and photographed in Gel-Doc equipment. The PCR product with a clear band was later used as a template in the PCR - RAPD - PCR Technique.
Purify PCR Product by gel extraction
PCR products were obtained after a conventional PCR run; PCR products were extracted from an agarose gel after gel electrophoresis for breast cancer-related genes using the E.Z.N.A.® Gel Extraction kit protocol (OMEGA BIO-TEK, USA).
Column Purification
PCR product (specific gene) was isolated from the DNA gel extraction, the amount of isolated DNA PCR product (specific gene) was varied from 523.92-887.12 ng/µl and absorbance ratio of A260/280 was obtained in the range of 1.71-1.98.
PCR- RAPD- PCR Technique
The isolated PCR product from all women BC Patient and normal DNA; the same best 40 PCR product (20 patient and 20 control) of ABCG2, ER-α, miRNA-152 genes were chosen for PCR RAPD PCR. The RAPD primer sequencing in the PCR-RAPD-PCR is shown in (Table 2).
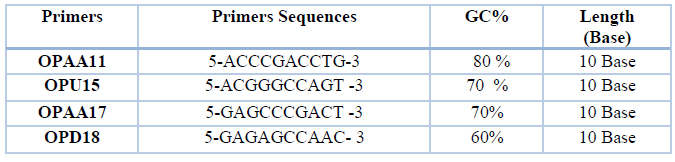
Table 2. Sequence of RAPD primers, GC% and length
The reaction mixture (20 µL) consisted of template PCR product 2.5 µl, 2.5 µL (OPAA11, OPU15, OPAA17, OPD18) RAPD primer, 7.5µl Nuclease free water, and 7.5 µl GO Taq ®G2 Green master mix. The mixture was incubated in the TECHNE prime thermal cycler (with heating lid) programmed for (35-40) cycles, each one consisting of as following: a denaturation step (1 min at 94 ◦C), one annealing step (30 sec at gradient 36-39 ◦C) and an extension step (1 min at 72 ◦C). After the cycling, a final extension for 1.30 min at 72 ◦C was followed by slow cooling to 10 ◦C. Four RAPD primers: (OPAA11, OPU15, OPAA17, OPD18) were used in the amplifications. The primers were obtained from the AUGCT DNA SYN Biotechnology /China company.
Electrophoretic analysis
The reaction products were separated by electrophoresis on an agarose gel (2 %) containing ethidium bromide (2%) were prepared in 1 X TBE buffer. The DNA ladder size marker used in this study contained many discrete bands (in base pair ) 1500, 1000, 900, 800, 700, 600, 500, 400, 300, 200,100,75,50 and 25 bp from the nearest distance to the well to the far one from the well respected. This ladder was used as a molecular size indicator in the experiments of this study. The DNA fragments obtained were visualized under ultraviolet light. The molecular sizes of DNA bands were estimated according to the standard curve representing the relationship between molecular band size of the ladder measured by base pairs and distance of migration bands 31.
Statistical analysis
The relationship between the polymorphic, monomorphic, unique band and RAPD primer of the breast cancer patient and control was assessed using the X2 test; P < 0.05 was considered statistically significant.
RESULTS
PCR-RAPD-PCR
We determined three genes related to breast cancer ( BC), the ABCG2 associated with drug resistance. The ER-α and miRNA -152 genes are associated with receptor estrogen response and regulatory gene. We performed a conventional PCR assay and yielded a single band at approximately 300 bp, 500 bp, 180 bp, respectively. The genetic polymorphism of included genes was done by four RAPD primers (OPAA11, OPU15, OPAA17, and OPD18). We were using amplified BC genes as the template in the PCR-RAPD-PCR technique (PRP). The results of PRP showed that RAPD primers were able to generate polymorphic, monomorphic, unique bands with different ratios between BC patients and control, as shown in figure (1).
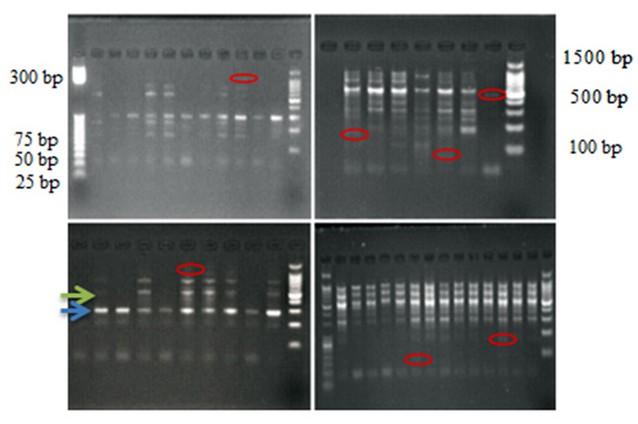
Figure 1. PCR assay for BC-related gene with RAPD primer. Agarose gel of 2% loaded with DNA ladder of (25-1100 bp). And four RAPD primers (OPAA11, OPU 15, OPAA17 and OPD 18) were used. Red circles refer to unique bands. The green arrow refers to the polymorphic band. The Blue arrow refers to the monomorphic band.
Detection primer efficiency and discriminatory power among BC related genes
Our finding showed a difference in the primer discriminatory power among BC related genes in the patient and control; whereas the high discriminatory power in the patient was 40% at OPU15 of ABCG2, the highest primer discriminatory power in control was 42.85 at OPAA11 of ABCG2; the highest primer efficiency in the patient was 0.028 at OPU 15 of ABCG2; while the highest primer efficiency in the control was 0.078 at OPU15 of ER-α, as shown in figure ( 2).
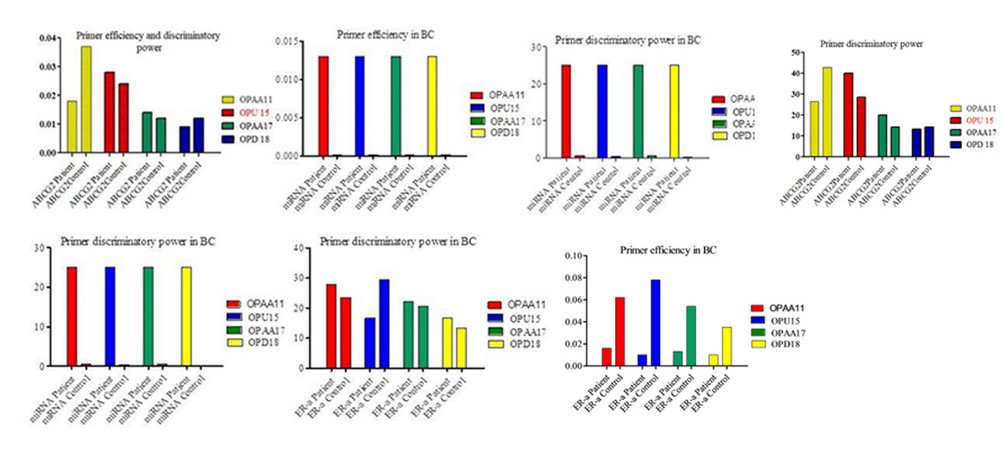
Figure 2. RAPD primer efficiency and discriminatory power in breast cancer-related genes in BC patients and control
Detection genetic polymorphism of breast cancer-related genes
The overall number of bands in the BC patients were (214, 149, 298) band for ABCG2, mi-RNA, ER-α genes respectively, with the total number of bands (661) while the total bands of the control were (162, 93, 128); with Overall total number of (383 ) band, as shown in figure (2,3).
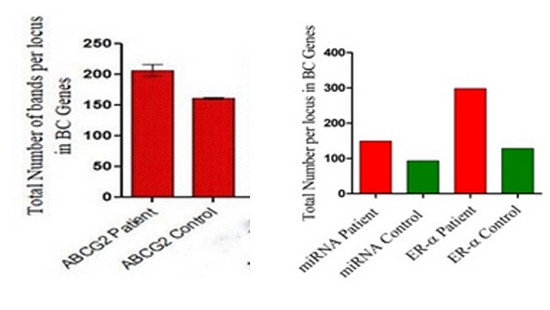
Figure 3. ABCG2, miRNA 152, ER-α genes with the total bands per locus in the BC patients and control.
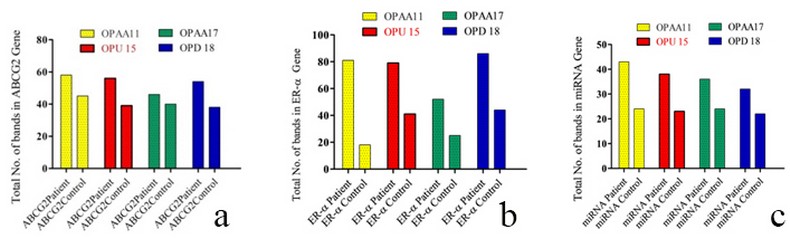
Figure 4. Total number of bands from RAPD primers in breast cancer patient and control ;(a) ABCG2;(b) ER- α; (c) miRNA
The total polymorphic bands in the BC patient of ABCG2,ER-α ,mi-RNA 152 genes were (15, 18, 8 ) respectively, while in control were (14,34,0) bands; The total monomorphic bands in ABCG2,ER-α ,mi-RNA 152 genes of the patients were (12,16,8 ) respectively; while in control were (16, 0, 12) bands; The total unique bands in ABCG2, ER-α, mi-RNA 152 genes were (10, 5, 2) bands in a patient; while in control were (6, 7, 0) bands, as shown in figure (3) and table (3, 4, 5, 6, 7, 8, 9, 10, 11).
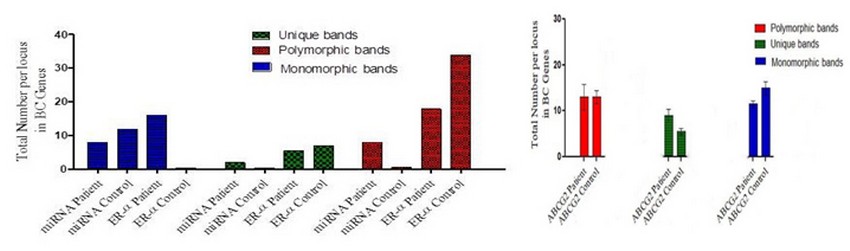
Figure 5. The ability of RAPD primers to generate polymorphic, monomorphic and unique bands
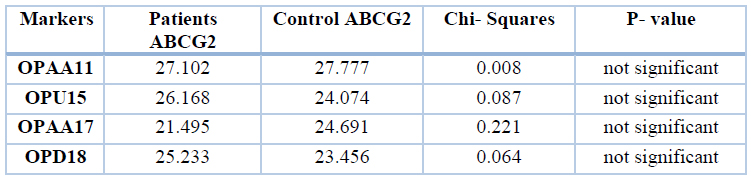
Table 3. Band percentages of patients and control of different markers of ABCG2 gene
The results showed similarity between patients and control regarding total band percentages, the differences between the two groups were not significant. These results compared between 214 bands in patients and 164 bands in control. The results showed no significant differences in polymorphic bands between patients and control regarding the gene ABCG2. Results were compared between 15 bands in patients and 14 bands in control, as shown in table 4.
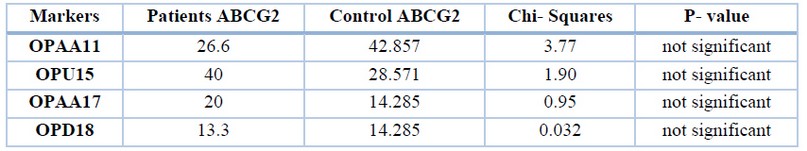
Table 4. Percent of polymorphic bands of different markers of the gene ABCG2 in patients and control groups.
While significant differences (P<0.05) appeared between patients and control in unique bands with the primer OPAA11, OPAA17 and OPU15. The results were compared between 10 bands of patients and 6 bands of control, as shown in table 5.
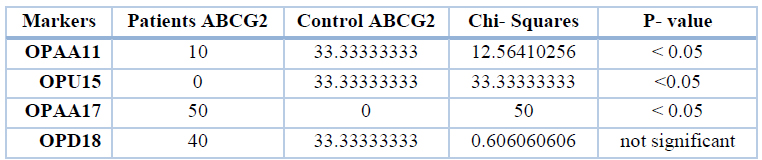
Table 5. Percent of unique bands of different markers of the gene ABCG2 in patients and control groups
As for monomorphic bands, no significant differences were found between the two groups of patients and control of different markers. These results were compared between 12 bands in patients and 16 bands in control, as shown in table 6.
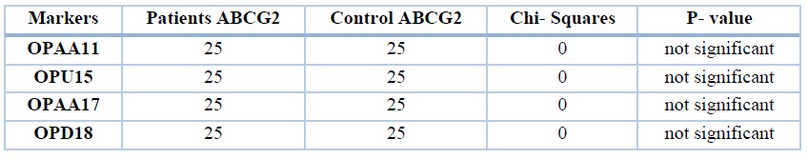
Table 6. Monomorphic band percentages of different markers of ABCG2 gene in patients and control
The total number of bands were similar between patients and control for the gene ERα, except for the primer OPAA11, which revealed a significant difference (P<0.05) between the two groups, for this, we can consider this primer differentiating between patients and control from the genetic view. These results compared between 298 in patients and 128 in control, as shown in table 7.
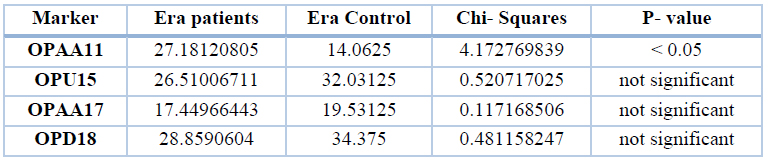
Table 7. Total band percentages of patients and control of different markers of the gene Era
As for the polymorphic bands, the table below showed a significant difference(P<0.05) between patients and control only for the primer OPU15, while the rest primers were not. The results were compared between 18 bands in patients and 34 bands in control, as shown in table 8.
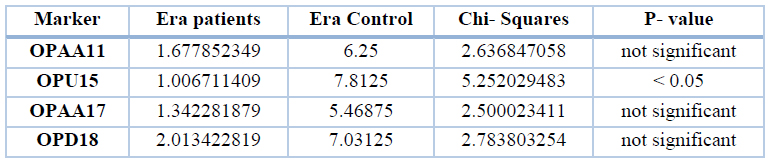
Table 8. Percent of polymorphic bands of different markers of the gene ERa in patients and control groups
When examining the unique bands, a significant difference (P<0.05) between patients and control for the primers OPAA11and OPU15. These results were compared between 5 bands in patients and 7 bands in control, as shown in table 9.
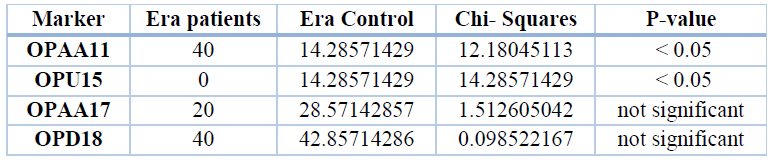
Table 9. Percent of unique bands of different markers of the gene ERa in patients and control groups
All patients showed monomorphic bands, while no monomorphic bands were found in the control group for all primers. When using the Chi-square test to compare patients and control, we noticed the following: The table below includes Chi-square values, data referred to (*) significantly different on the level of 5% while data referred to (**) significantly different on the level of 1%. Thus the patient group was significantly different from the control group in total bands for OPAA17 and OPD18, while bands were similar in both OPAA11 and OPU15, as shown in table 10.
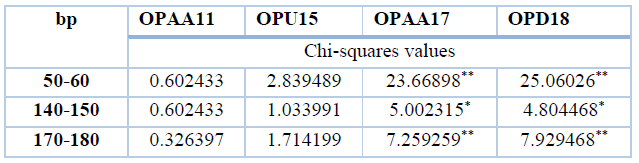
Table 10. Chi-Squares values between patients and control group (miRNA gene) similar bands
There were no significant differences in total bands between the two groups for all the primers. The percentage of total bands was calculated from the total bands of each group (it was 149 in patients and 93 in control). The main difference between the two groups is that there were polymorphic bands in patients and not found in the control group, as shown in table 11.
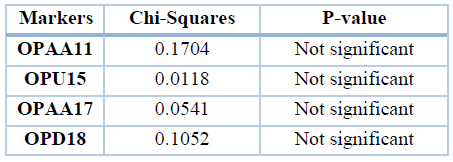
Table 11. Chi-Squares values between patients and control group (miRNA gene) total bands
DISCUSSION
To our knowledge, this is the first study that attempts to estimate the possible role of a polymorphism of the ABCG2, ER-α, miRNA 152 between the BC patients and control by PCR- RAPD- PCR technique.
One of the most common malignancies in women is Breast cancer, with an incidence rate double that of ovarian, stomach, colorectal and cervical cancer and about triple that of lung cancer. Many methods were used to study genetic polymorphism of the genes related to breast cancer, and although the RAPD technique was considered random with reduced reproducibility, we chose it as a rapid and low price technique 32 to gain an initial idea of our data to know the next step of testing. Despite that, we performed a new procedure with some modifications in the traditional RAPD technique when we used the amplified gene as a template in RAPD. This procedure resulted in more bands yielded with more accuracy and specific data. The current study found that the number of bands per primer for each gene was high; this improved RAPD successfully increased the number of RAPD bands produced from a given PCR Product. Therefore, we applied the PCR - RAPD - PCR technique with 3 specific BC genes (ABCG2, ER-α, mi-RNA-152) to generate more bands for detecting genomic alterations in human breast cancer.
Present results showed a reasonable degree of genetic polymorphism detected between normal and breast cancer patients. Our results showed the high genetic polymorphism in breast cancer patients: The total number of bands in the breast cancer patients of (ABCG2, ER-α,miRNA 152) were ( 214, 298, 149 ) respectively, while the total bands in control were (162, 128, 93) respectively. The total number of bands of the genetic polymorphism of the breast cancer were 69 when used extracted total DNA as a template and 6 arbitrary primers 2. The total amplified bands were 72 in the breast cancer patient, 28 in control when extracted total DNA as a template and five arbitrary primers 33.
Our results and modification referred to the success of PCR RAPD PCR in generating a more significant number of bands by using PCR product (specific gene ) as a template instead of total DNA extracted in the study of the genetic polymorphisms of the breast cancer-related genes and their relationship to breast cancer in Maysan province /south of Iraq.
Our results showed the full polymorphic bands in the breast cancer patient of ABCG2, ER-α,miRNA 152 genes were (15,18,8), while in control were (14,34,0), whereas the polymorphic band may be referred to heterozygous genomic regions of the PCR-RAPD-PCR profile.
The total monomorphic bands in the breast cancer patient of ABCG2, ER-α, miRNA -152 genes were (12,16,8) bands, while in control were (16,0,12) bands, whereas the monomorphic band may be referred to homogenous genomic regions of the PCR- RAPD- PCR profile.
The total unique bands in the breast cancer patient of ABCG2, ER-α, miRNA 152 genes were (10,5,2) in the breast cancer patient while (6,7,0) bands were in control.
Our results showed significant differences (P < 0.05) in the unique band of ABCG2 at marker OPAA 11; OPU 15; OPAA 17 between breast cancer patients and control.
Our results showed significant differences (P < 0.05) in the total ER- α at marker OPAA11; Our results showed significant differences in the polymorphic band of ER- α at marker OPU 15 between breast cancer patients and control. Our results showed significant differences in the unique band of ER- α at marker OPAA11; OPU 15 between breast cancer patients and control.
Our results showed there are significant differences in the bands that had been size (50-60) bp ; (140 - 150) bp ; (170-180 ) bp of miRNA-152 at marker OPAA17; OPD 18 between breast cancer patients and control. We suggested that the differences in the number of bands between breast cancer patients and control are probably due to the nucleotides sequence of the primers ( markers) and on the genotype of the breast cancer patients. It is noteworthy, the number of compatible sites of primer in the (ABCG2, ER-α, mi-RNA-152) genes of the breast cancer patients which is affected by different types of mutations and translocations, this will affect the primer (marker) and the template interaction sites and will result in the loss or profit of bands; as a result, this will leads to differences in the number of amplified bands the ability of RAPD analysis to detect the genetic instability or genetic alterations which represents the differences between a standard and malignant cell that may comprise insertion, deletion and alteration in the oncogenes or suppressor genes that could cause cancer 25.
Our results showed differences in the size of the fragments between patients and control might be referred to the polymorphism that includes the differences in molecular weights of amplified bands which product from multiple types of mutations and translocations occurred, thus causing mobility shift of bands and probably cause the addition of new bands 34,35,36,37, 38.
Our finding showed differences in the primer discriminatory power between patient and control; our results showed that the high discriminatory power in breast cancer patients was 40% at OPU15 of ABCG2, the highest primer discriminatory power was in contrast the control was 42.85% at OPAA11of ABCG2. The primer's capacity to show polymorphisms in comparison to polymorphisms shown by all primers is called primer discriminatory power 39, 2.
Our results showed that the highest primer efficiency in the breast cancer patient was 0.028 at OPU15 of the ABCG2 gene; while the highest primer efficiency in the control was 0.078 at OPU15 of ER- α gene. The primer efficiency values range from (0 -1) and are defined as the measure of the primer's ability to result in polymorphisms 40.
CONCLUSIONS
Our results proved the accuracy of our modification in the traditional RAPD technique, which yielded more specific bands related to genes; this test also showed us high polymorphism in patients compared to control, which may be related to mutations or mutations modifications. Although our study did not include genes concerned with family history incidence of breast cancer, we suggested from our data that most breast cancers in Iraqi women are not family related but rather drug resistance and estrogen response. We can predict and early diagnose breast cancer upon analysis of our chosen genes; our study allows us to employ these genes in the early prediction of breast cancer.
Authors contributions: Conceptualization, MAD and ZZG; methodology, MAD; software, ZZG; validation, ZZG and MAD; formal analysis, ZZG; investigation, MAD; resources, ZZG; data curation, MAD; writing—original draft preparation, ZZG; writing review and editing, MAD; visualization, ZZG; supervision, MAD; project administration, MAD. All authors have read and agreed to the published version of the manuscript.
Funding: This research received no external funding.
Institutional Review Board: Both the Misan health directorate and AL-Shifa Tumor Treatment center had been informed about the study's aims before collecting blood samples, all declare their agreement of giving samples (255; 13/9/2020). The study follows the rules of scientific research of Misan University, Iraq.
Informed Consent:
Informed consent was obtained from all subjects involved in the study. The patient's consent was oral.
Acknowledgment:
Many profound thanks to Maysan Health Directorate/ AL-Sader Teaching Hospital /AL-Shifa Tumor Treatment Center, especially Assist. Prof. Dr. Haider Sadun Qasim and all the staff of the /AL-Shifa Tumor Treatment center to facilitate the collection of blood samples and provide support to graduate students. My thanks and appreciation to all breast cancer women patients and ordinary people for their consent to draw blood samples. Also, we would like to express thanks to the genetic engineering laboratory/Department of Biology/College of Science/Misan University and all the staff of the genetic engineering laboratory; thank you to M.SC.Shaima Rabie Bannon.
Conflicts of interest:
The authors declare no conflict of interest.
REFERENCES
1. Jin Y. Blood DNA methylation as a surrogate epigenetic biomarker in study of night shift work and breast cancer. Doctoral dissertation, Yale University. 2020.
2. Ismaeel HM. Identification of genomic markers by RAPD–PCR Primers in Iraq Breast Cancer patients. Iraq J Sci. 2013;54:97-104.
3. Mohammed ZA. Determination of Serum IL-8 Level in Women with Breast Cancer and Their Correlation With Disease Progression. Iraqi Journal of Cancer and Medical Genetics. 2018 Jan 12;4(2).
4. Al Hannan F, Keogh MB, Taha S, Al Buainain L. Characterization of BRCA1 and BRCA2 genetic variants in a cohort of Bahraini breast cancer patients using next‐generation sequencing. Molecular genetics & genomic medicine. 2019 Jul;7(7):e00771.
5. Antoniou A, Pharoah PD, Narod S, Risch HA, Eyfjord JE, Hopper JL, Loman N, Olsson H, Johannsson O, Borg Å, Pasini B.Average risks of breast and ovarian cancer associated with BRCA1 or BRCA2 mutations detected in case series unselected for family history: a combined analysis of 22 studies. The American Journal of Human Genetics. 2003 May 1;72(5):1117-30.
6. Sabra SA, Saad AA, Abd El Moneim NA, Hemida MA, Moussa N, Haroun M. Evaluation of breast cancer regarding molecular and immunochemical markers. International Journal of Immunotherapy and Cancer Research. 2020 Feb 20;6(1):001-9.
7. Banoon SR, Ghasemian A. The Characters of Graphene Oxide Nanoparticles and Doxorubicin Against HCT-116 Colorectal Cancer Cells In Vitro. Journal of Gastrointestinal Cancer. 2021 Mar 19:1-5.
8. Xie Z. A systematic review: breast cancer susceptibility genes. InE3S Web of Conferences 2020 (Vol. 218). EDP Sciences.
9. Sun YS, Zhao Z, Yang ZN, Xu F, Lu HJ, Zhu ZY, Shi W, Jiang J, Yao PP, Zhu HP. Risk factors and preventions of breast cancer. International journal of biological sciences. 2017;13(11):1387.
10. Ni Z, Mark ME, Cai X, Mao Q. Fluorescence resonance energy transfer (FRET) analysis demonstrates dimer/oligomer formation of the human breast cancer resistance protein (BCRP/ABCG2) in intact cells. International journal of biochemistry and molecular biology. 2010;1(1):1.
11. Haider AJ, Briggs D, Self TJ, Chilvers HL, Holliday ND, Kerr ID. Dimerization of ABCG2 analysed by bimolecular fluorescence complementation. PLoS One. 2011 Oct 3;6(10):e25818.
12. Chen L, Manautou JE, Rasmussen TP, Zhong XB. Development of precision medicine approaches based on inter-individual variability of BCRP/ABCG2. Acta Pharmaceutica Sinica B. 2019 Jul 1;9(4):659-74.
13. Manandhar S, Kim CG, Lee SH, Kang SH, Basnet N, Lee YM. Exostosin 1 regulates cancer cell stemness in doxorubicin-resistant breast cancer cells. Oncotarget. 2017 Sep 19;8(41):70521.
14. Nayak D, Tripathi N, Kathuria D, Siddharth S, Nayak A, Bharatam PV, Kundu C. Quinacrine and curcumin synergistically increased the breast cancer stem cells death by inhibiting ABCG2 and modulating DNA damage repair pathway. The international journal of biochemistry & cell biology. 2020 Feb 1;119:105682.
15. Ponglikitmongkol M, Green S, Chambon P. Genomic organization of the human oestrogen receptor gene. The EMBO journal. 1988 Nov;7(11):3385-8.
16. Abd Ellatif M, Zahran MA, Denaiwar A, Elbaz A, Abdel Azeez HA. Study of polymorphism of the estrogen receptor alpha gene as a genetic marker for the risk of breast cancer. IJCEBS. 2016;4:16-22.
17. Al-Amri RJ, Alotibi MK, Al-Raddadi RI, Shebli WT, Fallatah EI, Alhujaily AS, Mohamed HS. Estrogen Receptor 1 Gene (ESR1) rs2234693 Polymorphism and Breast Cancer Risk in Saudi Women. Asian Pacific Journal of Cancer Prevention: APJCP. 2020 Nov;21(11):3235.
18. Chauhan P, Yadav R, Kaushal V, Kadian L. Evaluation of genetic polymorphism in estrogen receptor α gene as breast cancer risk. Biomed Res. 2019;30:72.
19. Zhou X, Zhao F, Wang ZN, Song YX, Chang H, Chiang Y, Xu HM. Altered expression of miR-152 and miR-148a in ovarian cancer is related to cell proliferation. Oncology reports. 2012 Feb 1;27(2):447-54.
20. Liu X, Li J, Qin F, Dai S. miR-152 as a tumor suppressor microRNA: Target recognition and regulation in cancer. Oncology letters. 2016 May 9;11(6):3911-6.
21. Md J. lund aH: Microrna and cancer. Mol oncol. 2012;6:590-610.
22. Ge S, Wang D, Kong Q, Gao W, Sun J. Function of miR-152 as a tumor suppressor in human breast cancer by targeting PIK3CA. Oncology research. 2017;25(8):1363.
23. Kumar NS, Gurusubramanian G. Random amplified polymorphic DNA (RAPD) markers and its applications. Sci Vis. 2011 Jul;11(3):116-24.
24. Sharma M, Singh D. Utility of random amplified polymorphic DNA (RAPD) in forensic entomology. Int J Sci Res Sci Technol. 2017;3(1):56-8.
25. Atienzar FA, Jha AN. The random amplified polymorphic DNA (RAPD) assay and related techniques applied to genotoxicity and carcinogenesis studies: a critical review. Mutation Research/Reviews in Mutation Research. 2006 Nov 1;613(2-3):76-102.
26. Novikov VV, Shumilova SV, Novikov DV, Kalugin AV, Fomina SG, Karaulov AV. Genetic Instability in Locus rs5498 E469K (A/G) of ICAM-1 Gene in Patients with Colorectal Cancer and Breast Cancer. Bulletin of experimental biology and medicine. 2016 Apr;160(6):811-3.
27. Surzycki S. Basic techniques in molecular biology. Springer Science & Business Media; 2012 Dec 6.
28. Wu H, Liu Y, Kang H, Xiao Q, Yao W, Zhao H, Wang E, Wei M. Genetic variations in ABCG2 gene predict breast carcinoma susceptibility and clinical outcomes after treatment with anthracycline-based chemotherapy. BioMed research international. 2015 Nov 8;2015.
29. Nguyen-Dien GT, Smith RA, Haupt LM, Griffiths LR, Nguyen HT. Genetic polymorphisms in miRNAs targeting the estrogen receptor and their effect on breast cancer risk. Meta gene. 2014 Dec 1;2:226-36.
30. Sato H, Nogueira-de-Souza NC, D'Amora P, Silva ID, Girão MJ, Schor E. Intron 1 and exon 1 alpha estrogen receptor gene polymorphisms in women with endometriosis. Fertility and sterility. 2008 Dec 1;90(6):2086-90.
31. Sambrook J, Russell DW. Molecular cloning: A laboratory manual. Mol. Cloning A Lab. Man. 2001.
32. Bidet P, Lalande V, Salauze B, Burghoffer B, Avesani V, Delmée M, Rossier A, Barbut F, Petit JC. Comparison of PCR-ribotyping, arbitrarily primed PCR, and pulsed-field gel electrophoresis for typing Clostridium difficile. Journal of clinical microbiology. 2000 Jul 1;38(7):2484-7.
33. Al-Askeri MA. Genetic Polymorphism in Iraqi Females Diagnosed with Breast Cancer Using Random Amplification of Polymorphic DNA Technique. INTERNATIONAL JOURNAL OF PHARMTECH RESEARCH. 2016;9(11):312-6.
34. Misra A, Sulaiman IM, Sinha S, Sarkar C, Mahapatra AK, Hasnain SE. Genetic alterations in brain tumors identified by RAPD analysis. Gene. 1998 Jan 5;206(1):45-8.
35. Ong TM, Song B, Qian HW, Wu ZL, Whong WZ. Detection of genomic instability in lung cancer tissues by random amplified polymorphic DNA analysis. Carcinogenesis. 1998 Jan 1;19(1):233-5.
36. Papadopoulos S, Benter T, Anastassiou G, Pape M, Gerhard S, Bornfeld N, Ludwig WD, Dörken B. Assessment of genomic instability in breast cancer and uveal melanoma by random amplified polymorphic DNA analysis. International journal of cancer. 2002 May 10;99(2):193-200.
37. Xian ZH, Cong WM, Zhang SH, Wu MC. Genetic alterations of hepatocellular carcinoma by random amplified polymorphic DNA analysis and cloning sequencing of tumor differential DNA fragment. World Journal of Gastroenterology: WJG. 2005 Jul 14;11(26):4102.
38. Ibrahim M, Saleh N, Archoukieh E, Al-Obaide H, Al-Obaidi M, Said H. Detection of Novel Genomic Polymorphism Detection of Novel Genomic Polymorphism in Acute Lymphoblastic Leukemia by Random Amplified Polymorphic DNA Analysis. int. J. can. Res. 2010;6:19-26.
39. Grundmann H, Schneider C, Hartung D, Daschner FD, Pitt TL. Discriminatory power of three DNA-based typing techniques for Pseudomonas aeruginosa. Journal of Clinical Microbiology. 1995 Mar;33(3):528-34.
40. Newton CR, Graham A. Polymerase chain reaction. Bios. Scientific Publishers Ltd., Oxford, UK. 1997.
Received: 15 August / Accepted: 20 October 2021 / Published: date. 15 February 2022
Citation: Gataa Allami Z, Abdulkadhim Dragh M. Identification of Some Breast Cancer Related Genes by RAPD Technique in Maysan Province, Iraq. Revis Bionatura 2022;7(1). 20. http://dx.doi.org/10.21931/RB/2022.07.01.20