2022.07.02.47
Files > Volume 7 > Vol 7 No 2 2022

Rawya Nathem Rashed1
1 Umm Al-rabeein High School for Outstanding Students _Directorate General of Education Nineveh. Mosul - Iraq
Corresponding author. [email protected]
Available from: http://dx.doi.org/10.21931/RB/2022.07.02.47
ABSTRACT
Define anemia is the low concentration in the amount of hemoglobin according to age, sex and trimester pregnancy. The pregnant has three trimesters and has an exceptional hemoglobin range in every trimester. The pregnant has 124-135 g/dl in the 1st trimester, 110-117 g/dl in the 2nd trimester and 106-109 g/dl in the 3rd trimester. Many pregnant females had been found with anemia because of a low level of Iron. This leads to megaloblastic anemia because of iron deficiency anemia and B12 Vitamin, diet, gastrectomy, malabsorption, blood loss and physiological demand (pregnancy infancy and adolescence). The blood consists of Hemoglobin (Heam + globin) Heam and Iron protoporphyrin ring. Globin is the type of protein with a specific length of amino acid and a specific type of A, maybe 2 Alpha 2 Beta called A1 or 2 Alpha and 2 Bata called A2 or 2Alpha and Gamma called F Fetal. The production of hemoglobin depends on the previously mentioned factors. In this study, we focused on some factors associated with the amount of blood and how these factors affected anemia, which is the most important in Iron treatments, with considering other factors such as food, diversity, Economic situation, social status, number of the fetus, and number of pregnancies. Statistical analysis was used to detect the effect factors of anemia in pregnant. This study refers to 23.2% of anemia because of Iron deficiency during pregnancy. So, treatment of Iron deficiency reduces anemia during pregnancy time.
Keywords. Anemia; Hemoglobin; Pregnant Woman
INTRODUCTION
During pregnancy, anemia is a disease that is still one of the significant public health concerns worldwide because of its highly prevalent, especially in developed countries such as Sub-Saharan Africa and Southeast Asia.1 In addition to causing maternal morbidity and death, it is a significant factor in poor pregnancy outcomes. A woman's risk of postpartum hemorrhage, pregnancy-induced hypertension, postnatal sepsis, a greater chance of preterm delivery, small-for-gestational-age and low birth weight infants, stillbirth, and other adverse perinatal outcomes increases if she has anemia during pregnancy.2 For developing nations with weak health systems, such as those in Sub-Saharan Africa and Southeast Asia, the economic cost of an anemic pregnancy and its repercussions are tremendous. This scenario has lasted for many years despite the availability of low-cost but very effective interventions, such as iron-foliate supplementation in pregnancy.3
According to the World Health Organization, about 38 percent of pregnant women worldwide were anemic in 2011.4
Several researchers have investigated anemia in pregnancy throughout the globe with varying results. According to research, anemia was detected in 42.6 % of pregnant women in Kathmandu, Nepal. The majority (90.8 %) had mild anemia, 7.1 % had moderate anemia, and 2.7 % had severe anemia.5 In a study of the prevalence and risk factors for anemia in pregnancy, researchers in urban Pakistan discovered that 90.5 % of the study participants were anemic. The majority (75%) had mild anemia, 14.8 % had moderate anemia, and the rest had severe anemia.6 Institution-based cross-sectional research evaluating the prevalence and determinants of maternal anemia in Northwest Ethiopia found that 16.6% of pregnant women had anemia, with 64% having mild anemia.7 In a study of anemia in pregnancy and its related variables in Southern Ethiopia, researchers discovered that 39.9% of study participants were anemic. 60 % of anemic women had moderate anemia, 30.3 % had mild anemia, and 9.7% were severely anemic.8 Anemia was prevalent among booked antenatal customers in Puducherry, India, with 83 % of pregnant women anemic.9 According to research, anemia was shared among pregnant women in Northern Tanzania, with 74.5 % having mild anemic, 20.9 % having moderate anemic, and 4.5 % having severe anemic.10 Anemia was prevalent among pregnant women in Gombe, Nigeria, with a frequency of 51.8 %. Mild anemic was discovered in 67.4 % of research participants, moderate anemic in 30.5 %, and severe anemic in 2.1 %.11 In Zaria, anemia and iron deficiency were tested among pregnant women, and 12.2% of the women were anemic.12 Anemia in pregnancy was prevalent in 32.3 % of South Nigerian pregnant women seeking prenatal care in a missionary hospital; according to retrospective research, researchers in Enugu, Southeastern Nigeria, discovered that the prevalence of anemic in pregnancy was 40.4 % at the time of booking. Anemia was mild in 90.7 % of these women, with severe anemic accounting for 9.3% of the cases.
There were no cases of severe anemic recorded.13 In cross-sectional research of hematocrit and arm preference for blood collection among pregnant women in Southeastern Nigeria, it was discovered that 28% of the women were anemic, with 94.6 % mildly anemic.14 Cross-sectional descriptive research in Ilesha, Southwest Nigeria, found that 62.2 % of the women examined were anemic, with 2% having severe anemic 15 . In a study of the sociodemographic variables of anemic in pregnancy, researchers discovered a frequency of 32.8 % in Oyo State, Southwestern Nigeria.16 In Ibadan, Southwest Nigeria, researchers discovered that 30 % of their study participants — pregnant women – were anemic.
A study of pregnant women in Abeokuta, Southwest Nigeria, found that 76.5 % were anemic, with 40.3 % having mild anemic, 57.8% having moderate anemic, and just 1.9 % having severe anemic.17 Anemia in pregnancy was prevalent in 35.3 % of pregnant women in cross-sectional research conducted at a tertiary hospital in Lagos, Southwest Nigeria.18 According to medical and allied literature, anemia in pregnancy has been linked to several variables. Age, parity, gravidity, personal and family income, household size, level of education, poor socioeconomic position, short birth intervals, and greater gestational age at booking, especially booking in the third trimester, are all recognized factors linked to anemic.19,20,21,22
Anemia in pregnant women has also been linked to maternal and fetal anthropometry. Ethiopian researchers showed low body mass index (BMI) as an independent predictor of anemic in pregnancy. In a study of pregnant urban women in Pakistan, non-anemic women's height, weight, and BMI were substantially more significant than their anemic counterparts. Anemia in pregnancy has been linked to dietary variables such as intake of fruit, red meat, eggs, and tea before and during pregnancy and ingestion of nonfood elements such as clay, dirt, and so on (pica).23 Anemia has also been linked to anthropometry, nutrition, and socioeconomic position among women who are not pregnant. 24,25 In China, women from higher and medium-income categories were more likely to be anemic than those from lower socioeconomic levels. Many studies have investigated the relations between family food security and different nutritional characteristics in women of reproductive age, such as anemic, dietary consumption, and anthropometry.26,27,28 In Ogun State, Nigeria, primary health-care facilities (PHCs) are the initial point of contact for most patients with the organized health system. PHCs provide a broad range of primary care services, including illness prevention, health promotion, and curative treatment. Antenatal care is an essential part of Sagamu's mother and child health services. As a result, the prevalence of anemic and its related variables among pregnant primary care customers in Sagamu, Southwest Nigeria, was evaluated in this research.
According to medical and allied literature, anemia in pregnancy has been linked to several variables. Some recognized characteristics linked with anemic include age, parity, gravidity, personal and family income, household size, level of education, poor socioeconomic position, short birth intervals, and greater gestational age at booking, especially booking in the third trimester.29,30,31,32,33 Anemia in pregnant women has also been linked to maternal and fetal anthropometry. Ethiopian researchers showed low body mass index (BMI) as an independent predictor of anemic in pregnancy. In a study of pregnant urban women in Pakistan, the height, weight, and BMI of non-anemic women were substantially more significant than those of anemic women. Anemia in pregnancy has been linked to dietary variables such as intake of fruit, red meat, eggs, and tea before and during pregnancy and ingestion of nonfood elements such as clay, dirt, and so on (pica).34.35 Anemia has also been linked to anthropometry, nutrition, and socioeconomic position among women of reproductive age who are not pregnant.36,37,38 In China, women in upper and medium socioeconomic categories were more likely to be anemic than their low-income counterparts. Many studies have investigated the relations between family food security and different nutritional characteristics in women of reproductive age, such as anemic, dietary consumption, and anthropometry. In Ogun State, Nigeria, primary health-care facilities (PHCs) are the initial point of contact for most patients with the organized health system. PHCs provide a broad range of primary care services, including illness prevention, health promotion, and curative treatment. Antenatal care is an integral part of Sagamu's mother and child health services. As a result, the frequency of anemic and its related variables among pregnant primary care customers in Mosul, Iraq, was evaluated in this research.
MATERIALS AND METHODS
Data collection tool
Data were collected through direct interviews with the pregnant women; the questionnaire will involve information's regarding:
1- Sociodemographic characteristics like age, educational state, occupation, and house condition.
2- Obstetric history: para, gravida, single, twin, spacing between pregnancies, any complications during pregnancy like placenta prevail, abruption placentae, preeclampsia, morning sickness in the 1sttrimester, antenatal care visits and iron supplements.
3- Nutritional history: daily tea intake, fresh fruits, vegetables, meat and fish.
4- Parameters: hemoglobin level before pregnancy.
5- Hemoglobin level in the 3rd trimester of pregnancy
Individual blood sample collection and analysis
Laboratory technicians performed hemoglobin analysis for 300 pregnant women at each center's health post. Each pregnant woman's hemoglobin concentration was measured by taking a finger-prick blood sample and testing it using a HemoCue Hb 301 device (HemoCue AB, Angelholm, Sweden). After cleaning the location with disinfectant, a puncture was performed on the tip of the middle finger. The first drop of blood was washed off, and the second drop was collected to fill the micro cuvette, which was then put in the cuvette holder of the hemoglobin concentration measurement instrument. The meter's performance was verified regularly using a control standard to improve test reliability. When the meter was ready to utilize capillary blood, the micro cuvette container was moved to its loading position, and the sample for analysis was loaded in one continuous operation. It was put in the holder and pressed into its measurement position within 10 minutes after being filled. Finally, utilizing WHO's field survey recommended techniques39, the result was presented and recorded after 15–60 seconds. Hemoglobin levels were classified into three categories: mild anemic (11–13 g/dl), moderate anemic (9-10.9 g/dl), and severe anemic (7 g/dl). The following formula was used to modify the hemoglobin level for altitude—assessment of dietary, food security, and wealth. Dietary variety scores for women were calculated using FAO standards40. The score was computed, and the tertiles were assigned (low, medium and high). Dark green leafy vegetables, cereals/starchy staples, vitamin A-rich fruits and vegetables, oils/fat, seeds, nuts, legumes and other fruits and vegetables, organ meat, meat and fish, milk and products, and egg were the nine food groups that the pregnant women reported eating the day before the survey. The first level, second level 1, and third-level 2 were assigned to participants who had eaten (at least once) the meal in each subgroup.
The wealth index was built using multi variables related to ownership of selected household assets using a principal components analysis adapted from41 Some of them are the source of drinking water, household facility(such as TV, Radio, Cell phone, etc.), type of toilet facility, fuel types, building materials and designs, owning a car, and owning a house.
Data analysis and processing
For analysis, the data was coded and put into SPSS version 25. Descriptive statistics (frequency and percentage) were employed to analyze categorical data, while range, mean, and standard deviation displayed continuous variables. The criteria p> 0.05 were used to create a single multivariate model. Before and after pregnancy, a T-test was performed to investigate the connection between test and anemia factors.
RESULTS
The sample analysis result produced the statue of the pregnant women who agreed to participate in the interviews. Their answers were classified and arranged according to the factors (Table1). 23% of the test sample has a good economic condition. 52% have meddled economic status, while 25 % of the pregnant women low economic status. The homemaker's women pregnancy was (69%) and (31%) were employees. (Table1) The nutrition of pregnant women was excellent. The percentage of women eating fruits, vegetables, fish, etc. was very high, 51.5% of them ate daily, while 27% of the women ate fruits weekly and 21.5% of them ate it monthly (Table1) Sociodemographic and economic characteristics, 150 pregnant women had participated in the study. The mean of age ± calculated standard deviation of the participants women was 26 ± (8) years. (38.7%) were 18–24 years old, and (34.6%) were 25–28. (22%) were in the age range of 29–33 and 4.7 from 34 years and above women. Table (2)

Table 1. Shows the percentage the statue of pregnant women entering the test with the element factor
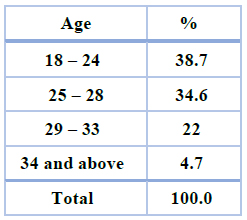
Table 2. Age of the pregnancy women
The women who took Iron in the first part of pregnancy were 69.1% of all pregnant women who entered the test,20.6% were mild, 38.1% were moderate, and 9.8% were severe. While those who did not take Iron were 30.1%, 10.8% were mild, 10.6% moderate and 4.4% severed and in the third trimester of pregnancy, 74.8% took Iron, 23.8% were mild, 41.4% were moderate, and 9.6% were severe. While those who did not take Iron were 25.2 %, 10.2% were mild, 10.6% moderate, and 4.4% were severe. As shown in Figure (1).
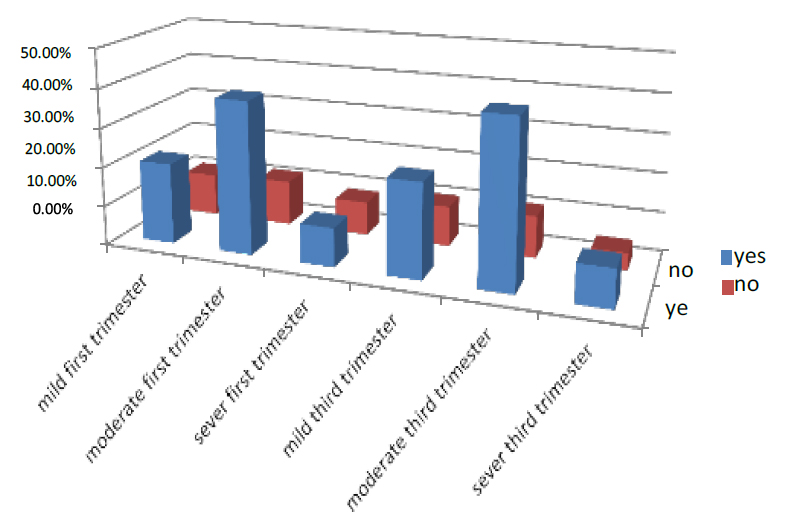
Figure 1. Shows the treatment of pregnant women with Iron
While The women who took on ANC in the first part of pregnancy were 71.5% of all pregnant women who entered the test. 38.2% were mild, 26.5% moderate, and 6.8% severe. While those who did not take Iron were 28.5%, 11.2% were mild, 12.3% moderate, and 5.0% were severe. And in the third trimester of pregnancy, 75.6% who take on ANC, 40.8% were mild, 29.8% were moderate, and 5% were severe. While those who did not take Iron were 24.4%, 40.8% were mild, 29.8% moderate, and 4.7% were severe. As shown in Figure (2)
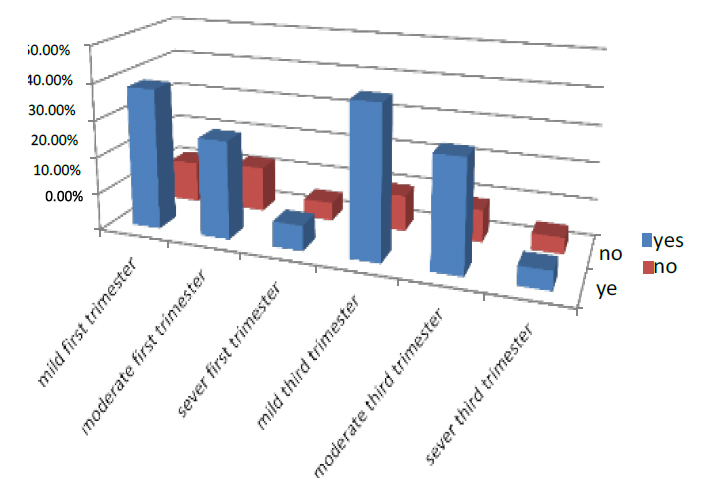
Figure 2. Illustrates how pregnant women are treated with ANC
The economic status is divided into three-part good, middle and low; the women who had good status in the first part of pregnancy were 23 of all pregnant women who entered the test. 12% were mild, 8% were moderate, and 3% were severing. While those with middle status were 52%, 15.6% were mild, 34.3% moderate, and 2.1% were severe. And the women have low status were 25%. Those with mild were 5% and 6.2% moderate, while 5% were low.
The women who had good status in the third part of pregnancy were 23 % of all pregnant women who entered the test. 12% were mild, 8.3% were moderate, and 2.7% were severing. While those with meddle status were 52%, 15% were mild, 33.8% moderate, and 5.8% were severe. And the women have low status were 25%. Those with mild were 2.7% and 2.2% moderate, while 14% were low. As shown in Figure (3)
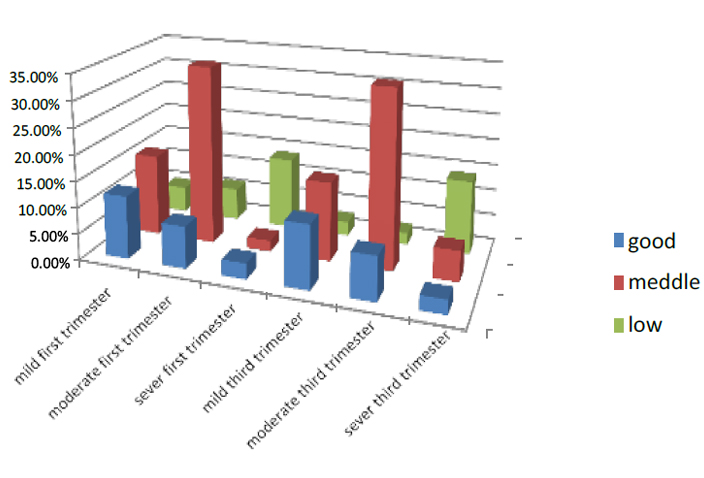
Figure 3. Illustrates pregnant women's economic status
The visited doctor in the first trimester is divided into three parts weekly, monthly, and no visiting, the women who visited the doctor weekly in the first part of pregnancy were 14 % of all pregnant women who entered the test. 2.2% were mild, 2% were moderate, and 9.8% were severe. While those who visited the doctor monthly were 63.5%, 8% were mild, 14.2% moderate, and 41.3% were severe, and the women no visited were 22.5%, those who had mild were 3.7%, and 2.3% were moderate, while 5% were low.
In the third trimester, the women who visited the doctor weekly in the first part of pregnancy were 6.5 % of all pregnant women who entered the test. 1.3% were mild, 1.9% were moderate, and 6.5% were severe. While those who visited the doctor monthly were 56.8%, 4.7% were mild, 12.6 % moderate, and 3.7 % were severe, and the women no visited were 34%
those who had mild were 10.5%, and 19.8% were moderate, while 3.7% were low. As shown in Figure (4)
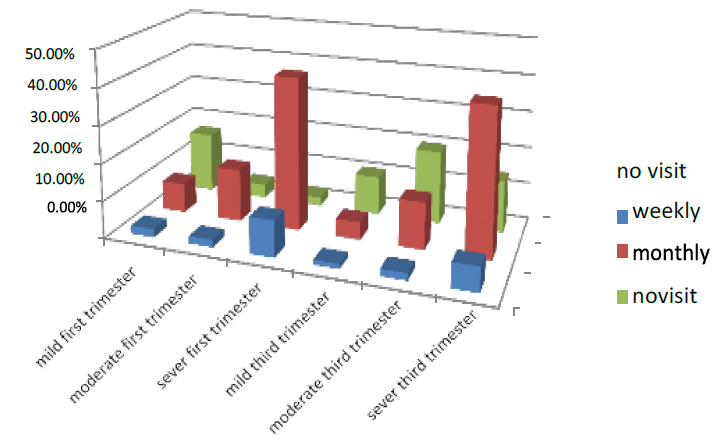
Figure 4. Shows who have visited the doctor the pregnant women
The complication in the first part of pregnancy was 31.9% of all pregnant women who entered the test. 4.8% were mild, 9.5% were moderate, and 17.6% were severe. While women in 1st trimester who had no compilation were 68.1%, 46.5% were mild, 19.3% moderate, and 2.3% were severe. In the third trimester of pregnancy, 47.1% had complications, 2% were mild, 12.6% were moderate, and 32.5% were severe. While those who had no complications were 56.1 %, 35.6% were mild, 13.7% moderate, and 6.8% were severe. As shown in Figure (5)
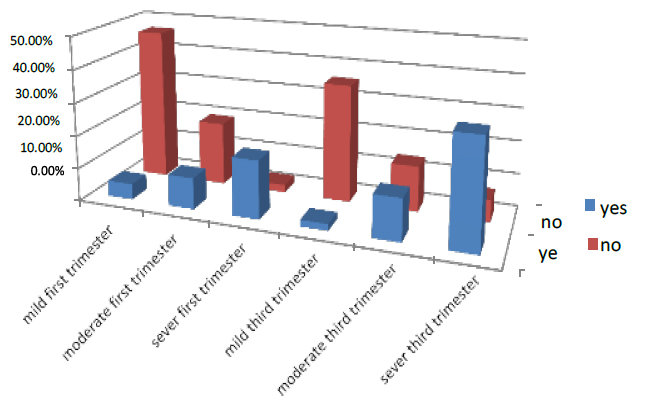
Figure 5. Shows the treatment of pregnant women with complication factor
The non-pregnants in the first trimester were divided into three parts singles, twins and three & above, the women who have single in the first part of pregnancy were 73.5 % of all pregnant women who entered the test. 27.7% were mild, 45% were moderate, and 1% were severe. While those who have twins were 25.5%, 4.5% were mild, 10% moderate, and 11% were severe, and the women have three & above were 1% .those who had mild were 0%, and 0% were moderate, while 1% were low.
In the third trimester, the women who have single in the first part of pregnancy were 73.5 % of all pregnant women who entered the test. 23% were mild, 48% were moderate, and 2.5% were severe. While those who have twins were 25.5%, 1.5% were mild, 8% moderate, and 16% were severe, and the women have three & above were 1% .those who had mild were 0%, and 0% were moderate, while 1% were low. As shown in Figure (6)
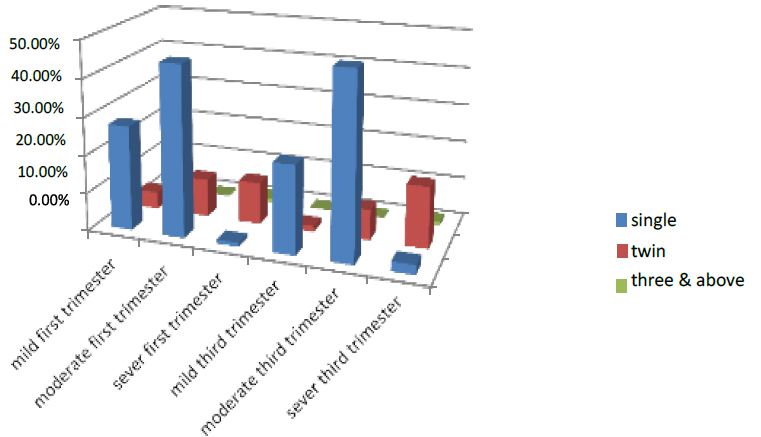
Figure 6. Shows the No. pregnant of the pregnant women
The sickness in the first part of pregnancy was 43.6% of all pregnant women who entered the test. 24.2% were mild, 6.8% moderate, and 12.6% severe. While those who did not have sickness were 56.4%, 38.5% were mild, 13.6% moderate, and 4.3% were severe in the third trimester of pregnancy, 38.5% had sickness, 20.4% were mild, 5.6% were moderate, and 12.5% were severe. While those who did not have sickness were 56.4 %, 42.4% were mild, 15.3% moderate, and 3.8% severe. As shown in Figure (7)
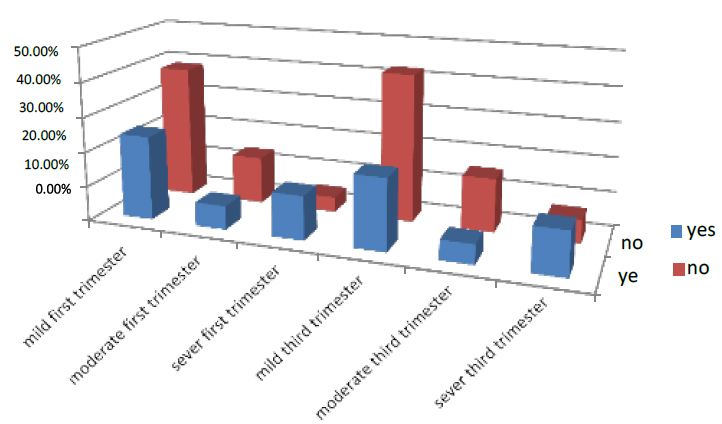
Figure 7. Shows the treatment of pregnant women with sickness Factor
In the first part of pregnancy, the UTI was 47.4% of all pregnant women who entered the test. 15.6% were mild, 23.5% were moderate, and 8.3% were severe. While those who did not have UTI were 52.6%, 15% were mild, 17% moderate, and 21.7% were severe. In the third trimester of pregnancy, 45.6 % suffered from UTI, 16.5% were mild, 20% were moderate, and 9.1% were severe. While those who did not have UTI were 54.4 %, 13% were mild, 15% moderate, and 26.4% were severe. As shown in Figure (8).
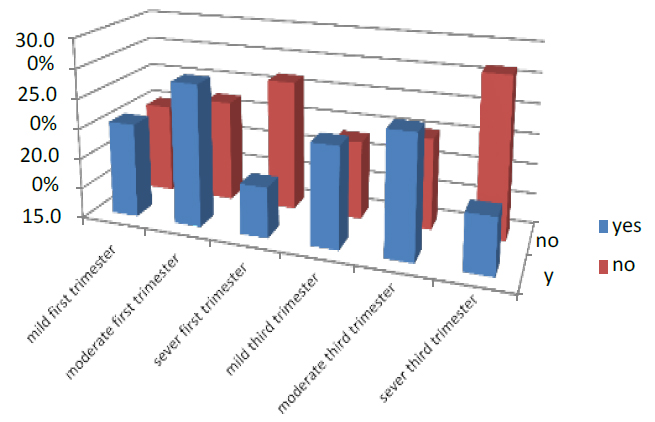
Figure 8. Shows the treatment of pregnant women with UTI factor
The education in the first trimester is divided into four parts illiterate, primary, secondary and university & above; the women illiterate in the first part of pregnancy were 21.5 % of all pregnant women who entered the test. 5% were mild, 11.5% were moderate, and 5% were severe. While those with primary education were 46.2%, 11.2% were mild, 33.7% moderate and 1.3% were severe, and the women with secondary education were 54.5%. Those with mild were 18.8% and 33.6% moderate, while 2.1% were low, while the women with university level of education and above were 15.1%. Those with mild were 2.3% and 11.2% moderate, while 1.6% were low. During the third trimester, 21.5 percent of all pregnant women who entered the test were illiterate women in the early phase of pregnancy. 5% were mild, 11.4% were moderate, and 5.1% were severe. While those who were a primary education were 46.2%, 11% were mild, 33.9% moderate, and 1.3% were severe, and the women are secondary education were 54.5%. Those who have mild were 18.5%, and 34% are moderate while 2% were low, while the women With university level of education & above were 15.1%. Those with mild were 2.1% and 11.5% moderate, while 1.5% were low, as shown in Figure (9).
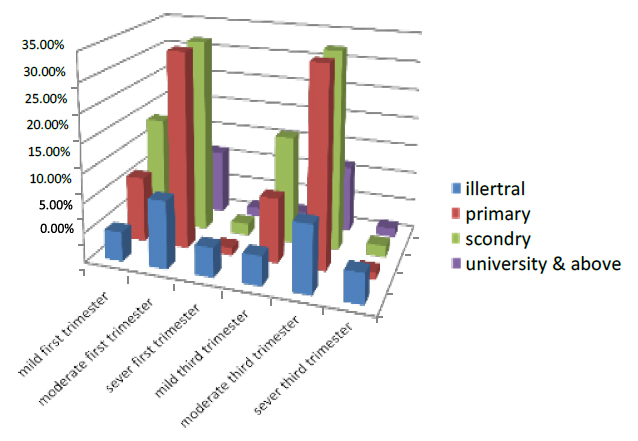
Figure 9. Illustrates the degree of pregnant women's education
The occupation was divided into two employees and a nonemployee; the employer in the first part of pregnancy was 31 % of all pregnant women who entered the test. 11% were mild, 14% were moderate, and 6% were severe. While nonemployees were 69%, 20% were mild, 46% moderate, and 3% severe. In the third trimester of pregnancy, 31.2% were nonemployees, 11.3% were mild, 13.8% moderate, and 6.1% severe. Nonemployee pregnant women were 68.8 %, 19% mild, 46% moderate, and 4% severe. As shown in Figure (10)
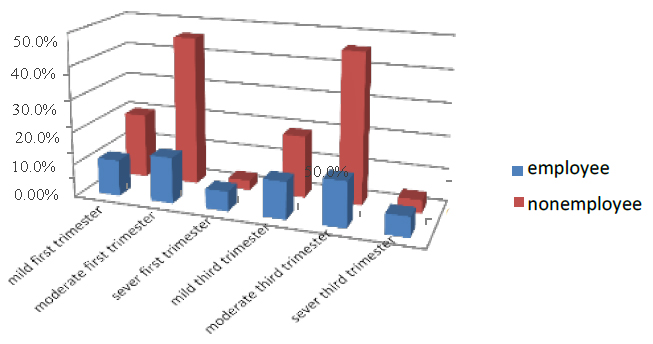
Figure 10. Shows the treatment of pregnant women with sickness factor
They feed on fresh fruit, etc., in the first trimester, divided into three classifications daily, weekly and monthly; the women who had it daily in the first part of pregnancy were 51.5% of all pregnant women who entered the test. 17% were mild, 32% were moderate, and 2.5% were severing. While those eating weekly were 27%, 10% were mild, 11% moderate, and 6% were severe, and the women who ate it monthly were 21.5%. The mild was 6%, and 4% were moderate, while 11.5% were severe.
The women who had fresh food daily in the third part of pregnancy were 51.5% of all pregnant women who entered the test. 17% were mild, 31.8% were moderate, and 2.7% were severe. While those eating weekly were 21.5%, 10% were mild, 10.7% moderate, and 6.3% were severe, and the women who ate it monthly were 21.5% .those who had mild were 5.3%, and 3.6% were moderate, while 12.6% severed. As shown in Figure (11)
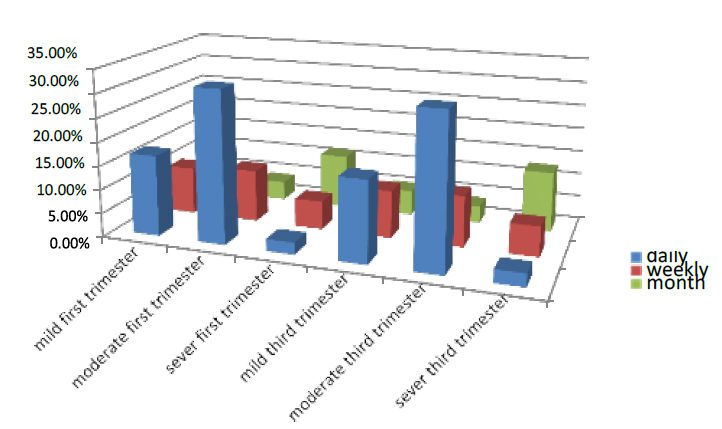
Figure 11. Shows the feed factor of the pregnant women
The number of women drinking tea in the first part of pregnancy was 88.6% of all pregnant women who entered the test. 35.7% were mild, 27.5% were moderate, and 25.4% were severe. While those who did not drink tea were 11.4%, 6.8% were mild, 3.2% moderate, and 1.4% were severed in the third trimester of pregnancy, 57.8 % were drinking, 26.7% were mild, 21% were moderate, and 10.1% severed. While those who did not drink were 42.2 %, 22.7% were mild, 12.6% moderate, and 6.9% were severe. As shown in Figure (12)
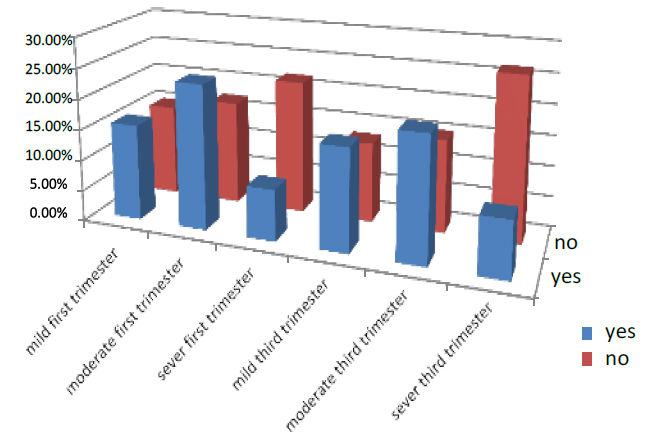
Figure 12. Shows the treatment of pregnant women who are drinking tea.
The marital status of the women pregnant in the first trimester was divided into three classes married, widow and divorced; the women who married in the first part of pregnancy were 90.1% of all pregnant women who entered the test. 11.2% were mild, 65% were moderate, and 13.9% were severe. While those who are widows were 7.9%, 3.8% were mild, 3% moderate, and 1.1% were severe, and the women who are divorced were 2%. The mild was 0%, and 1% was moderate, while 1% was severe.
In the third part of pregnancy, the married women were 89.1% of all pregnant women who entered the test. 11.2% were mild, 64% were moderate, and 14.9% were severing. While those who are widows were 7.9%, 3.6% were mild, 3.2% moderate, and 1.1% were severe, and the women who are divorced were 2%. The mild was 0%, and % were moderate while 2% were severe. As shown in Figure (13)
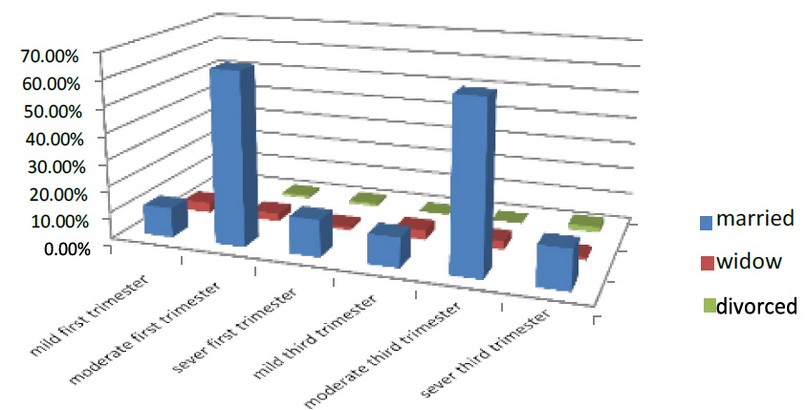
Figure 13. Shows the marital status factor of the pregnant women Factors associated with anemia
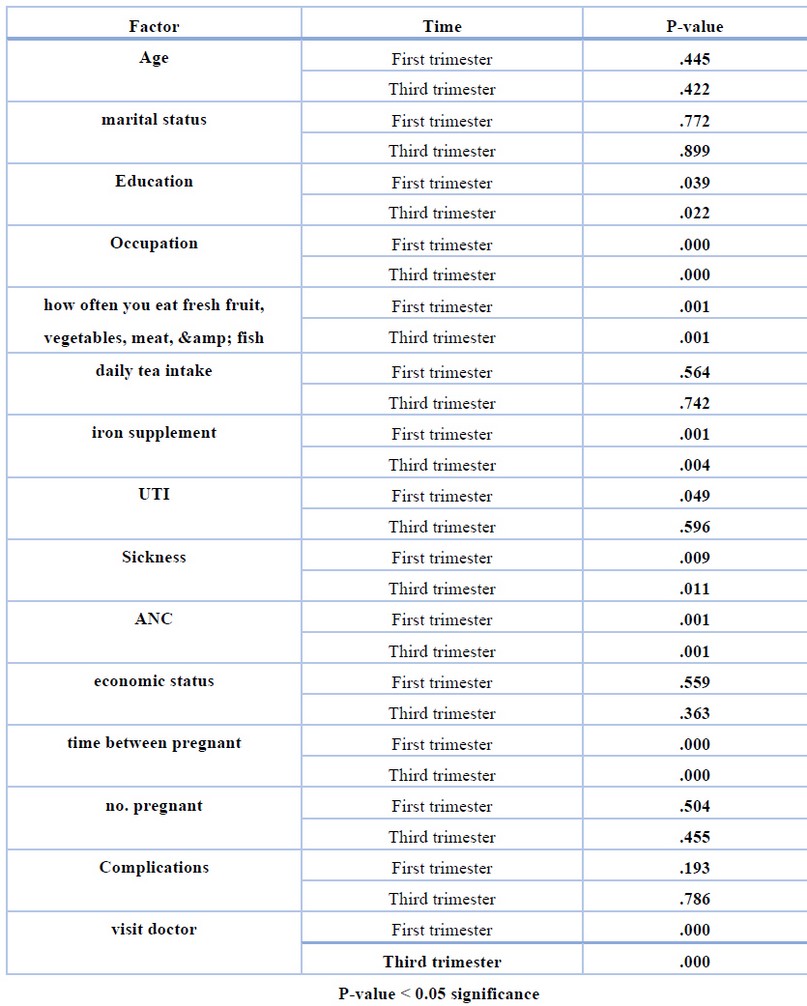
Table 3 . Shows the P-value for all factors of deferent between element factor and first trimester, third trimester
When comparing patients' outcomes with the control group, the effects of the variables were highly close. The most significant effect was on the iron supplementation factor (p<00.5) and the same effect in the control group. The feeding factor had the most excellent effect on the sample where (p<00.5) Health has moderately affected the patient sample and the control group sample. Also, frequent doctor visits and maintaining good health had a positive effect by lowering the incidence of anemia among patients (p<00.5).
DISCUSSION
Anemia was found to be prevalent in 23.2 percent of the research participants. In the first trimester, 57.3 percent of women had mild anemic, 29.3% had moderate anemic, and 13.3% had severe anemic, whereas the total incidence of anemic was 24.5 percent in the third trimester. 58 percent of those had mild anemic, 32 percent had moderate anemic, and ten percent had severe anemic. The prevalence of anemic among pregnant women in this research was classified as a moderate public health concern by the WHO.42 The prevalence found in this research was similar to that seen in previous studies performed across the globe.43 [2] As well as the national prevalence44, which indicated 21% and 22%, respectively. However, it was lower than previous studies conducted in other areas of Iraq that were reported (32.8 percent)45, 36.6 percent46 [as well as (39.9% )47 These disparities in anemic prevalence may be attributable to socioeconomic, cultural, and nutritional variances across areas within the same nation.
Anemia in pregnant women was linked to the household's socioeconomic level. Anemia was more common in women from lower socioeconomic classes than in those from higher socioeconomic classes. Our findings were in line with those of previous research performed in Nigeria and India, which found a greater incidence of anemic among lower socioeconomic groups.48,49 This may be because low-income women cannot afford high-quality meals in sufficient quantities.
The second component in this research that revealed a significant relationship with anemia was gestational age: women in their third trimester were 3.09 and 3.68 times more likely to be anemic than those in their first trimester. According to research performed in various regions of Iraq, women in the third trimester had a higher chance of getting anemic than those in the first trimester.50,51
Similarly, research in India showed that the incidence of anemic was greater in third-trimester pregnant women.52,53. This may be because the need for calories and nutrients rises during pregnancy to support increased maternal metabolism, blood volume, and nutrition delivery to the fetus54, and this demand increases even more in the second and third trimesters of pregnancy. The absorption of Iron decreases dramatically in the first trimester, owing to reduced iron needs and the cessation of menstruation, saving a median of 0.56 mg Fe/day (160 mg/pregnancy)55 However, iron absorption from a diet with high iron bioavailability rises by 1.9 mg/day in the third trimester and up to 5.0 mg/day in the final trimester.56,57
As a result, in the research region, effective intervention packages must decrease anemic among pregnant women via iron supplementation and dietary diversity. The research found that supplementing with Iron had a significant effect on hemoglobin and should be used in conjunction with iron supplementation, particularly in populations with poor iron bioavailability in their diets.58,59
Furthermore, women with a low dietary variety score were 3.18 times more likely than those with a higher dietary diversity score to develop an anemic. This result was in line with earlier research in idea60,61 which found that women with a low dietary variety score and who did not eat iron-rich foods were more likely to develop anemic than their counterparts. Similarly, in Ethiopia, women who followed a stringent dietary pattern were more likely to be anemic than those who did not.62 Fruit intake two or more times per week was similarly linked to a lower incidence of anemic in studies performed in Pakistan and Turkey.63 Furthermore, another research from Ghana found that a high level of maternal dietary variety was linked to a lower incidence of anemic, indicating that nutritional variables are relevant. This may be evidence that an increase in individual dietary variety score is linked to improved nutritional adequacy and that it can be utilized as a proxy indicator for determining nutrient adequacy in pregnant women64,65
Cross-sectional surveys are the most common way to assess the severity of health issues, but they have limitations in showing the time sequence of causes and outcomes. Furthermore, this research did not examine micronutrients such as folic acid, vitamin B12, and vitamin A.
Finally, iron deficiency anemic in pregnant women in the Middle East is a moderate public health issue. This research group linked socioeconomic level, gravidity, trimester, iron supplementation, and dietary variety score were all linked with anemic. The prevalence of an anemic may influence pregnant women's delivery outcomes. Improvements in eating habits, iron supplementation, and family planning promotion conclude a modest public health concern about iron deficiency anemic among pregnant women in the Middle East. The anemic variables in the study population were socioeconomic level, gravity, quarter, iron supplementation, and dietary variety. The frequency of anemic detected may influence the birth rate of pregnant mothers. Improving dietary habits, iron supplements, and family planning promotion, the study will be connected to four primary health care centers in Mosul, two of them on the right side of the river Tigris (Tamooaz and al Nahrwoan) and 2 centers on the left side (al Zahoor and alqramia).
Sample size: the study included 150 cases of pregnant women in the 3rd trimester diagnosed with anemia according to hemoglobin level and 150 control women in the 3rd trimester without anemia.
CONCLUSIONS
The blood consists of Hemoglobin (Heam + globin) Heam: Iron protoporphyrin ring Globin: it is the type of protein with a specific length of amino acid and specific type of A is maybe 2 Alpha 2 Beta called A1 or 2 Alpha and 2Bata called A2 or 2Alpha and Gamma called F Fetal.
In this study, we focused on different factors associated with the amount of blood and how these factors affected anemia; the most important is Iron treatment, but we have to remember the other factor such as food, diversity, Economic situation, Social status, number of fetus and number of pregnancies.
Statistical analysis was used to detect the affecting factors of anemia in pregnant women; this study refers to 23.2% of anemia because of Iron deficiency. So, the study proved a relation and effect between Iron deficiency and anemia in pregnancy.
Author Contributions: I've been working on my own.
Funding: There is no funding from any party. The work was done at the researcher's expense.
Ethical considerations: verbal consent should be taken from each patient before data collection for ethical concerns.
Data Availability Statement: University of Mosul / College of Environmental sciences and technologies.
Acknowledgments: The researcher thanks to the University of Mosul / College of Environmental Sciences and Technologies for providing laboratories for the work.
Conflicts of Interest: There is no conflict of interest in the research.
REFERENCES
1. Belachew, T., & Legesse, Y. (2006). Risk factors for anemia among pregnant women attending antenatal clinic at Jimma University Hospital, southwest Ethiopia. Ethiopian Medical Journal, 44(3),211-220.
2. Pasricha, S. R., Black, J., Muthayya, S., Shet, A., Bhat, V., Nagaraj, S., ... & Shet,A. S. (2010). Determinants of anemia among young children in rural India. Pediatrics, 126(1),e140-e149.
3. Addis Alene, K., & Mohamed Dohe, A. (2014). Prevalence of anemia and associated factors among pregnant women in an urban area of eastern Ethiopia. Anemia,2014.
4. Basu, S., Basu, S., Hazarika, R., & Parmar, V. (2005). Prevalence of anemia among school going adolescents of Chandigarh. Indian pediatrics, 42(6),593.
5. Abriha, A., Yesuf, M. E., & Wassie, M. M. (2014). Prevalence and associated factors of anemia among pregnant women of Mekelle town: a cross sectional study. BMC research notes, 7(1),888
6. Gautam, V. P., Bansal, Y., Taneja, D. K., & Saha, R. (2002). Prevalence of anemia amongst pregnant women and its sociodemographic associates in a rural area of Delhi. Indian J Community Med, 27(4),10-2002.
7. Abdelrahman, E. G., Gasim, G. I., Musa, I. R., Elbashir, L. M., & Adam, I. (2012). Red blood cell distribution width and iron deficiency anemia among pregnant Sudanese women. Diagnostic pathology, 7(1), 168.
8. Rasheed, P., Koura, M. R., Al-Dabal, B. K., & Makki, S. M. (2008). Anemia in pregnancy: a study among attendees of primary health care centers. Annals of S.
9. Powars, D. R., Sandhu, M. E. E. N. U., Niland-Weiss, J. O. Y. C. E., Johnson, C.G. E., Bruce, S. A. M. U. E. L., & Manning, P. R. (1986). Pregnancy in sickle cell disease. Obstetrics and gynecology, 67(2), 217-228.
10. Xiong, X., Buekens, P., Alexander, S., Demianczuk, N., & Wollast, E. (2000). Anemia during pregnancy and birth outcome: a meta-analysis. American journal of perinatology, 17(03), 137-146.
11. Ouma, P., Van Eijk, A. M., Hamel, M. J., Parise, M., Ayisi, J. G., Otieno, K., ... & Slutsker, L. (2007). Malaria and anaemia among pregnant women at first antenatal clinic visit in Kisumu, western Kenya. Tropical Medicine & International Health, 12(12),1515-1523.
12. Gedefaw, L., Ayele, A., Asres, Y., & Mossie, A. (2015). Anaemia and associated factors among pregnant women attending antenatal care clinic in Walayita Sodo town, Southern Ethiopia. Ethiopian journal of health sciences, 25(2), 155-164.
13. Bechir, M., Schelling, E., Hamit, M. A., Tanner, M., & Zinsstag, J. (2012). Parasitic infections, anemia and malnutrition among rural settled and mobile pastoralist mothers and their children in Chad. Ecohealth, 9(2), 122-131.
14. Chaudhary, S. M., & Dhage, V. R. (2008). A study of anemia among adolescent females in the urban area of Nagpur. Indian journal of community medicine: official publication of Indian Association of Preventive & Social Medicine, 33(4), 243.
15. Allen, L. H. (2000). Anemia and iron deficiency: effects on pregnancy outcome. The American journal of clinical nutrition, 71(5),1280S-1284S.
16. Dalenius, K., Brindley, P. L., Smith, B. L., Reinold, C. M., & Grummer-Strawn,L. (2012). Pregnancy nutrition surveillance: 2010 report.
17. Tichelli, A., Socié, G., Marsh, J., Barge, R., Frickhofen, N., McCann, S., ... & Symeonidis, A. (2002). Outcome of pregnancy and disease course among women with aplastic anemia treated with immunosuppression. Annals of internal medicine, 137(3),164-172.
18. Sharma, P., Mehta, S., & Nagar, R. (2013). Prevalence of anemia and socio- demographic factors associated with anemia among pregnant women attending antenatal Hospital in Jaipur City, India. Age (Omaha), 20,20-5.
19. Sharma, P., Mehta, S., & Nagar, R. (2013). Prevalence of anemia and socio- demographic factors associated with anemia among pregnant women attending antenatal Hospital in Jaipur City, India. Age (Omaha), 20,20-5.
20. Brabin, B. (1997). Malaria in pregnancy: current issues. Africa Health, 19(2), 19- 20.
21. Ugwu, E. O., Olibe, A. O., Obi, S. N., & Ugwu, A. O. (2014). Determinants of compliance to iron supplementation among pregnant women in Enugu, Southeastern Nigeria. Nigerian journal of clinical practice, 17(5), 608-612
22. Bondevik, G. T., Ulstein, M., Lie, R. T., Rana, G., & Kvåle, G. (2000). The prevalence of anemia in pregnant Nepali women-a study in Kathmandu. Acta Obstetricia et Gynecologica Scandinavica, 79(5), 341-349.
23. Bekele, A., Tilahun, M., & Mekuria, A. (2016). Prevalence of anemia and its associated factors among pregnant women attending antenatal care in health institutions of Arba Minch town, Gamo Gofa Zone, Ethiopia: A Cross-sectional study. Anemia,2016.
24. Shali, T., Singh, C., & Goindi, G. (2004). Prevalence of anemia amongst pregnant mothers and children in Delhi. Indian journal of pediatrics, 71(10), 946-946.
25. Meier, P. R., Nickerson, H. J., Olson, K. A., Berg, R. L., & Meyer, J. A. (2003). Prevention of iron deficiency anemia in adolescent and adult pregnancies. Clinical medicine & research, 1(1), 29-36.
26. Woldie, H., Kebede, Y., & Tariku, A. (2015). Factors associated with anemia among children aged 6–23 months attending growth monitoring at Tsitsika Health Center, Wag-Himra Zone, Northeast Ethiopia. Journal of nutrition and metabolism,2015.
27. Nybo, M., Friis-Hansen, L., Felding, P., & Milman, N. (2007). Higher prevalence of anemia among pregnant immigrant women compared to pregnant ethnic Danish women. Annals of hematology, 86(9), 647-651.
28. Roba, K. T., O'Connor, T. P., Belachew, T., & O'Brien, N. M. (2015). Seasonal variation in nutritional status and anemia among lactating mothers in two agro- ecological zones of rural Ethiopia: A longitudinal study. Nutrition, 31(10), 1213- 1218.
29. Ayoya, M. A., Ngnie-Teta, I., Séraphin, M. N., Mamadoultaibou, A., Boldon, E., Saint-Fleur, J. E., ... & Bernard, S. (2013). Prevalence and risk factors of anemia among children 6–59 months old in Haiti. Anemia, 2013.
30. Allen, L. H. (1997). Pregnancy and iron deficiency: unresolved issues. Nutrition reviews, 55(4), 91-101.
31. Eisenstein, M. I., Posner, A. C., & Friedman, S. (1956). Sickle-cell anemia in pregnancy: A review of the literature with additional case histories. American Journal of Obstetrics & Gynecology, 72(3), 622-634.
32. Haidar, J. A., & Pobocik, R. S. (2009). Iron deficiency anemia is not a rare problem among women of reproductive ages in Ethiopia: a community based cross sectional study. BMC Hematology, 9(1), 7.
33. Ghimire, N., & Pandey, N. (2013). Knowledge and practice of mothers regarding the prevention of anemia during pregnancy, in teaching hospital, Kathmandu. Journal of Chitwan Medical College, 3(3), 14-17.
34. Allen, L. H. (2005). Multiple micronutrients in pregnancy and lactation: an overview. The American journal of clinical nutrition, 81(5), 1206S-1212S.
35. Lelic, M., Bogdanovic, G., Ramic, S., & Brkicevic, E. (2014). Influence of maternal anemia during pregnancy on placenta and newborns. Medical Archives, 68(3),184.
36. Chilongozi, D., Wang, L., Brown, L., Taha, T., Valentine, M., Emel, L., ... & Brown, E. R. (2008). Morbidity and mortality among a cohort of human immunodeficiency virus type 1-infected and uninfected pregnant women and their infants from Malawi, Zambia, and Tanzania. The Pediatric infectious disease journal, 27(9),808.
37. Chopra, J. G., Noe, E., Matthew, J., Dhein, C., Rose, J., Cooperman, J. M., & Luhby, A. L. (1967). Anemia in pregnancy. American Journal of Public Health and the Nations Health, 57(5), 857-868.
38. Friedman, J. F., Kurtis, J. D., Kabyemela, E. R., Fried, M., & Duffy, P. E. (2009). The iron trap: iron, malaria and anemia at the mother–child interface. Microbes and Infection, 11(4), 460-466.
39. Gebremedhin, S., & Enquselassie, F. (2011). Correlates of anemia among women of reproductive age in Ethiopia: evidence from Ethiopian DHS 2005. Ethiopian Journal of Health Development, 25(1), 22-30.
40. Agbozo, F., Abubakari, A., Der, J., & Jahn, A. (2020). Maternal dietary intakes, red blood cell indices and risk for anemia in the first, second and third trimesters of pregnancy and at predelivery. Nutrients, 12(3), 777.
41. Gangopadhyay, R., Karoshi, M., & Keith, L. (2011). Anemia and pregnancy: a link to maternal chronic diseases. International Journal of Gynecology & Obstetrics, 115, S11-S15.
42. Charles, A. M., Campbell-Stennett, D., Yatich, N., & Jolly, P. E. (2010). Predictors of anemia among pregnant women in Westmoreland, Jamaica. Health care for women international, 31(7),585-598.
43. Cogswell, M. E., Parvanta, I., Ickes, L., Yip, R., & Brittenham, G. M. (2003). Iron supplementation during pregnancy, anemia, and birth weight: a randomized controlled trial. The American journal of clinical nutrition, 78(4), 773-781.
44. Bergmann, R. L., Richter, R., Bergmann, K. E., & Dudenhausen, J. W. (2010). Prevalence and risk factors for early postpartum anemia. European Journal of Obstetrics & Gynecology and Reproductive Biology, 150(2), 126-131.
45. Abu-Ouf, N. M., & Jan, M. M. (2015). The impact of maternal iron deficiency and iron deficiency anemia on child’s health. Saudi medical journal, 36(2), 146.
46. Chandyo, R. K., Henjum, S., Ulak, M., Thorne-Lyman, A. L., Ulvik, R. J., Shrestha, P. S., ... & Strand, T. A. (2016). The prevalence of anemia and iron deficiency is more common in breastfed infants than their mothers in Bhaktapur, Nepal. European journal of clinical nutrition, 70(4), 456.
47. Schantz-Dunn, J., & Nour, N. M. (2009). Malaria and pregnancy: a global health perspective. Reviews in obstetrics and gynecology, 2(3), 186.
48. Ezegwui, H. U., Ikeako, L. C., & Ogbuefi, F. (2012). Obstetric outcome of teenage pregnancies at a tertiary hospital in Enugu, Nigeria. Nigerian journal of clinical practice, 15(2),147-150.
49. Telatar, B., Comert, S., Vitrinel, A., Erginoz, E., & Akin, Y. (2009). The effect of maternal anemia on anthropometric measurements of newborns. Saudi medical journal, 30(3), 409-412.
50. Scholl, T. O., & Reilly, T. (2000). Anemia, iron and pregnancy outcome. The Journal of nutrition, 130(2), 443S-447S.
51. Agarwal, T., Kochar, G. K., & Goel, S. (2008). Impact of iron supplementation on anemia during pregnancy. Studies on Ethno-Medicine, 2(2), 149-151.
52. Anand, T., Rahi, M., Sharma, P., & Ingle, G. K. (2014). Issues in prevention of iron deficiency anemia in India. Nutrition, 30(7-8), 764-770.
53. Samimi, M., Asemi, Z., Taghizadeh, M., Azarbad, Z., Rahimi-Foroushani, A., & Sarahroodi, S. (2012). Concentrations of serum zinc, hemoglobin and ferritin among pregnant women and their effects on birth outcomes in Kashan, Iran. Oman medical journal, 27(1), 40.
54. Girma, S., Teshome, T., Worku, M., Solomon, T., Kehulu, S., Aman, R., ... & Gezahegn, H. (2020). Anemia and Associated Factors Among Pregnant Women Attending Antenatal Care at Madda Walabu University Goba Referral Hospital, Bale Zone, Southeast Ethiopia. Journal of Blood Medicine, 11, 479.
55. Siegel, E. H., Stoltzfus, R. J., Khatry, S. K., Leclerq, S. C., Katz, J., & Tielsch, J. M. (2006). Epidemiology of anemia among 4-to 17-month-old children living in south central Nepal. European journal of clinical nutrition, 60(2), 228.
56. Lelissa, D., Yilma, M., Shewalem, W., Abraha, A., Worku, M., Ambachew, H., & Birhaneselassie, M. (2015). Prevalence of Anemia among women receiving antenatal Care at Boditii Health Center, southern Ethiopia. Age, 15(19), 25.
57. El‐Farrash, R. A., Ismail, E. A. R., & Nada, A. S. (2012). Cord blood iron profile and breast milk micronutrients in maternal iron deficiency anemia. Pediatric Blood & Cancer, 58(2), 233-238.
58. Milman, N., Agger, A. O., & Nielsen, O. J. (1994). Iron status markers and serum erythropoietin in 120 mothers and newborn infants: effect of iron supplementation in normal pregnancy. Acta obstetricia et gynecologica Scandinavica, 73(3), 200-204.
59. McCurdy, P. R. (1964). Abnormal hemoglobins and pregnancy. American Journal of Obstetrics & Gynecology, 90(7), 891-896.
60. Jarrah, S. S., Halabi, J. O., Bond, A. E., & Abegglen, J. (2007). Iron deficiency anemia (IDA) perceptions and dietary iron intake among young women and pregnant women in Jordan. Journal of Transcultural Nursing, 18(1), 19-27.
61. Umeta, M., Haidar, J., Demissie, T., Akalu, G., & Ayana, G. (2008). Iron deficiency anemia among women of reproductive age in nine administrative regions of Ethiopia. Ethiop J Health Dev, 22(3),252-8.
62. Vemulapalli, B., & Rao, K. K. (2014). Prevalence of anaemia among pregnant women of rural community in Vizianagaram, North Coastal Andhra Pradesh, India. Asian Journal of Medical Sciences, 5(2), 21-25.
63. Reinold, C. M., Dalenius, K., Brindley, P. L., Smith, B. L., & Grummer-Strawn, L. (2011). Pregnancy nutrition surveillance: 2009 report.
64. Bora, R., Sable, C., Wolfson, J., Boro, K., & Rao, R. (2014). Prevalence of anemia in pregnant women and its effect on neonatal outcomes in Northeast India. The Journal of Maternal-Fetal & Neonatal Medicine, 27(9),887-891.
65. Laar, A. K., Grant, F. E., Addo, Y., Soyiri, I., Nkansah, B., Abugri, J., ... & Quakyi, I. A. (2013). Predictors of fetal anemia and cord blood malaria parasitemia among newborns of HIV-positive mothers. BMC research notes, 6(1), 350.
Received: 17 January 2022 / Accepted: 29 March 2022 / Published:15 May 2022
Citation. Nathem Rashed R. Effect Biological Life Factors on Pregnant Woman. Revis Bionatura 2022;7(2) 47. http://dx.doi.org/10.21931/RB/2022.07.02.47