2018.03.01.3
Files > Volume 3 > Vol 3 No 1 2018
INVESTIGATION / RESEARCH
Solar erythemal irradiance in Ibarra, Ecuador (high altitude equatorial city). Ground and satellite measurements and model calculations
Irradiancia solar eritémica en Ibarra, Ecuador (ciudad ecuatorial de gran altitud). Mediciones terrestres y satelitales y cálculos con modelos

José M Huaca P1*, Graciela M. Salum2, Rubén D. Piacentini3,4
Available from: http://dx.doi.org/10.21931/RB/2018.03.01.3
ABSTRACT
The knowledge of the UV Index values, as an indicator of solar risk, allows us to adopt appropriate protection measures. This research analyzes the erythemal irradiance (directly linked with the UV Index) from July to September 2017 measured in Ibarra, Ecuador with a UV radiometer. We found that 72 days hold UVI values higher than 11 over 82 measured days, i.e. there are stages in 87.8% of the days when the UVI overcome the “extreme” value (according the WMO and WHO classification). Also, 14 days show UVI values over 20 (extremely high). Such classification doesn’t seem quite adequate for this particular region. This region has important characteristics that increase the UVI: high altitude (2225 m a.s.l.), low atmospheric ozone values (248.8±12.2 DU measured from 2005 to 2016 by OMI/NASA satellite), and great cloudiness percentage (with an annual average value of 78.5%) of “cumulus” type. This study demonstrated the need for skin protection for individuals who perform outdoor activities in Ibarra, a place considered “high risk” for skin damage progression due to its high altitude and closeness to the equator, even under cloudy skies.
Keywords: Solar risk, UV Index, clouds, Ibarra, Ecuador
RESUMEN
El conocimiento de los valores del Índice UV, como indicador de riesgo solar, nos permite adoptar medidas de protección apropiadas. Esta investigación analiza la irradiancia eritémica (directamente vinculada con el Índice UV) desde Julio hasta Septiembre de 2017 medida en Ibarra, Ecuador con un radiómetro UV. Encontramos que 72 días tienen valores de IUV más altos que 11 sobre 82 días medidos, es decir que 87.8% de los días tienen fases donde el IUV sobrepasa el valor “extremo” (de acuerdo a la clasificación de la OMM y la OMS). También, 14 días tienen valores de IUV por sobre 20 (extremamente alto). Esta clasificación no parece ser muy adecuada para esta región particular. Esta región tiene importantes características que incrementan el IUV: gran altitud (2225 m s.n.m.), bajos valores de ozono atmosférico (248.8±12.2 UD medido en el periodo 2005-2016 por el satélite OMI/NASA), y gran porcentaje de nubosidad (con valor promedio anual de 78.5%) de nubes de tipo “cúmulos”. Este trabajo demostró la necesidad de protección de la piel para personas que desarrollan actividades externas en Ibarra, que es un sitio considerado de “alto riesgo” para la progresión de daño en la piel, debido a su gran altitud y cercanía de la línea ecuatorial, aún bajo días nublados.
Palabras claves: Riesgo solar, Indice UV, nubes, Ibarra, Ecuador
INTRODUCTION
The Sun, located 150 million kilometers from Earth, emits electromagnetic radiation whose spectrum covers several wavelengths, ranging from microwaves to gamma rays. Fortunately, life is possible as we know it, since the terrestrial atmosphere filters most of these radiations, preventing any powerful solar ultraviolet radiation (UVR) from reaching the terrestrial surface level, as well as X and gamma radiations.
UVR is usually subdivided into three bands: UVA (400–315 nm), UVB (315–280 nm) and UVC (280–100 nm). UVR at wavelengths shorter than 320 nm is more photo-biologically active than UVR at longer wavelengths1. Accordingly, radiation from 250 nm is biologically active to cause erythema (a skin condition characterized by redness) in the skin. Therefore, UVA penetrates the human skin more deeply than UVB resulting in greater risk for initiation of the carcinogenic process in skin2.
Stratospheric ozone is the main absorber in the atmosphere which determines the amount of UVR that reaches the ground. Ozone production and destruction require solar radiation with wavelengths shorter than 240 nm (which is mainly UVC radiation) 3. Total column ozone is measured with ground and satellite-based instruments. A typical ozone value in the mid-latitudes is found in the region of 300 Dobson Unit (DU) 4, where 1 DU = 2.69x10¹⁶ mol O3/cm2. In the absence of all other factors, less ozone in the atmosphere allows for more solar UVB radiation to reach the ground, and vice versa. Among the myriads of elements that enables life on Earth, a crucial one is the impact the ozone layer plays on the decrease of this solar radiation5.
It’s estimated that followed by stratospheric ozone, the percentage of cloudiness is the second most effective filter limiting the amount of solar UVR that reaches the Earth’s surface. However, cloud cover can either attenuate or enhance the amount of solar UVR reaching the ground. Whether attenuation or enhancement occurs is determined by factors such as cloud location (which refers to cloud height and determining if the cloud is covering the solar disc). Other factors include optical thickness and liquid water content6. According to Juzeniene et al. 7, people burn less on a cloud-covered day or in winter. However, a distinctive situation occurs when the clouds are of cumulus-type close to (but not covering) the Sun: An enhancement follows and the terrestrial values of solar UV radiation overcomes the extraterrestrial (outside of Earth’s atmosphere) UV radiation7. In particular, several investigations have found extreme values of solar terrestrial radiation in different places: Puna de Atacama, Argentina1; Ecuador2; Recife, Brazil3; San Pablo, Brazil6; Maceió, Brazil8. Salum et al. 4 analyzed the change of energy in one peak of enhanced total solar irradiance due to clouds.
Solar UV Index (UVI) is the time-dependent wavelength-weighted average effective UV irradiance in W/m2multiplied by 40 [m2/W]. The World Health Organization (WHO) and the World Meteorological Organization (WMO) made a classification of the UVI9 (see Table 1). This classification has been the subject of critical analysis because the UVI in many parts of South America, and countries close to latitude 0° and high altitude, have values above 1110.

Table 1. UVI (ultraviolet index) proposed by WHO and WMO9.
MED (or minimal erythemal dose) is the dose of UVR required to produce a barely perceptible erythema11. The effective UV spectrum is the mathematical product of the solar UV spectrum and the erythemal response spectrum. The effective UV intensity is the integral of the UV spectrum over the wavelength, and usually is measured in (MED/h) or UVI7. The action response spectrum is the relative response of each wavelength for causing some biological effect. Figure 1 shows the action response spectrum of erythemal action spectrum12 and SCUP (Skin Cancer Utrecht-Philadelphia) action spectrum13. The SCUP spectrum is used as a model of UV carcinogenesis of the skin. Figure 1 shows that the biggest response, for both effects, is in the UVB range. In these cases the UV Index is a good indicator for the skin cancer risk, too.

Figure 1. Action spectrum of erythema12 and Skin Cancer Utrecht-Philadelphia (SCUP) action spectrum13.
The MED values depend largely on the phototype of the skin. The skin classification (see Table 2) of Fitzpatrick is based on the color and the responses to sun exposure in terms of tanning and burning degrees14.
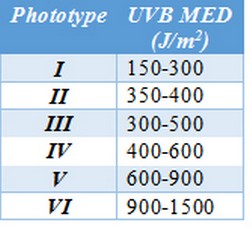
Table 2. Fitzpatrick’s skin phototypes14.
In the Bolivian Andes, at around 4000 m altitude, the UVI is the highest in the world, showing UVI above 16, and commonly reaching UVI values above 20. Measurements have been made in the desert of Arica in Chile, where it was observed that the increase in percentage of UV irradiance per 1000 m of altitude above sea level are 5.1% in summer and 5.8% in winter15.
In a recent publication, Holick16 emphasized the importance of the biological effects of sunlight on health, linking the exposure to UVB radiation to brain activity, and a balance in the sun exposure needed to synthetize vitamin D and the sun exposure to produce sun burning.
METHODS
In this research we used a calibrated ultraviolet radiometer Erythemal-type, Kipp&Zonen. Once the data (in millivolts) were stored, they were converted to irradiance data (in watts per square meter).This radiometer (called biometer) was installed along with a data logger in Ibarra, Ecuador, (0.36° N, 78.1° W, 2225 m a.s.l.), registering solar erythemal UV radiation each minute.
The data acquisition began in June 2017 and in this study data is presented for a period of three months: July, August and September. In order to determine the UV Index in Ibarra, we analyzed the data for (a few days of) clear sky days and some clouded days. Then, we compared days with clear skies and days with cloudy skies. We also considered the erythemal irradiances obtained from a satellite data base in order to compare the terrestrial and the satellite data. The UV Index information was obtained from measurements done by the OMI/KMNI instrument on board of the Aura/NASA satellite17.
In particular, we were looking for the days with higher UVI per month. For each selected day, we calculated the daily evolution of the UVI in clear sky situation with the TUV model18. This algorithm models the erythemal solar irradiance and UVI (among other variables) as a time function for certain input parameters. The most important parameters are: date, latitude and longitude, altitude, aerosol content (any solid or liquid particle suspended in the atmosphere), ozone content and albedo. The model consists of a set of parametric equations. These can calculate solar irradiance when applied to different layers of the atmosphere.
Afterwards, the values of the modeled irradiance (for clear sky) are compared with the actual value to determine impact of the clouds. Another comparison provides the surplus of energy caused by the increase in solar irradiance due to clouds.
RESULTS
i- UV Index analysis
Once (the data was) converted to irradiance, we convert the irradiance data to UVI. In a first analysis, we identified the clear sky days (25% or less of cloudiness) for each month. We detected three days for July: 15th, 16th and 21st, which we averaged to obtain a representative or “typical” clear sky day for that particular month. Figure 2 (top) shows the monthly measured evolution of the UVI data (gray line) and the representative clear sky day data for July 2017(blue line).
It turned out that most days showed data above the representative day. This implies that the clouds do not always have an attenuating effect on solar radiation, but can also increase it. Figure 2 shows the oscillations of the UVI due to cloudiness.


Figure 2. Measured UVI values (black line) as function of time for July (top), August (center) and September (bottom) 2017, at Ibarra, Ecuador. Averaged UVI values (blue line) determined with the TUV model18considering monthly mean conditions clear sky days for each month, are also included. In red and orange lines are indicated the lower limits of “extreme” and “very high” UV Index classification.
In Figure 2, we also displayed the data for August (center) and September (bottom) 2017. In the same Figure, we included two lines that show a “very high” UV Index (orange line) or an “extreme” UV Index (red line), according to the WMO/WHO classification. In 82 measured days there were 72 days with UVI values higher than 11 which is considered for WMO and WHO “extreme UVI” (see Table 1). This means that 87.8% of the days have moments when the UVI exceeds the “extreme” value. Furthermore 14 days have UVI values over 20 (extremely high), corresponding to 17.1 % of the observed days. This classification doesn’t seem optimal for this particular region (with mean population having a skin phototype of III and IV on the Fitzpatrick scale), as was recently proposed by Zaratti et al.1
Another source for the UV Index is the database from measurements done by the OMI/KMNI instrument on board of the Aura/NASA satellite17. We analyzed these data for Ibarra, Ecuador, from January 1, 2010, to December 31, 2016, see Figure 3. The mean value of the UV Index for the whole period is (11.0±2.0), a value which is in the “extreme” range, showing the significance of the erythemal irradiance at this high altitude near the equator.

Figure 3. UV Index from January 1st, 2010 to December 31st, 2016, measured by the OMI/KNMI instrument on board of Aura/NASA satellite17. The blue horizontal line corresponds to the mean value in the analyzed period 11.0±2.0.
ii- Cloud effect
One possible explanation for the high UV index values is the presence of clouds (cumulus type) that enhance the solar radiation owing to two combined effects: concentration of this radiation due to the cloud edges and multiple scattering because of dispersion in the cloud plane1. According to the SSE/NASA satellite data base19, Ibarra has an average monthly cloudiness of 70.9% in July, 72.7% in August and 80.5% in September, with an annual average value of 78.5%. Therefore the authors think that it is likely that this effect occurs in Ibarra. This enhancement is important for various forms of sun protection. The attenuation effect of solar radiation can be seen, for example, at 12:18 on September 9th when cloudiness caused a rapid fall in the UV Index from 17.1 (clear sky conditions) to a value of 5. This is equivalent to a decrease of 71.2% of the UVI.
iii- Modeling of erythemal irradiance
During the three months of measurements, the days with highest UVI values for each month were: July 28, August 27 and September 3. These days are shown in Figure 4. The modeled UVI is in blue. This modelling was performed with the TUV model, as the UV Index was limited to the possibility of a clear sky day situation (taking in consideration the descending slope of the curve).


Figure 4. The days with the highest values of UV Index for each month (July, August and September of 2017), measured at Ibarra, Ecuador. The blue curve was calculated with TUV model18 considering clear sky conditions.In red, orange and yellow lines are indicated the lower limits of “extreme”, “very high” and “high” UV Index classification.
Analyzing September 3 data, for a clear sky situation, the UV Index turns out higher than 5 (lower limit of “high UVI”) from 8:35 am to 3:48 pm (7.22 hours), higher than 7 (lower limit of “very high UVI”) from 9 am to 3:24 pm (6.4 hours) and higher than 11 (lower limits of “extreme UVI”) from 9:44 am to 2:39 pm (4.9 hours). This illustrates that the WMO/WHO classification is not valid for Ibarra. This is of interest, not only to the inhabitants of the region who have a phototype III or IV, but also to Caucasians or fair skinned people because skin cancer risk is higher than for phototype II and I14. Figure 4 shows the lower limits for “high”, “very high” and “extreme” UV Index classification, according to WMO/WHO for the three days per month with higher UV Index.
In the case of September 3, the modelling clear sky situation was compared to the measured (real) condition between 12:46 pm and 1 pm (local hours = UT -5 hours). This interval is of interest since there is a peak due to the cloud condition. The measured value has a maximum UVI equal to 22.1 at 12:16 and the modeled value of 19.4 for the same time. This is an increase of 14.2%, with respect to clear sky conditions. This value (UV Index = 22.1) was the highest value in the analyzed months.
iv- Energy analysis
In order to determine the change of energy caused by this increase in solar irradiance due to clouds, we need to calculate the irradiation, -that corresponds to the integration (continuous sum) of irradiance, also called insolation. Before that step we must calculate the erythemal irradiance, which is the UV Index divided by 40 [m2/W].
For September 3, we integrated the erythemal irradiance between 12:46 pm and 1 pm. The results are: ETUV = 389.9[J/m2] and Ereal = 400.3[J/m2], or a difference of 2.7%.
Now, a healthy solar exposure time to UV radiation can be obtained by the MED value for a given phototype, according to the Fitzpatrick classification. Considering that for a phototype III the mean MED is equal to 400 J (see Table 2), in both cases (modelling and measuring), a person of skin type III should be exposed to the Sun for less than 16 minutes around noon.
v- Ozone analysis
Among the parameters that have a particular effect on the UVI (or the UV erythemal solar irradiance) on a clear sky day, in addition to the geographic location, the atmospheric ozone content is of large significance20.
In order to identify the atmospheric situation of Ibarra, we obtained the ozone total column from the OMI/Aura NASA satellite data base. The downloaded data are: (259±10) [DU]; (261±8) [DU] and (265±12) [DU] for July 28, August 27 and September 3, respectively. The values for the total ozone column are rather low with respect to the mean global value of around 300 UD, with an average value of (248.8 ± 12.2) DU, representing the mean of 12 years of data (from 2005 to 2016).
DISCUSSION
This thorough analysis demonstrated the need for skin protection for people who predominantly perform activities outdoors in Ibarra, at high altitude, near the equator in Ecuador, even under cloudy skies. This conclusion is based on the fact that a maximum UV Index value, higher than 22 (0.55 W/m2), was recorded on September 3 at 12:16 local time (= Universal time - 5 hours). This is significant, since sunburned skin is the inflammatory acute effect of UV radiation. If the UV dose is higher than the threshold damage response, keratinocytes triggers apoptosis and die. In particular, UVB (directly related to the UV Index) stimulates the formation of DNA photo-lesions14.
From the 82 day measured, 72 days (corresponding to 87.8%) had UVI values higher than 11. These are considered by WMO and WHO standards to be “extreme UVI, and 14 days have UVI values over 20 (extremely high), which corresponds to 17.1 %. These extreme values confirm the influence of clouds reinforcing ultraviolet radiation in particular situations, especially the clear sky situation for September 3 when the UV Index is higher than 11 (lower limits of “extreme UVI”) from 9:44 am to 2:39 pm, i.e. almost 5 hours of the day.
On the other hand, clouds can have a positive impact on the solar erythemal irradiance, in some instances significantly reducing the solar radiation, e.g. on September 9 at 12:18 there was a sharp fall of the UV Index from 17.1 (clear sky conditions) to a value of 5 ( a decrease of 71.2% of the UVI).
Special care must be taken by those of skin phototype mostly equal or lower than III when exposed to the Sun at high altitude sites near the Equator, such as Ibarra in Ecuador and nearby regions.
ACKNOWLEDGEMENTS
This work has been developed with the measurement equipment and facilities of the Universidad Técnica del Norte and the PIP CONICET N° 0405 project. The authors acknowledge the scientific team responsible for the operation and maintenance of the Surface Meteorology and Solar Energy (SSE)/NASA and the OMI/Aura NASA databases. They also acknowledge the support of the students Lizbeth Quiroz Cabascango, Tamia Yánez Tamba and Jose Pinango Nuñez. A special thanks to Elisabeth Griewank for her continued support.
REFERENCES
1. Piacentini RD, Cede A, Bárcena H. Extreme solar total and UV irradiances due to cloud effect measured near the summer solstice at the high-altitude desertic plateau Puna of Atacama (Argentina). Journal of Atmospheric and Solar-Terrestrial Physics 2003; 65:727–731. DOI: 10.1016/S1364-6826(03)00084-1.
2. Emck P, Richter M. An Upper Threshold of Enhanced Global Shortwave Irradiance in the Troposphere derived from Field Measurements in Tropical Mountains. Journal of Applied Meteorology and Climatology. 2008; 47: 2828-2845. DOI: 10.1175/2008JAMC1861.1.
3. Piacentini RD, Salum GM, Fraidenraich N, Tiba C. Extreme total solar irradiance due to cloud enhancement at sea level of the NE Atlantic coast of Brazil. Renewable Energy 2011; 36:409-412.DOI: 10.1016/j.renene.2010.06.009.
4. Salum GM, Tiba C, Fraidenraich N, Piacentini RD: Valores extremos de radiación solar total producidos por efecto de nubes, en Recife, Brasil. Avances en Energías Renovables y Medio Ambiente (AVERMA) 2010; 14:11.07-11.10.
5. Cañarte C, Salum GM, Ipiña A y Piacentini RD.Indice ultravioleta como indicador de riesgo en la piel. 2010. Chapter 87 in Dermatología Ibero-Americana-Online. URL: http://antoniorondonlugo.com/blog/wp-content/uploads/2010/05/87-Indice-ultravioleta-como-indicador-de-riesgo-en-la-piel.pdf
6. Almeida MP, Zilles R, Lorenzo E. Extreme overirradiance events in São Paulo, Brazil. Solar Energy 2014; 110:168–173. DOI: 10.1016/j.solener.2014.09.012.
7. Juzeniene A, Brekke P, Dahlback A, Andersson-Engels S, Reichrath J, Moan K, Holick MF, Grant WB, Moan J. Solar radiation and human health. Rep. Prog. Phys 2011; 74:066701(56pp). DOI:10.1088/0034-4885/74/6/066701.
8. Andrade RC, Tiba C. Extreme global solar irradiance due to cloud enhancement in northeastern Brazil. Renewable Energy 2016; 86:1433-1441. DOI: 10.1016/j.renene.2015.09.012.
9. WHO, WMO, UNEP and NIRP: Global Solar UV Index: A practical guide. WHO/SDE/OEH/2.2. 2002. URL: http://www.who.int/uv/publications/en/GlobalUVI.pdf.
10. Zaratti F, Piacentini RD, Guillén HA, Cabrera SH, Liley JB, McKenzie RL. Proposal for a modification of the UVI Risk Scale. Photochem. Photobiol. Sci.2014; 13:980-985. DOI: 10.1039/c4pp00006d.
11. Lucas R, McMichael T, Smith W, Armstrong B. Solar Ultraviolet Radiation: Global burden of disease from solar ultraviolet radiation. Environmental Burden of Disease Series. 2006; 13. URL: http://www.who.int/uv/publications/solaradgbd/en/.
12. Weatherhead SC, Farr PM, and Reynolds NJ. Spectral effects of UV on psoriasis. Photochem. Photobiol. Sci.2013; 12(1):47-53. DOI: 10.1039/c2pp25116g.
13. de Gruijl FR, van der Leun JC. Estimate of the wavelength dependency of ultraviolet carcinogenesis in humans and its relevance to the risk assessment of a stratospheric ozone depletion. Health Physics 1994; 67(4): 320-325.
14. S’Orazio J, Jarrett S, Amaro-Ortiz A, Scott T. UV Radiation and the skin. In. J. Mol. Sci. 2013, 14:12222-12248. DOI: 10.3390/ijms140612222.
15. Rivas MA, Rojas EE and Madronich S. Aumento del índice solar ultravioleta con la altura. Revista chilena de ingeniería. 2008; 16(2): 383-388.
16. Holick MF. Biological Effects of Sunlight, Ultraviolet Radiation, Visible Light, Infrared Radiation and Vitamin D for Health. Anticancer Research 2016; 36:1345-1356. URL: https://www.ncbi.nlm.nih.gov/pubmed/26977036.
17.Hovila J, Arola A, Tamminen J. OMI/Aura Surface UVB Irradiance and Erythemal Dose Daily L3 Global Gridded 1.0 degree x 1.0 degree V3, NASA Goddard Space Flight Center, Goddard Earth Sciences Data and Information Services Center (GES DISC), Accessed [Data Access Date] 10.5067/Aura/OMI/DATA3009, 2013. URL: https://giovanni.gsfc.nasa.gov/giovanni/.
18.Madronich S. UV radiation and the natural and perturbed atmosphere, in UV-B Radiation and Ozone Depletion, edited by M. Tevini, Lewis, Boca Raton, Fla., 1993.
19. SSE/NASA - AtmosphericScience Data Center de la Nasa.URL: https://eosweb.larc.nasa.gov/.
20. Smith RC, Prézelin BB, Baker KS, Bidigare RR, Boucher NP, Coley T, Karentz D, MacIntyre S, Matlick HA, Menzies D, Ondrusek M, Wan Z, Waters KJ. Ozone Depletion: Ultraviolet Radiation and Phytoplankton Biology in Antarctic Waters. Science 1992; 255(5047):952-959. DOI: 10.1126/science.1546292.
Received: 20 diciembre 2017
Approved: 29 enero 2018
José M Huaca P1*, Graciela M. Salum2, Rubén D. Piacentini3,4
1Universidad Técnica del Norte, Ibarra, Ecuador
2School of Biological Science and Engineering, Yachay Tech University, Urcuquí, Ecuador
3Instituto de Física Rosario (CONICET – Universidad Nacional de Rosario), Rosario, Argentina
4Laboratorio de Eficiencia Energética, Sustentabilidad y Cambio Climático, IMAE, Facultad de Ciencias Exactas, Ingeniería y Agrimensura, Universidad Nacional de Rosario, Rosario, Argentina
Correspondence: Eng. José M Huaca P, Universidad Técnica del Norte,