2023.08.02.72
Files > Volume 8 > Vol 8 No 2 2023
Molecular detection and gene expression of carbapenemase (blakpc) encoding gene of Klebsiella pneumonae isolated from clinical samples.

Rana Kadhim Mohammed1,* , Karam D. Salman2 and Heba K. Tawfeeq3
1 the University of Baghdad, College of Science, Department of Biotechnology
e-mail: Rana.mohammed@sc.uobaghdad.edu.iq
2 Al-Esraa University College, Department of Medical Laboratory Techniques
3 University of Baghdad, College of Science, Central Environmental Laboratory
* Correspondence: e-mail: [email protected]
Available from: http://dx.doi.org/10.21931/RB/2023.08.02.72
ABSTRACT
Background: Klebsiella pneumonia carbapenemases (blakpc) can hydrolyze carbapenems, which cause many bacteria resistance to multiple classes of antibiotics, so the rapid spread of blakpc is concerning. Laboratory identification of blakpc-carrying clinical isolates would be critical in limiting the bacteria's spread. This study would look at a quick and low-cost real-time PCR assay for detecting the level of expression of the black gene from Klebsiella pneumonia before and after being treated with a specific concentration of the Meropenemas drug. Method: From January 2021 to March 2021, Twenty-three K. pneumoniae strains were collected from patients presenting at various hospitals in Baghdad, Iraq. The disk diffusion method was used to test the strains, and the E-test minimum inhibitory concentration was determined (MIC). The black gene was then identified using the reverse transcription-PCR method. Finally, gene expression was measured using a real-time PCR assay in the presence and absence of Meropenem antibiotics. Results: Phenotypic testing revealed a high level of antibiotic resistance, whereas genotypic methods revealed the presence and expression of carbapenemase gene. Conclusion: The findings suggest revisions to current antibiotic therapy protocols due to the high expression level of resistant carbapenemases in K. pneumoniae strains.
Keywords: MIC, Meropenemas antibiotic, Gene expression, Real-time PCR.
INTRODUCTION
Klebsiella pneumoniae is a Gram-negative opportunistic pathogen associated with hospital-acquired infections like pneumonia, urinary tract infections, septicemia, and meningitis. Infection with multidrug-resistant K. pneumoniae isolates is becoming more common in clinical settings. 1 Carbapenems are broad-spectrum antibacterial agents that should only be used as a last resort for infections caused by multidrug-resistant K. pneumoniae isolates. The exceptional ability of these bacteria to promote resistance to a wide range of antimicrobials via various molecular mechanisms, which are usually present in conjunction with clinical isolates 2. Carbapenem resistance has emerged in Enterobacteriaceae due to the acquisition of genes encoding carbapenemases (carbapenem hydrolyzing enzymes) 3. The carbapenem hydrolyzing genes are frequently encoded on mobile genetic elements and are cotransferred with other antibiotic-resistant genes, resulting in antimicrobial resistance gene cotransfer and rapid spread of bacterial infections 4. Treatment of life-threatening infections with imipenem/meropenem may favor the development of carbapenem resistance. Carbapenem-resistant K. pneumoniae strains have recently been discovered in Iraqi hospitals. Various mechanisms mediating resistance in these isolates must be investigated to control the spread and dissemination of carbapenem-resistant K. pneumoniae. Gene expression underlying the emergence of K. pneumoniae isolates with carbapenem resistance was investigated in this study.
MATERIALS AND METHODS
Phenotyping determination
Collection of Samples and Isolation of Klebsiella Pneumoniae
The clinical samples were collected from patients of various ages suffering from wounds, burns, respiratory infections, and urinary tract infections at various hospitals in Baghdad from January to March 2021. The samples were collected with sterile swabs, placed in sterile tubes containing normal saline, and transferred to the laboratory at the Department of Biotechnology, College of Science, University of Baghdad, for culturing. The swabs were then suspended in brain heart broth then incubated for 24 hours at 37°C, whereas the UTI sample was collected directly in a sterile container and cultured within 2 hours. Then morphological, microscopic examination, biochemical tests, and a diagnosis were made based on Bergey's Manual 5.
Antimicrobial susceptibility test
After Mueller-Hinton plates were prepared, the inoculum was prepared by transferring 3-5 colonies into a tube of 5 ml of Muller Hinton broth, obtaining culture with 1.5 108 CFU/ml, and adjusting to 0.5 McFarland turbidity standard. Suspensions were used, and the plates were inoculated by a sterile swab into the inoculum, removing the excess and rubbing the swab three times across the surface of the medium while rotating the plate through at a 60° angle after each application. Finally, a swab was passed around the agar surfaces, and the inoculums were allowed to dry at room temperature for several minutes. The antibiotic disk was positioned on the inoculated plate (each plate with 5 disks) and then dispensed on the agar surface with sterile forceps. Then incubated overnight at 37 C within 30 minutes. 6
Minimum Inhibition Concentration (MIC) of Meropenem
One gram of Meropenem powder antibiotic was dissolved in 10 ml of distilled water and then filtered by Millipore until a serial dilution beginning with 1024-2 µg/ml was prepared and used directly in the experimental of biofilm virulence factors inhibition (Reuter and Lawson, 1996). The test was performed on 32 isolates for Meropenem using broth dilution method 7 and was done in triplicate. After overnight incubation at 37°C, the antibacterial activity was tested. The MIC was defined as the lowest concentration of a test sample that inhibited observable growth in broth.
Biofilm Development test
A 96-well microtiter plate assay was used to detect the biofilm formation 8. All 32 isolates were cultured in Tryptic soy broth (TSB) containing 20% glucose. Each isolate was grown at 37 C overnight, cultures were diluted using McFarland standard No. 0.5,1.5*108 cell/ml, and a 180µl suspension of these cultures and 20µl of TSB broth were placed in each of three wells of a 96-well flat-bottomed polystyrene plate. To serve as controls, some wells were filled with sterile TS broth supplemented with 20% glucose and incubated for 24 hours. The temperature is 37°C. Following that, each well was washed. The plates were washed thrice with 200 µL of phosphate saline (PBS) to remove any remaining non-adherent cells. Add 200 µl of absolute methanol to the adherent bacterial cells to fix them. For 15 minutes, each well was stained with 200 µl of 0.1 percent crystal violet. To remove an excess stain, washing was performed. Crystal violet bound to adherent cells was later retained with 200 µl of ethanol per well. The amount of crystal violet removed in each well using 33 percent glacial acetic acid was directly amounted to spectrophotometrically at OD630 using a micro Elisa reader. Three standard deviations plus the mean OD of a negative control were used to calculate the cut-off value (ODC). The absorbance values represented the intensity of the biofilm formed on the surface of the microtiter wells by the isolates. The obtained results were divided into four groups. If the absorbance of the samples is less than or equal to the absorbance of the control, there will be no biofilm production. However, if the absorbance of the control is less than or equal to the absorbance of the samples or equal to the 2* absorbance of the control, there will be weak biofilm production; on the other hand, if the 2* absorbance of control is less than or equal to the 4* absorbance of the control, there will be moderate biofilm production; however, if the 4* absorbance of control is less than the absorbance of the samples that mean strong biofilm production.
Molecular assay
Total RNA extraction
The total RNA of K. pneumoniae isolates was extracted using the TRIzol® LS Reagent (Life Technologies - Ambion CO.) according to the manufacturer's protocol after inoculating the strains in the nutrient broth (5ml) at 37 °C overnight.
Reverse transcription synthesis
Protoscript cDNA synthesis kit (NEB®) was used to reverse transcribe mRNA from total RNA. The procedure was performed in a 20 µl reaction volume, according to the manufacturer's protocol (New England Biolabs). Then, cDNA was stored at -80 °C until use.
Real-time assay (qRT-PCR)
The Bioer® Real-time PCR System (Bioer, Japan) and qPCRsoft software performed qRT-PCR. The threshold cycle (Ct) was measured using the 2x qPCR Master Mix Kit components to determine gene expression levels and fold change. Table 1 shows the components of quantitative real-time PCR used to express the blakpc and 16SrRNA genes.
Amplification of housekeeping gene
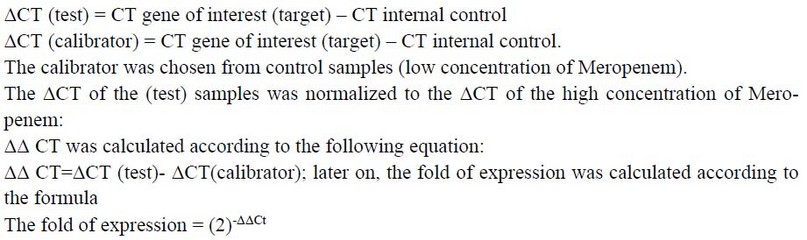
The housekeeping gene 16SrRNA was used as an internal control to normalize the differences between pre/post-treatment and calculating the ΔCT value according to Livak formula 9
Primers
The source of all primers used in this study was macrogen® (Korea). The name and sequence are given in Table 2 and Figure 1, showing the binding sites of primers.
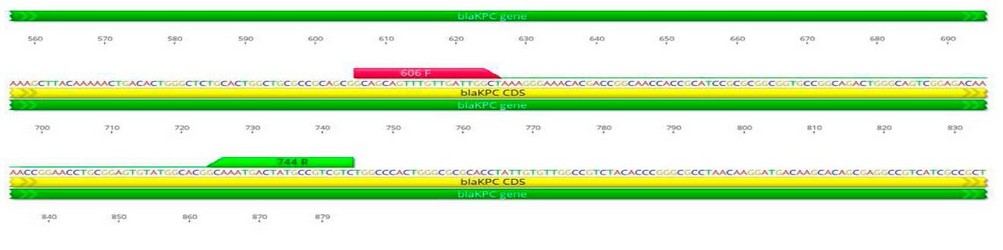
Figure 1. The name, sequence and product size of primers used in this study
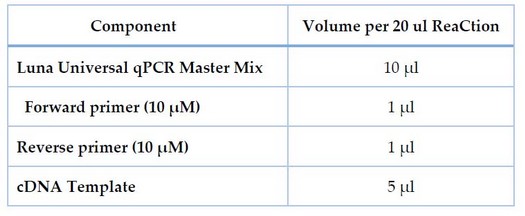
Table 1. Components of qPCR used in the expression of the blakpc and 16SrRNA genes.
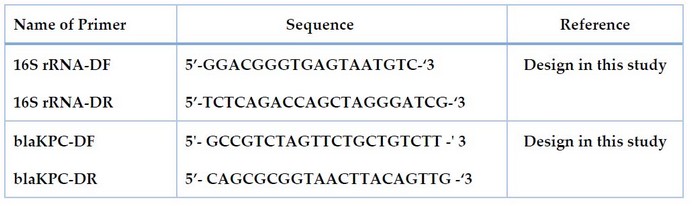
Table 2. The name, sequence and product size of primers used in this study
The qPCR ReaCtion run
For 16SrRNA and blakpc genes, the cycling protocol was programmed using the thermal and screening profile shown in Table 3.
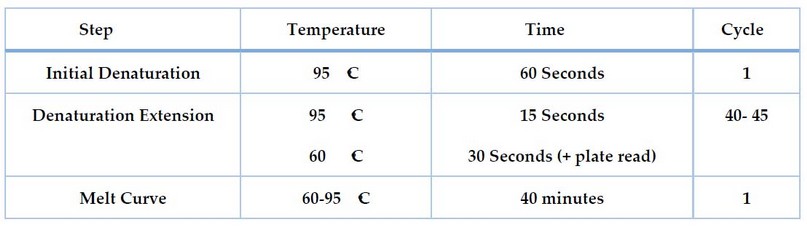
Table 3. The thermal of 16SrRNA and blakpc gene expression
Real-Time qRT-PCR Analysis for 16SrRNA and blakpc
Gene Expression
To compare the transcript levels between different samples in a different concentration of Meropenem Livak formula was used 9. The CT of the gene of interest was normalized to that of the internal control gene. The difference in the fold of expression between isolates was calculated according to Meropenem concentration, the high concentration of Meropenem considered as a test group and the low concentration as a calibrator and the following formula was used:
Statistical Analysis
A statistical analysis system (SAS 10) program was used for detecting the effectiveness of different factors in the study used parameters. Test of least significant difference –LSD (Analysis of Variation-ANOVA) has been used in significant comparison among the means in the current study.
RESULTS
The K. pneumoniae identification
Eighty-eight samples were collected from males and females aged between 10 and 60 years; then, only 40 isolates out of 88 clinical samples were identified as K. pneumoniae based on morphological and biochemical characteristics.
Antibiotic susceptibility test
The results show in Table 4 the antibiotic susceptibility against seven types of antibiotics and the biofilm formation. All K. pneumoniae isolates from clinical samples show high resistance to antibiotics (Amoxicillin, ciprofloxacillin, Ceftriaxone, chloramphenicol, imipenem) at percentages of 17.5%, 55%, 75%, 72.5%, and 25%, respectively, the significant results show with Ciprofloxacillin isolate no. 22 (55%), while the high sensitivity to each of (Amoxicillin and Imipenem) at a percentage (45, 40)respectively. Furthermore, the ceftriaxone and ceftriaxone resistance was highest in the biofilm-forming isolates30(75%), followed by chloramphenicol 29(72.5). The P-value was highly significant (0.0001)
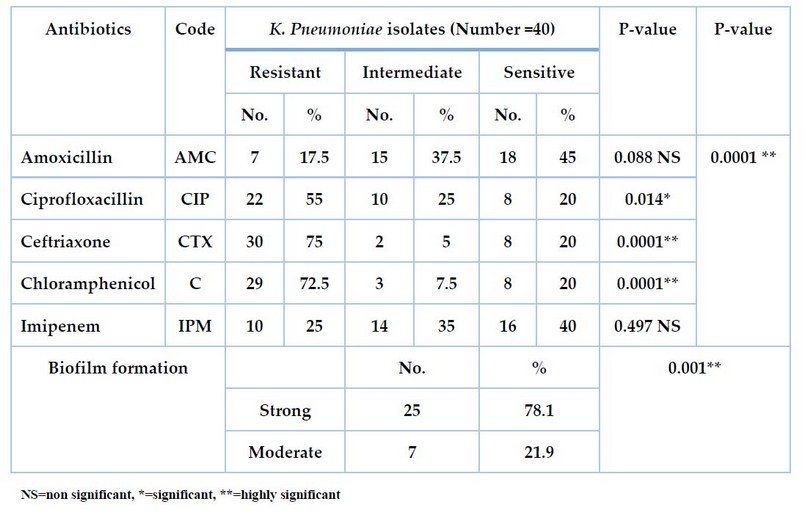
Table 4. Antibiotic sensitivity test and biofilm formation for K. pneumoniae isolates from clinical samples.
The EffeCts of Sub-MIC Meropenem on biofilm formation
The Meropenem at the different sub-MIC ranges was tested for K. pneumonia, and only 32 isolates showed positive results, as shown in Table 5. After growing bacteria, treated with Sub-MIC (µg/ml) Meropenem before the incubation, then measuring the absorbance at OD630, the results show varying intensity by different sources of isolates. It has been high inhibition effects of biofilm formation for all isolates after being treated with the Meropenem antibiotic, even with the low sub-MIC concentration, as well as the differences after the treatment with MIC value was p-value (p≤0.05). In contrast, the mean value after treatment with sub-MIC value was p-value (p≤0.01), and the differences in the same column were p-values (p≤0.0001). Isolates no(1,3,6,8,12,13,14,15,18,22,25,27,29,30)were non-significant (0.093, 0.078, 0.116, 0.097, 0.076, 0.336, 0.065, 0.078, 0.061, 0.066, 0.185, 0.263, 0.269, 0.662 ) respectively, and the isolates no. (4,5,9,10,11,16,17,20,21,23,28,31)were significant (0.0496, 0.0517, 0.0441, 0.0392, 0.0472, 0.0467, 0.0494, 0.0453, 0.0389, 0.0278, 0.0483, 0.0042) respectively, while isolates no. (2,7,19,24,26,32) were highly significant (0.0055,0.0065,0.0085,0.0052,0.0072,0.0042) respectively. These high significances were measured with sub-MIC values (32, 16, 2) µg/ml, representing the most effective concentration inhibiting the biofilm for all isolates.
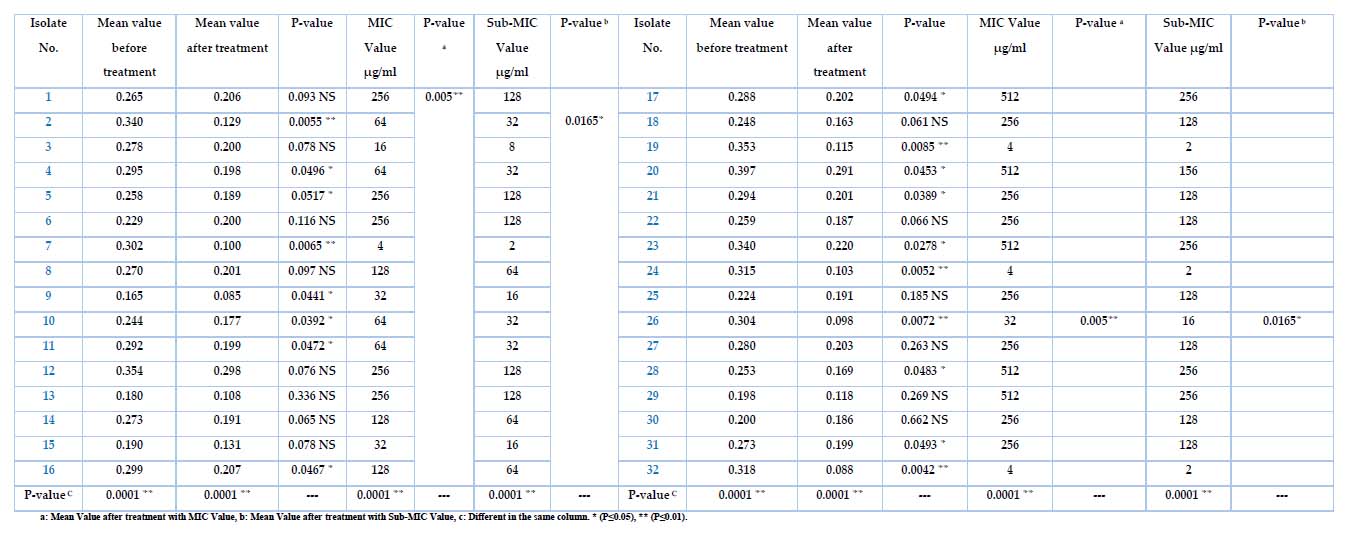
Table 5. The K. pneumoniae before and after treatment with MIC and Sub-MIC Values
The biofilm formation assay
The ability of K. pneumonia isolates to biofilm formation was tested by the microtiter plate method (MTP). Table 4 shows the differences for all isolates among the adherent degree. Specifically, the isolates no. 25(78.1%) and 7(21.9%) were strong and moderate) respectively, which represent highly significant results at a P-value of 0.001. while Table 6 shows the biofilm formation before and after treatment for all 32 isolates with the Meropenem antibiotic. The mean value before and after the Meropenem treatment was a highly significant P-value(0.0001 ). Highly significant isolates no. (2, 7, 19, 24, 26, 32) were (0.0055, 0.0065, 0.0085, 0.0052, 0.0072, 0.0042)depend on the P-volume (P≤0.01) Significant isolates no. (4,5,9,10,11,16,17,20,21,23,28)were(0.0496, 0.0517, 0.0441 , 0.0392, 0.0472, 0.0467, 0.0494, 0.0453, 0.0389 , 0.0278, 0.0483 ) depending on P-volume (P≤0.05) Non significant isolates no. (1,3,6,8,12, 13, 14, 15, 18, 22, 25, 27, 29,30, 31)were(0.093, 0.078, 0.116, 0.097, 0.076, 0.336, 0.065 , 0.078, 0.061, 0.066, 0.185 , 0.263, 0.269 , 0.662, 0.0493).
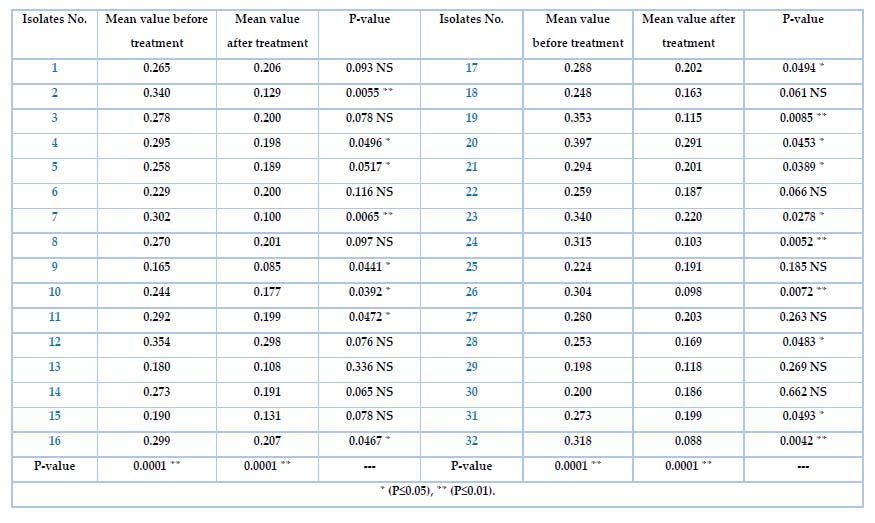
Table 6. Biofilm formation before and after treated K. pneumonia with Meropenem
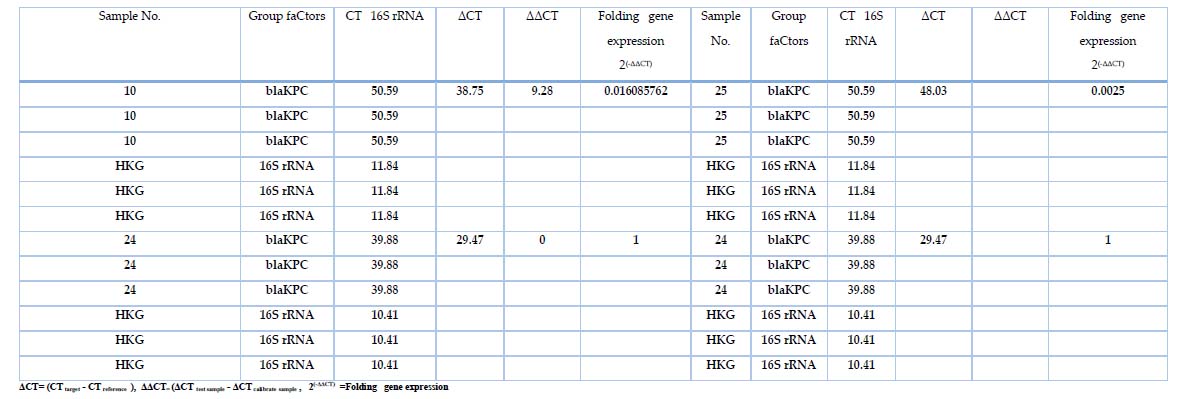
Table 7. The fold expression of 16SrRNA and blaKPC
Real-time PCR Quantification of blaKPC gene Expression
Gene expression of blaKPC was measured in samples that treated with different concentrations of Meropenemes antibiotic, as well as 16S rRNA gene which used as endogenous control In all 32 bacterial isolates; the results showed in Table 7, figure 2 the expression of 16S rRNA gene in all samples, the show non-significant difference in the mean Ct Value (11.84 ) in presence study, the variation of the total change in expression of 16S rRNA was studied in different study groups as shown in table 7. However, the blaKPC gene showed expression in only 3 isolates, indicating the effectiveness of the substance (Meropenemes antibiotic) on the blaKPC gene. As for the three isolates, where the Livak equation was applied to find out the change of expression among them, the ratio of fold expression for samples (10, 25) was 62.5↓ and 400↓ . It turned out that samples 10 and 25 were less expressive than samples 24 (calibrator) by 62 and 400 times, respectively. All 23 samples showed a higher gene expression of blaKPC before treating the isolates with Meropenemas antibiotic.
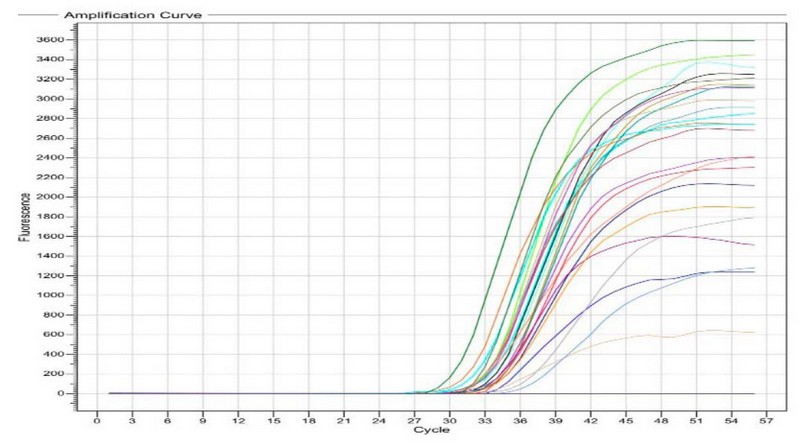
Figure 2. For the blaKPC gene detection Real-Time PCR (before being treated with Meropenemas), Ct values ranged from 30 to 39; the picture was taken directly from a Real-Time PCR machine.
DISCUSSION
Isolates of K.pneumoniae from a variety of clinical source to measure the prevalent in this study due to their virulence factors and components; in the current study, the antibiotic susceptibility test for all forty isolates of K.pneumoniae were tested against 5 antibiotics and showed significant results for both of Ceftriaxone and Chloramphenicol, cephalosporins were used in this study, the results show that all isolates demonstrated very high resistant for this antibiotics. These results agreed with previous local studies; they found that more than 70% of isolates collected from burns and wounds were resistant to Ceftriaxone, the mechanism of the resistance was due to enzyme secretion of Cephalosporin's, 11,12,13 while other antibiotics in the current study were showed non-significant results to Imipenem antibiotic, only 25% from all isolates were sensitive to Imipenem antibiotic which belongs to carbapenems, as well as there were no significant results shown with Amoxicillin for all isolates, These results disagreed with most of the local studies, that reported, that, all isolates under their studies had the high resistance to Ampicillin and Amoxicillin 14, 15, 16. Bacteria can prevent the accumulation of these antibiotics by using a system of chromosomally encoded efflux pumps 17. Also, the outer membrane of K. pneumoniae has poor permeability for antibiotics and much more than for compound classes, with a rate permeability ranging from 10 to 500 times lower than E. coli permeability rates 18. Another researcher has indicated overlap and interaction among chromosomal ß-Lactamase systems for both efflux pump extended spectrum 19. Also, the presence of the resistance genes associated with R-plasmid will give the isolates much more resistance to more antibiotic classes 20. All isolates of this study could form the biofilm ranged in intensity among high, medium and weak adherents according to the application of the equation. These results nearly agree with many local studies; they measured the isolates, and their capability of forming the biofilm ranged in intensity among high, medium and weak adherents according to the equations 21,23,22. Three isolates were chosen for the next step of the study, among high, medium and weak adherent isolates after biofilm formation assay; isolates no.(24, 10, 25) were highly significant, significant, non-significant ( 0.0052, 0.0392, 0.185), respectively, after measuring the P- value.
On the other hand, 24 indicates that the variation in the ability of isolates to form biofilm back to the association of production of the ß-Lactamase, the bacterial isolates produce multiple types of an enzyme where the strong biofilm, compared with isolates that produce one type of enzyme, while the isolates that unable to produce this enzyme not forming the biofilm. Furthermore, we measured the sub-MIC Meropenem antibiotic with different concentrations, and the results show the verity in P-value for all 32 isolates; we also selected the identical isolates as an example for each of the highly significant, significant, and non-significant after the Sub-MIC test of Meropenem on biofilm formation, the isolates no. (24, 10 and 25) were (0.0052, 0.0392 and 0.185), the sub-MIC value (2, 64, 128) µg/ml, respectively. According to relative quantitative results obtained by RT-qPCR assay, the results for blakpc gene expression were detectable only in three isolates (24, 10 and 25), and the concentrations of Meropenem for these isolates were 2, 64, and 128 µg/ml, respectively. From these results, we concluded that as much as the concentration of Meropenem increased, the fold of expression will decrease by 25.
CONCLUSIONS
From these results, we concluded that as much as the concentration of Meropenem increased, the fold of expression will decrease.
Author Contributions: All authors have read and agreed to the published version of the manuscript.
Funding: This research received no external funding
Acknowledgments: Authors would like to thank all workers in the Biotechnology Lab at the Department of Biotechnology and the Central Environmental Laboratory (College of Science, University of Baghdad) for their assistance in making this work possible by providing the place, materials, and instruments.
Conflicts of Interest: The authors declare no conflict of interest.
REFERENCES
1. Jean, S. S., & Hsueh, P. R. Antimicrobial drug resistance in Taiwan. Journal of the Formosan Medical Association, 2011; 110(1), 4-13.
2. Potron, A., Poirel, L., & Nordmann, P. Emerging broad-spectrum resistance in Pseudomonas aeruginosa and Acinetobacter baumannii: mechanisms and epidemiology. International journal of antimicrobial agents, 2015; 45(6): 568-585.
3. Nordmann, P., Naas, T., & Poirel, L. Global spread of carbapenemase-producing Enterobacteriaceae. Emerging infectious diseases, 2011; 17(10), 1791.
4. Lee, C. R., Lee, J. H., Park, K. S., Kim, Y. B., Jeong, B. C., & Lee, S. H. Global dissemination of carbapenemase-producing Klebsiella pneumoniae: epidemiology, genetic context, treatment options, and detection methods. Frontiers in microbiology, 2016; 7, 895.
5. Holt, J. G., Krieg N R., Sneath, P, H, A., Staley, J. T. and William, S. T. 1994. Bergey's Manual of Determinative Bacteriology, Ninth Edition, William and Wilkins Company, United States.
6. Clinical and Laboratory Standards Institute (CLSI). Performance standards for antimicrobial susceptibility testing 28th Ed. Wayne P.A.; 2018.
7. Andrews, J. M. Determination of minimum inhibitory concentrations. Journal of Antimicrobial Chemotherapy, 2001; 48(suppl_1), 5-16.
8. Atshan, S. S., Nor Shamsudin, M., Sekawi, Z., Lung, L. T. T., Hamat, R. A., Karunanidhi, A., ... & Pei Pei, C. Prevalence of adhesion and regulation of biofilm-related genes in different clones of Staphylococcus aureus. Journal of BioMedicine and Biotechnology. 2012.
9. Livak, K.J. and Schmittgen, T.D. Analysis of relative gene expression data using real-time quantitative PCR and the 2-ΔΔ CT method. Methods. 2001; 25, 402–408
10. Falk, M., Marohn, F., & Tewes, B. Foundations of statistical analyses and applications with SAS. Birkhäuser. 2012.
11. Hassuna, N. A., Mohamed, A. H. I., Abo-Eleuoon, S. M., & Rizk, H. A. W. A. High prevalence of multidrug resistant Pseudomonas aeru. Archives of Clinical Microbiology, 2015; 6(4).
12. Al-Shamari, R. K., & Al-Khteeb, S. N. Molecular Characterization Aminoglycosids Resistance Pseudomonas aeruginosa. Iraqi Journal of Science, 2016; 57(2B), 1150-1157.
13. Mohammed, R. K., & Ibrahim, A. A. Identification of iha and kpsMT virulence genes in Escherichia coli isolates with urinary tract infection in Iraqi patients. Indian Journal of Natural Sciences, 2019; 9(52), 16676- 16682.
14. Flaih, O. N., Najeb, L. M., & Mohammad, R. K. Determine the Biofilm Formed by Using ELISA Technology for Gram-Negative Bacteria Isolated from Wounds and Burns Infections, and the Study of the Production of the Biofilm Molecularly. Ibn AL-Haitham Journal For Pure and Applied Science, 2017; 30(1), 325-338.
15. Jead, M. R., & Mohammed, R. K. Detection of lmrS, mepA, norC genes among Staphylococcus Aureus isolates. International Journal of Pharmaceutical Research, 2020; 12(1).
16. Omar, N. N., & Mohammed, R. K. A Molecular Study of Toxic Shock Syndrome Toxin gene (tsst-1) in β-lactam Resistant Staphylococcus aureus Clinical Isolates. Iraqi Journal of Science, 2021; 825-837.
17. Kumar, S. Textbook of microbiology. JP Medical Ltd. 2012.
18. Hirsch, E. B., & Tam, V. H. Impact of multidrug-resistant Pseudomonas aeruginosa infection on patient outcomes. Expert review of pharmacoeconomics & outcomes research, 2010; 10(4), 441-451.
19. Koren, J., & Vaculíková, A. Development of Beta-lactamase resistance in enterobacteria. Klinicka mikrobiologie a infekcni lekarstvi, 2006; 12(3), 103-107.
20. Nordmann, P., & Poirel, L. Emergence of plasmid-mediated resistance to quinolones in Enterobacteriaceae. Journal of Antimicrobial Chemotherapy, 2005; 56(3), 463-469.
21. Moteeb, S. H. Quantitative and qualitative assays of bacterial biofilm produced by Pseudomonas aeruginosa and Klebsiella spp. J. Al-anbar Univ. pure sci, 2008; 2(3), 6-13.
22. Mohammed, R. K., & Ahmad, R. A. Molecular Detection of Virulence Factors Genes in Pseudomonas aeruginosa isolated clinically from Different Infections Source. Current Research in Microbiology and Biotechnology, 2017; 5(5), 1278-1284.
23. Flaih, O. N., Najeb, L. M., & Mohammad, R. K. Molecular Detection of Serotypes K1 and K2 of Klebsiella pneumonia Isolated Form Wound and Burn Infections. Al-Anbar Journal of Veterinary Sciences, 2016; 9(1).
24. Heydari, S., & Eftekhar, F. Biofilm formation and β-lactamase production in burn isolates of Pseudomonas aeruginosa. Jundishapur Journal of Microbiology, 2015; 8(3).
25. Saleh, R. O., Hamdi, N. M., & Mohammed, R. K. Detecting Mycobacterium Tuberculosis through Bacterioferritin Gene Amplification by Real-Time PCR. Systematic Reviews in Pharmacy, 2020; 11(11), 786-789.
Received: May 15, 2023/ Accepted: June 10, 2023 / Published: June 15, 2023
Citation: Mohammed, R.K.; Salman, K.D.; Tawfeeq, H.K. Molecular detection and gene expression of carbapenemase (blakpc) encoding gene of Klebsiella pneumonae isolated from clinical samples.Revis Bionatura 2023;8 (2) 72. http://dx.doi.org/10.21931/RB/2023.08.02.72