2021.06.02.19
Files > Volume 6 > Vol 6 No 4 2021 > Vol 6 No 2 2021
A Spatio-temporal distribution analysis of vesicular stomatitis outbreak in Ecuador, 2018

María Teresa Salinas1, Euclides José De La Torre2, Paola Katerine Moreno3, Andrés Alejandro Vaca4 and Rubén Alexander Maldonado5*
Available from: http://dx.doi.org/10.21931/RB/2021.06.02.19
ABSTRACT
Vesicular stomatitis (VS) is a viral disease primarily affecting cattle, swine, and equine causing economic losses. It is of particular interest because its outward signs are similar to those of foot-and-mouth disease. Outbreaks of VS occurred in several herds in Ecuador in 2018, affecting principally bovines. In this sense, the present study was conducted to characterize the temporal and spatial dynamics of Vesicular stomatitis occurrence between January and December 2018. During the study period, 583 animals with symptoms of VS were reported. In this way, tissue samples were collected, VS was diagnosed, and outbreaks were defined as herds with a confirmed positive test for the disease.
Outbreaks were georeferenced, and Space-time clusters were used to determine zones where the number of reported outbreaks was more significant than expected. A space-time permutation scan statistic (STPSS) was used to identify hot spots of space-time interaction within patterns of the cases reported. Standard Monte Carlo Critical Value was used to test for the cluster's significance. A total of 399 outbreaks were presented in 18 provinces. Spatial scan statistics allowed the detection of four significant space-time clusters of VS outbreaks. The highest incidence was reported around week 35 and week 44, which were observed outbreaks increase in the country's north region. In this sense, clusters coincided with the areas with the highest incidence of outbreaks. Besides, maps showed places where the disease is not shared. The information showed in the present study may contribute to prevents VS spread into regions of Ecuador that is only sporadically affected by the disease. Monitoring in affected zones may lead to quick responses to possible outbreaks issuing alerts when there is a greater than typical risk of spreading the disease.
Keywords: Spatio-temporal analysis, outbreak, vesicular stomatitis virus.
INTRODUCTION
Spatio-temporal is a type of clustering in which data values, including the time dimension, are introduced into spatial data. Accordingly, the objects are grouped as per their spatial and temporal similarity1. Vesicular stomatitis (VS) is a disease of livestock commonly observed in adult animals caused by vesicular stomatitis virus (VSV) belonging to Rhabdoviridae, genera Lyssavirus and Vesiculovirus.2 3 VSV affects cattle, swine, and equine. However, it also can affect sheep, goats, camelids, and buffalo. Natural infection in sheep and goats is rare but has been demonstrated in experimental conditions. The incubation period is between 2 to 8 days. The morbidity rate varies from 5 up to 90 percent.4 How VS spreads is not fully understood; once the disease is introduced into a herd, it may move from animal to animal. VSV's can spread quickly under natural conditions. The most common transmission routes are vector-borne, direct contact, or exposure to saliva or fluid from ruptured vesicles.5 However, the virus can infect animals by the transcutaneous or transmucosal route.6 VSV has an important economic impact resulting in quarantine, animal movement restrictions, and decreases in meat and milk production.7 Also, VSV denotes extensive regulatory responses by government agencies, including trade restrictions and market closures.8 For this reason, it has become a disease of interest. Its clinical signs are similar to those of foot-and-mouth disease, vesicular exanthema of swine, or swine vesicular disease. However, generally less severe.9 10 There are two serotypes of VSV, Vesicular stomatitis New Jersey (VSV-NJ) and Vesicular stomatitis Indiana (VSV-IND). Both serotypes have similar morphological characteristics and pathology with the difference of the neutralizing antibodies generation in infected animals.11 Indiana serotype is subtyped serologically into 3 groups. VSV-IND belongs to the Indiana 1 subtype, Cocal virus to the Indiana 2 subtype, and VSV-AV to Indiana 3. Deaths are sporadic in cattle and horses, but higher mortality is observed with VSV-NJ infection in swine.12 Confirmed VSV infection is limited to the Americas. The virus is thought to have originated in equatorial America and spread north during two separate colonizing events3. This disease is seasonal, although cases may occur throughout the year. Outbreaks caused by VSV-NJ or VSV-IND usually occur each year. They are particularly common at the end of the rainy season or early in the dry season. In endemic areas, both explosive epidemics and outbreaks of slow dissemination can be seen with a relatively small number of cases.11 Specifically, VSV-NJ and IND-1 are endemic in Ecuador and other countries in South America.3 The samples used for diagnosis include vesicle fluid, epithelium covering unruptured vesicles, or epithelial flaps of freshly ruptured vesicles. Recommended tests by World Organization for Animal Health for vesicular stomatitis include IS-ELISA (Indirect Sandwich), CFT (Complement Fixation test), RT-PCR (Reverse transcriptase-polymerase chain reaction), LP-ELISA (liquid phase blocking ELISA), c-ELISA (competitive ELISA), and V.N. (virus neutralization)13. In 2018, an outbreak of Vesicular stomatitis in Ecuador occurred. The outbreaks distribution included 18 provinces in which different livestock premises were investigated. Therefore, this study aimed to characterize the temporal-spatial distribution of Vesicular stomatitis outbreaks reported in Ecuador in 2018.
METHODS
Animal samples – Tissue samples (vesicles or lesions on the inner surfaces of the foot, lips, tongue, udder, gums, and dental pad) (n=583) were collected by field technicians as information about the suspected animals. VS was diagnosed through IS-ELISA Differential Typing Kit (PANAFTOSA-OPAS/OMS) (n=568). Molecular diagnosis (n=15) was performed using Transcriptor First Strand cDNA Synthesis Kit (Roche) and GoTaq® Hot Start Green Master Mix (Promega Corporation). The diagnosis was performed at the Animal Diagnosis Laboratories at Agrocalidad.
Data collection – Information and laboratory results corresponding to all livestock premises attended for VS between January and December 2018 were registered in databases. The information registered for each outbreak included: identification of cases and samples, date of the case reported, animal species, livestock premise activity, geographic location, number of samples collected, and diagnosis results.
Outbreak information – Outbreaks were assumed to have started on the date when clinical signs compatible with VS were first observed in the herd and were notified to the agency. Cases were defined as animals with compatible clinical signs of VS. Outbreaks were defined as herds with at least 1 animal with a confirmed positive test result for VSV. Livestock premises, where results were negative for testing, were considered negative for VSV infection. Cases were aggregated into 7-day groups to account for week variations. These variations were based on calendar week. Each outbreak was georeferenced using the geographic coordinates of the herd and QGIS software. To analyze outbreaks, these were georeferenced by use of the centroid of the municipalities. The centroid data were obtained from databases of the Instituto Geografico Militar - IGM. Outbreaks caused by VSV-NJ and VSV-IND were used in the analyses reported here.
Data analysis and Spatio-temporal distribution - The space-time was analyzed using SaTScan software, in which the number of cases was compared to the expected cases of outbreaks within each cluster. Outbreaks were mapped using the same software. Space-time clusters were used to determine zones where the number of reported outbreaks was more significant than expected based on the population size. A space-time permutation scan statistic (STPSS) was used to identify hot spots of space-time interaction within patterns of the cases reported. In this sense, a retrospective Space-Time analysis was used for clusters with high rates. Standard Monte Carlo Critical Value was used to test for the cluster's significance. The clusters were determined as statistically significant when its test statistic was greater than the critical value, which is the significance level (P<0.001).
RESULTS
Cases started from January 5th through December 19th, 2018. During this period, 583 cases from different livestock premises were reported to Agrocalidad in different provinces. Cases were presented as follows: 561 cattle, 11 equines, 8 swine, and 3 caprines. From the total presented cases, 399 (68.44%) were confirmed outbreaks with VS. In this regard, about 60% of the reported cases were confirmed outbreaks. There was an increase in the number of outbreaks starting in August that continued through November. Outbreaks were present in three regions of Ecuador (Highlands, Coast, and Amazon). Bovines were the most affected with 391 (98.00%) outbreaks, followed by 5 (1.25%), 2 (0.50%), and 1 (0.25%) outbreaks in swine, equines, and caprines, respectively. Outbreaks were presented in 18 provinces. Consequently, Santo Domingo was the province with the highest number of outbreaks, presenting 93 (23.31%) outbreaks to VS, followed by Imbabura 75 (18,80%) and Napo 65 (16.29%). The remaining 184 (31.56%) cases were confirmed as a negative for VS. Furthermore, Santo Domingo de Los Tsáchilas presented outbreaks in 61.11% of its municipalities, followed by Imbabura (57.14%), Pastaza (47.62%), and Napo (39.13%). The distribution and the total outbreaks per province and municipalities are detailed in Table 1, in which the distribution of outbreaks by quarter can be observed. Thereby it is possible to visualize the months that arose a significant increment thereof. For a better appreciation, the outbreaks distributed by quarters are shown in Figure 1. From 399 outbreaks, 372 (93.23%) belong to VSV-NJ, 22 (5.52%) belong to VSV-IND, and 5 (1.25%) presented results for both virus serotypes. The serotype which had prevailed for most of the provinces during the outbreak was VSV-NJ. For the other hand, VSV-IND serotype was located in Morona Santiago, Pastaza, Orellana, Sucumbíos, Zamora Chinchipe, Pichincha, Santo Domingo de Los Tsáchilas, Esmeraldas and Guayas provinces. The distribution map of the serotypes is shown in Figure 2. Heat maps (Figure 3) were provided by the Directorate of Zoosanitary Surveillance of Agrocalidad and represent the alert notifications for vesicular diseases; this means that vesicular stomatitis and other diseases are included in the maps. Thus, heat maps show the distribution of alert notifications of vesicular diseases presented in 2017 and 2018. There was an increase in the number of outbreaks starting in August (Week 31) that continued through the last week of November; in this period, 509 cases were reported of which 351 outbreaks were confirmed. After week 37 of the recorded outbreaks, it went 2 weeks before new outbreaks were recorded, and after that, it was never more than 1 week between a recorded outbreak and another recorded outbreak. The highest incidence was reported in week 44, in which 76 outbreaks from 114 cases were confirmed (Figure 4). Spatial scan statistics allowed the detection of four significant space-time clusters (P < 0.001) of VS outbreaks (Table 2). The circular base represents the significant clusters corresponding to the outbreaks' geographical area (Figure 5).
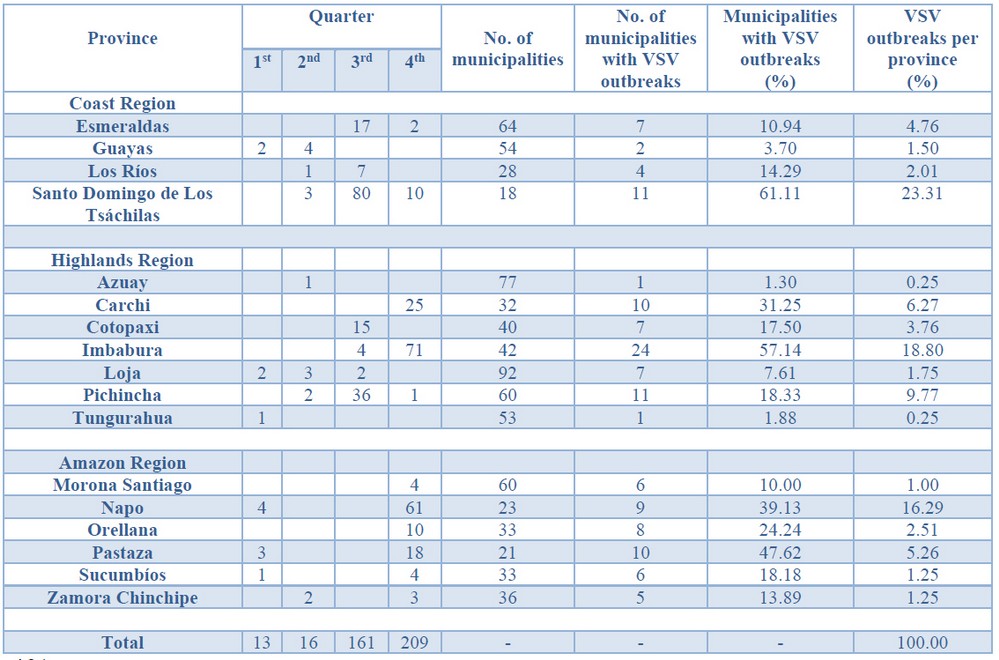
Table 1 - Distribution of outbreaks of Vesicular stomatitis per municipality confirmed in Ecuador in 2018.
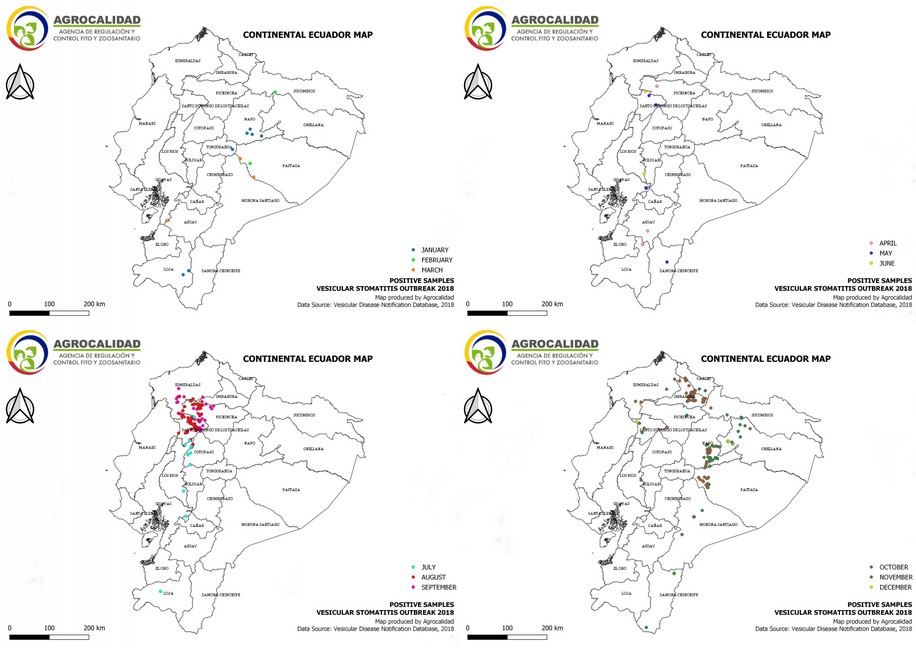
Figure 1. Distribution by quarters of outbreaks of Vesicular stomatitis confirmed in Ecuador in 2018.
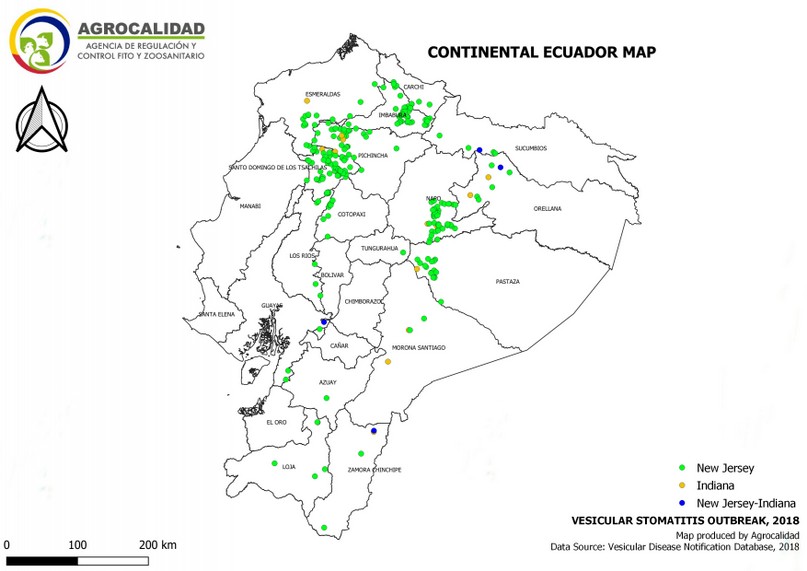
Figure 2. Distribution by serotype of outbreaks of Vesicular stomatitis confirmed in Ecuador in 2018.
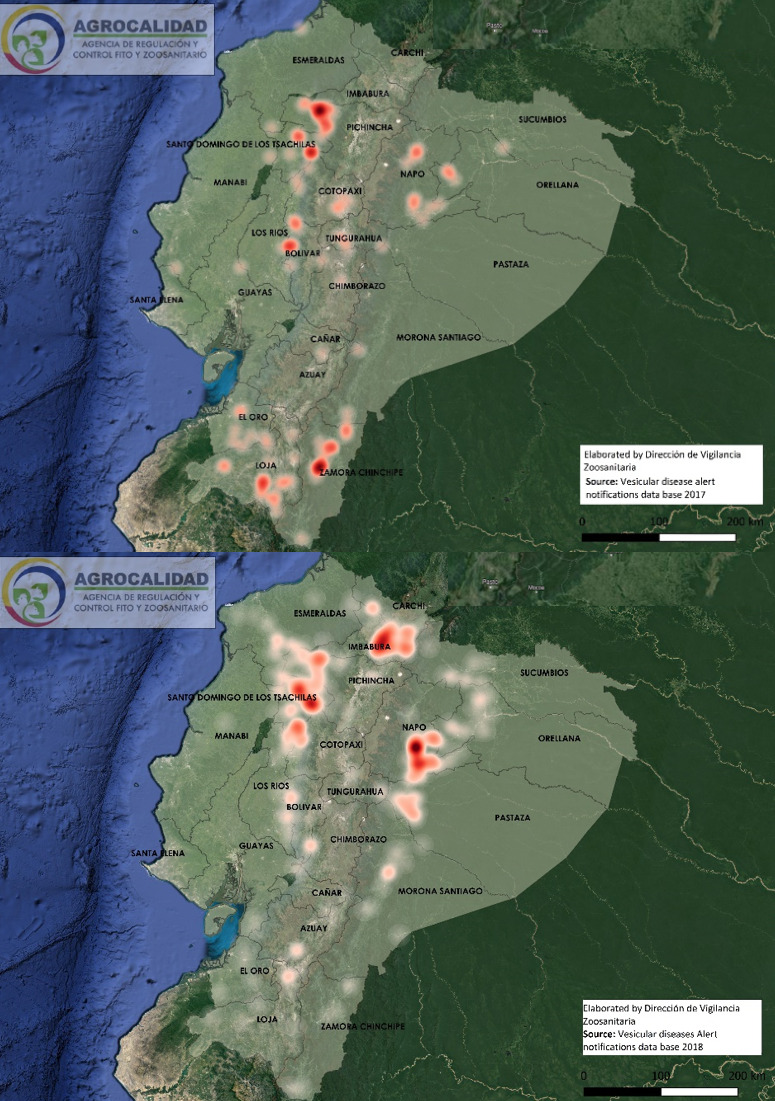
Figure 3. Heat maps of alert notifications for vesicular diseases in 2017 (3a) and 2018 (3b).
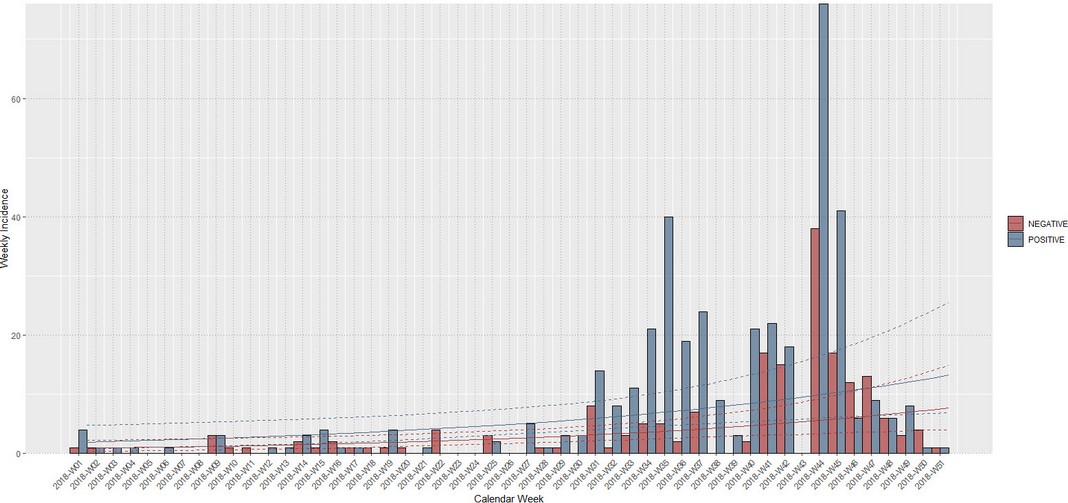
Figure 4. Weekly incidence of VS in Ecuador in 2018. Positive (blue) and negative cases (red).
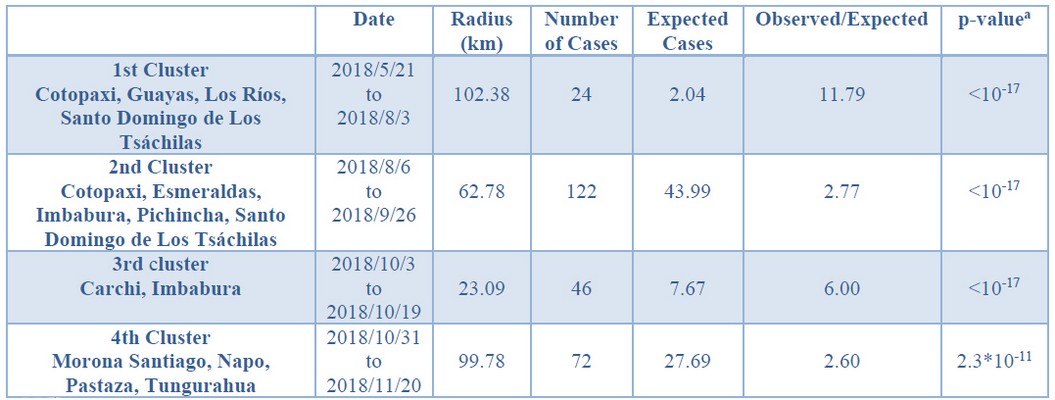
a Simulated p-value, calculated with 999 Monte Carlo replications.
Table 2 - Geographic Analysis of Vesicular Stomatitis Rates, using the Space-time Statistic: Ecuador, 2018.
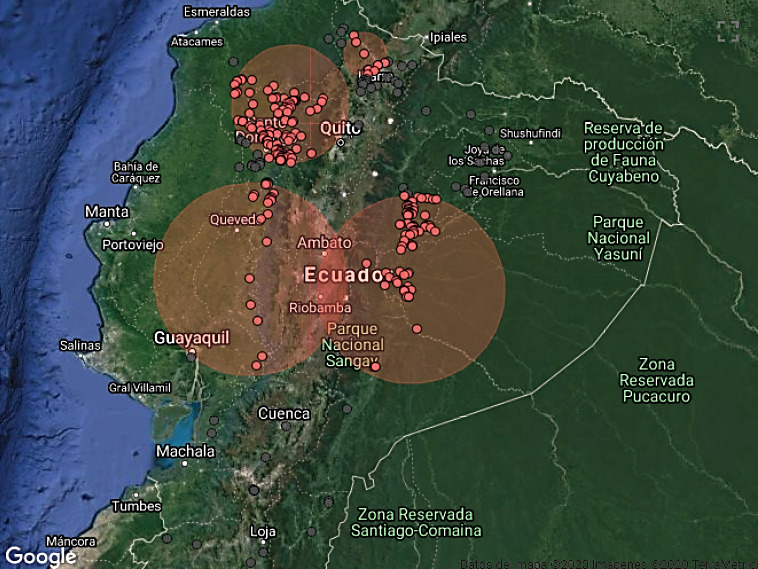
Figure 5. Spatial distribution of outbreaks of Vesicular stomatitis confirmed in Ecuador in 2018.
DISCUSSION
Due to the increase of vesicular stomatitis outbreaks presented during 2018 in Ecuador, this study analyzed the reported cases. Our approach through Spatio-temporal analysis enabled us to determine the sites of the outbreaks which have epidemiological importance. Literature mention that space-time scan statistics allow identifying statistically significant hotspots. The hotspots are evaluated by a significance value1 and are helpful for pattern understanding14. In this manner, the space-time scan statistic of this study identified the locations of the most-significant clusters.
Consequently, these clusters coincided with the areas with the highest incidence of the outbreaks. Thus, the study revealed that the increase in VS outbreaks reported during 2018, compared with cases in 2017, was associated with four significant space-time clusters. Some of the outbreaks were not included in any of the fourth clusters; this is due to common cases filed each year and are not representative.
The highest incidence was reported around week 35 and week 44, which were observed outbreaks increase in the country's north region (Figure 3). In this sense, the cluster closes to the municipality of Ibarra indicated the highest incidence rate, suggesting that the rate of transmission between herds was higher within this area than the other clusters in which the rate was similar. It was also observed that outbreaks increase began at the end of the summer or dry season and the beginning of the rainy season. This observation matches a monitoring study in Costa Rica in which all episodes of disease occurred at the beginning of the dry season15. Another study mention that VS outbreaks incidence from year to year varies according to the region. For example, in frostless areas, the disease is encountered every year16.
Factors that caused outbreaks still are not determined; however, studies suggest climate change may have favored the increase of vectors in affected areas, promoting disease transmission. A study in Mexico suggested that a change in climatic conditions could favor the vectors' spread into areas in which they are usually absent.17 Also, another study indicates an apparent relationship between climatic zones and the frequency of occurrence of vesicular stomatitis. However, it appears that limitations are imposed on the spread of the disease by particular physical features of the land or by habitat conditions within these zones16. Environmental conditions and climate variables play an essential role in the dynamics, distribution, and transmission of vector-borne diseases. In this way, when compared with previous years, it is possible to notice a change that triggered the outbreaks, suggesting that environmental and epidemiological factors may have influenced VSV spread. Even when the heat maps group all the vesicular disease alert notifications, it can be appreciated a difference in the distribution of cases between 2017 and 2018. In this manner, in the 2018 map, it can be seen an increment in the number of cases compared to the 2017 map, which represents the average number of alert notifications in provinces for each year. Likewise, the 2018 map shows places where the disease is not shared.
South and Central America have ecologic niches where outbreaks appear annually. The prevalence of the virus is established in the places where the disease is constantly being enzootic in those areas.18 For instance, Costa Rica presents two zones where the virus's activity is high considerably, one is located in the highlands (premontane tropical forest), and another is located in the lowlands (tropical dry forest)19. Ecuador also shows enzootic zones for VS, it is so every year common cases are presented in provinces like Carchi, Guayas, Manabí, Pichincha, Loja, Los Ríos and Zamora Chinchipe. Moreover, the disease has repeatedly spread along waterways in certain zones in the USA. Woodland pastures, rivers, and lakes are common in most epizootic regions and absent in the regions where the disease is self-limiting16. In this way, water bodies in the country, in conjunction with environmental factors, could have been another factor of the spread of the virus. Additionally, increased attack rates in pastured animals suggest insect vectors' role in the transmission of VSV20. Investigations reports VSV transmission routes involve insect vectors, such as mosquitoes, sand flies21, 22, black flies, and biting midges. In this way, VSV has been isolated from multiple arthropods collected in enzootic areas and during epizootics. Similarly, they have been found in high abundance, vectors causing agricultural pests like black flies and Culicoides midges when outbreaks occur5. In Ecuador has been found sand flies in some provinces (Azuay, El Oro, Esmeraldas, Guayas, Morona Santiago, Pastaza, Pichincha, Sucumbíos, and Zamora Chinchipe)23, being places that coincide with the presence of VS cases, so, the presence of vectors could have been a factor for the spread of the virus in the country.
Many places in South America are considered endemic zones for VSV, such as northeastern and northern Brazil24. In 1986, Ecuador recognized Loja province as an endemic area for VSV- N.J. Guayas, Los Rios, and Pichincha are recognized as endemic zones for VSV- N.J. at a low level, and Manabí, Cotopaxi, El Oro, and Zamora Chinchipe are considered as endemic zones at an occasional level. For VSV-I, there is not a specific place in Ecuador considered as an endemic, but it constantly appears in Loja, Zamora Chinchipe, Guayas, and Pichincha25. This is consistent with the distribution of VSV-NJ and VSV-I serotypes in Ecuador during the cases filed in 2018. However, the VSV-I serotype was found also in Esmeraldas, Santo Domingo de Los Tsáchilas, Sucumbíos, Orellana, Pastaza, and Morona Santiago.
The comparison with the distribution of the virus of previous years could help found an association of the expected virus each year and the virus found in new places.
CONCLUSIONS
Comprehend the temporal-spatial distribution is key to understanding VS epidemiology and improving and enforcing the responses of outbreaks when it appears, taking with regard that vesicular stomatitis presents similar symptoms with foot and mouth disease considered as a significant disease into animal health, economy, and business relationships. Viewed in this way, knowing the places where the farms are affected by the disease seasonally allows the prevention and control of the virus. For instance, in the USA, the outbreaks appear in intervals of 10 years in which the losses are estimated at around $200 per individual and around $15.565 per farm with the virus5. Further studies about vesicular stomatitis and its epidemiology will help better understand the disease and its behavior to changes that may cause new outbreaks. Accordingly, processes of regulation, control, and animal health surveillance headed to maintain the sanitary status in Ecuador could be supported based on the present study results. Monitoring in affected zones may lead to quick responses to possible outbreaks issuing alerts when there is a greater than typical risk of spreading the disease, in areas that are not affected by the disease, or present minimal cases that are expected every year.
Acknowledgments
We acknowledge field technicians of the Agencia de Regulación y Control Fito y Zoosanitario – Agrocalidad. They attend case notifications in the different Ecuador and Animal Health Coordination provinces because they manage animal health processes to increase animal health standards in the country.
REFERENCES
1 Ansari MY, Ahmad A, Khan SS, Bhushan G, Mainuddin. Spatiotemporal clustering: a review. Artif Intell Rev 2020; 53: 2381–2423.
2 Letchworth GJ, Rodriguez LL. Review Vesicular Stomatitis. Control 1999; : 239–260.
3 McCluskey BJ. Vesicular Stomatitis. Second Edi. Elsevier Inc., 2013 doi:10.1016/B978-1-4557-0891-8.00024-5.
4 SHIC. Swine Health Information Center, Vesicular Stomatitis Virus. Encycl Virol 2015; : 291–299.
5 Rozo-Lopez P, Drolet BS, Londoño-Renteria B. Vesicular stomatitis virus transmission: A comparison of incriminated vectors. Insects 2018; 9: 1–16.
6 Jr JLR, Mead D, Rodriguez LL, Brown CC. Transmission and pathogenesis of vesicular stomatitis viruses. Brazilian J Vet Pathol 2009; 2: 49–58.
7 APHIS. Animal and Plant Health Inspection Service, Vesicular Stomatitis. US Dep Agric 2012; : 2.
8 Cornish TE, Stallknecht DE, Brown CC, Seal BS, Howerth EW. Pathogenesis of Experimental Vesicular Stomatitis Virus (New Jersey Serotype) Infection in the Deer Mouse (Peromyscus maniculatus). Vet Pathol 2001; 38: 396–406.
9 MacLachlan NJ, Dubovi EJ. Chapter 18 – Rhabdoviridae. Fenner's Vet Virol 2017; : 357–372.
10 Veterinary N, Program A. Module 5 : Vesicular Diseases. 2014.
11 McCluskey BJ, Pelzel-McCluskey AM, Creekmore L, Schiltz J. Vesicular stomatitis outbreak in the southwestern United States, 2012. J Vet Diagnostic Investig 2013; 25: 608–613.
12 Timoney P. Vesicular stomatitis. Vet Rec 2016; 179: 119–120.
13 رسولی چ. No Titleرساله ی دکتری دانشگاه شهید بهشتی. .
14 Shi Z, Pun-Cheng LSC. Spatiotemporal data clustering: A survey of methods. ISPRS Int J Geo-Information 2019; 8. doi:10.3390/ijgi8030112.
15 Rodriguez LL, Vernon S, Morales AI, Letchworth GJ. Serological Monitoring of Vesicular Stomatitis New Jersey Virus in Enzootic Regions of Costa Rica. Am J Trop Med Hyg 1990; 42: 272–281.
16 Hanson RP. The natural history of vesicular stomatitis. Bacteriol Rev 1952; 16: 179–204.
17 Arroyo M, Perez AM, Rodriguez LL. Characterization of the temporal and spatial distribution and reproductive ratio of vesicular stomatitis outbreaks in Mexico in 2008. Am J Vet Res 2011; 72: 233–238.
18 Rodriguez LL, Bunch TA, Fraire M, Llewellyn ZN. Re-emergence of vesicular stomatitis in the western United States is associated with distinct viral genetic lineages. Virology 2000; 271: 171–181.
19 Rodríguez LL, Fitch WM, Nichol ST. Ecological factors rather than temporal factors dominate the evolution of vesicular stomatitis virus. Proc Natl Acad Sci U S A 1996; 93: 13030–13035.
20 Stallknecht DE, Nettles VF, Fletcher WO, Erickson GA. Enzootic Vesicular stomatitis New Jersey Type in an insular feral swine population. Am J Epidemiol 1985; 122: 876–883.
21 Nettles VF, Comer JA, Erickson GA, Corn JL. Isolation of Vesicular Stomatitis Virus New Jersey Serotype from Phlebotomine Sand Flies in Georgia. Am J Trop Med Hyg 1990; 42: 476–482.
22 Tesh RB, Chaniotis BN, Johnson KM. Vesicular Stomatitis Virus (Indiana Serotype): Transovarial Transmission by Phlebotomine Sandflies. Science (80- ) 1972; 175: 1477–1479.
23 Alexander JB, Takaoka H, Eshita Y, Gomez EA, Hashiguchi Y. New records of phlebotomine sand flies (Diptera: Psychodidae) from Ecuador. Mem Inst Oswaldo Cruz 1992; 87: 123–130.
24 Cargnelutti JF, Olinda RG, Maia LA, de Aguiar GMN, Neto EGM, Simões S V.D. et al. Outbreaks of Vesicular stomatitis Alagoas virus in horses and cattle in northeastern Brazil. J Vet Diagnostic Investig 2014; 26: 788–794.
25 Vicente, A. Estupiñan, J. Rosenberg, F. da Silva, A. Dora J. Epidemiological Study of Vesicular stomatitis in South America. Ser Monogr Científicas y Técnicas - Pan Am Foot-and-Mouth Dis Cent 1986; 15: 1–107.
Received: 12 December 2020
Accepted: 22 February 2021
María Teresa Salinas1, Euclides José De La Torre2, Paola Katerine Moreno3, Andrés Alejandro Vaca4 and Rubén Alexander Maldonado5*
1 Laboratorio de Virología. Agencia de Regulación y Control Fito y Zoosanitario – Agrocalidad. Av. Eloy Alfaro y Federico González Suárez, Tumbaco, Pichincha, Ecuador
2 Dirección de Diagnóstico Animal. Agencia de Regulación y Control Fito y Zoosanitario – Agrocalidad. Av. Eloy Alfaro y Federico González Suárez, Tumbaco, Pichincha, Ecuador
Dirección de Control Zoosanitario. Agencia de Regulación y Control Fito y Zoosanitario – Agrocalidad. Av. Eloy Alfaro y Federico González Suárez, Tumbaco, Pichincha, Ecuador
4 Dirección de Control Zoosanitario. Agencia de Regulación y Control Fito y Zoosanitario – Agrocalidad. Av. Eloy Alfaro y Federico González Suárez, Tumbaco, Pichincha, Ecuador
5 Laboratorio de Cultivo Celular. Agencia de Regulación y Control Fito y Zoosanitario – Agrocalidad. Av. Eloy Alfaro y Federico González Suárez, Tumbaco, Pichincha, Ecuador
Corresponding author: Rubén Alexander Maldonado [email protected]