2023.08.03.124
Files > Volume 8 > Vol 8 No 3 2023 > Diyala 3
Assessment of pollution with some heavy metals in agricultural soils near Qayyarah oil fields, southern Mosul

Ibrahim Mahmoud Ibrahim 1*, Khaled A. Khaled 2 and Moath Abdullah 3
1 Soil Sciences and Water Resources Dept., College of Agriculture and Forestry, University of Mosul, Iraq
2 Soil Sciences and Water Resources Dept., College of Agriculture and Forestry, University of Mosul, Iraq
* Correspondence: [email protected].
Available from. http://dx.doi.org/10.21931/RB/2023.08.03.124
ABSTRACT
To assess soil contamination in the Qayyarah sub-district of Nineveh Governorate with elements (Pb, Cr and Ni), the study area was divided into three areas depending on the distance of the land from the oil fields. The results showed an increase in the total concentration of heavy metals, Ni in all locations exceeded the maximum permissible limit of 50 mg.kg-1 according to WHO (World Health Organization) and FAO (Food and Agriculture Organization), which ranged in concentration (61.15 - 221.4) mg.kg-1. While the total soil content of pb ranged between (32.33 - 103.88) mg.kg-1, location (2) exceeded the maximum permissible limit in the soil of (100)mg.kg-1.The total Cr content ranged between (17.76 - 71.08) mg.kg-1. Enrichment factors pb, Cr and Ni ranged from (1-2.8)(0.8-2.7) and (1.8-4.2), respectively, in the surface soils affected by residues oil field when compared with the control soil CS 16. It was found through the spatial distribution that the concentrations of Lead were the highest in the soils of region A, which are located inside the oil fields. They decrease as we move away from the polluted source, specifically in areas B and C, and this confirms the role of liquid, solid and gaseous oil residues thrown from those oil wells to those soils and agricultural lands, which caused an increase in the total content of Lead. Chromium was found to have a different soca from Lead, and the highest concentrations appeared in the C region, far from the oil fields, with slight variation from the A and B regions. The results of the spatial distribution of Nickel also showed that it had a similar behavior to Chromium. Significant increases in concentration were shown in the soils of area C, which reinforces the assertion that the geological structure of the study area had an impact on the high values of Nickel and Chromium, particularly in the areas far from the oil fields. The results of the correlation analysis showed a significant negative relationship between the studied heavy metals with sand and a positive correlation with clay. The effect of this relationship was shown in Site 3, which is located within Zone A, which showed low concentrations of heavy metals due to the nature of its sandy texture, in addition to an essential positive relationship between heavy minerals, which confirms that it resulted from the same pollutant source.
Keywords: heavy metals, Pollution, Soils
INTRODUCTION
Soil pollution refers to any chemical substance in soil that exceeds normal levels that causes adverse effects on plant growth as well as on animal and human health through its entry into the food chain and its impact on soil quality and the entire ecosystem 1, presence some pollutants may also lead to nutrient imbalances and soil acidification, which are important issues in many countries 2; therefore it is a chemical degradation causes a partial or complete loss of soil functions. Soil productivity is affected, as well as the organisms in polluted soil; when these pollutants exceed the permitted levels, the soil becomes functionally dead, adversely affecting the growth of plants in those soils 3, and soil is the central basin for those pollutants emitted by environment 4.
Due to the rapid economic development and severe industrial activities, pollutants are considered one of the most critical human problems in the world, especially in recent years, which has high levels of pollutants are released, which led to their accumulation in the soil, which reached alarming levels 5, Therefore, some locations near the oil manufacturers have become contaminated by the distinctive activities of these businesses and their organic and inorganic pollutants, including heavy metals 6, Soil pollution with heavy metals is a serious global environmental issue and not less dangerous than water and air pollution because it harms the plant growth and adversely affects on soil microbial processes through its harmful effects on soil microorganisms such as bacteria, earthworms and other soil organisms that live in the soil 7, Whereas, high concentrations of heavy metals lead to a significant inhibition of soil respiration, because the severe pollution of heavy metals weakens soil microbial activity, which poses a serious threat to the function of the soil ecosystem 8, Also Soil contamination is directly related to the soil physical properties. Therefore, In highly contaminated soils, surface hardening processes take place that increase soil bulk density, degrade soil porosity, and significantly reduce water permeability 9; as a result of this adverse effect, many countries around the world have adopted national soil protection and pollution treatment regulations, and research on soil pollution assessment and treatment has increased 10.
Qayyarah is an Iraqi town located south of the city of Mosul. It is characterized by the presence of many oil fields nearby as it contains large oil reserves, which led to attracting many international private investing companies to explore for oil, in addition to the presence of an oil refinery in it, and because of the lack of commitment of these companies operating in The field of the oil industry and the lack of respect for the environment, which led to significant pollution of the soil and air as a result of the release of liquid waste into the soil without treatment, in addition to the burning of fuel and the release of gases into the atmosphere, which led to the deterioration of the soil system in particular by affecting the crops grown near the oil fields in These agricultural lands and the ecosystem in general. Therefore, the current study aims to assess the pollution with lead, chromium and nickel elements in those lands close to the oil fields and compare them with lands and soils far from the source of pollution by relying on the enrichment factor and some global determinants of the World Health Organization and the International Food and Agriculture Organization.
MATERIALS AND METHODS
Study Area
The study area is located 60 km southern of Mosul, which is represented by agricultural lands in Qayyarah district of Nineveh Governorate, which lines between longitudes (43°20'55.87"E-43°6'2.66" E) and latitudes (35°55'30.42"N - 35°34'36.56" N) (Figure 1), Where the study area was divided into three parts depending on the distance of the agricultural lands from the oil fields from all directions, part (A) represent lands close to the fields, which are located under the influence of solid, liquid and gaseous oil wast, at a distance of (400-800) m, (B) lands about (1500-2000) m away from center, and (C) area about (4000-5000) km from the oil fields. Because wind movement and direction play an essential role in the distribution of pollutants, in addition to the comparison sample (CS), located about 6000 m northeast of the oil fields, 16 surface soil samples are included at a depth of 0-30 cm. All soil samples were dried upon collection and sieved through with a diameter of (2) mm, thus becoming ready for the following physical and chemical analyses.
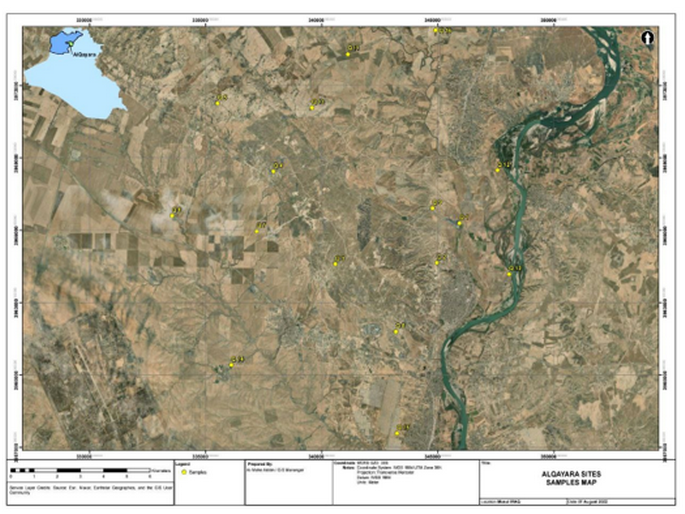
Figure 1. Study area in the Qayyarah district.
Soil Sampling and Analysis
Particle size distribution was determined using the hydrometer method 11, Soil pH was determined by a pH meter, Soil EC was determined by using the (EC meter), Organic matter and Calcium carbonate were determined according to the method by 12, Cations Exchange Capacity was determined according to the method by 13.
Determine Heavy Metals in soil.
Soil samples were digested using royal water (acidic method) 14 to estimate the total amount of heavy elements (Pb, Ni, Cr) in the soil. (2) gm of each soil sample was added to a conical flask with (15) ml of royal water consisting of a 3:1 ratio of hydrochloric and nitric acids and left for 24 hours. Then, it is heated for digestion to 120°C; after two to three hours of heating (when the color turns brown to colorless), leave the mixture to cool, then use Whatman filter paper and fill into 50 ml distilled water. Heavy metal concentrations in the extracts were estimated using a German-made Atomic Absorption Spectrophotometer, model Analytika jena 350A.
Enrichment Factor (EF)
The enrichment factor assesses soil pollution and seeks to know the natural or human inputs and their impact on the soil. The most common reference elements used in determining the EF value are Aluminum (Al), Tin (Sn), Iron (Fe), and Manganese (Mn) 15; in the current study, (Fe) was selected as a reference element because of its high concentration in study area soils, where Fe is stable in soil and is characterized by the absence of vertical movement within the soil. In addition, its concentration does not change in human terms 16. Enrichment factor values were calculated according to the following equation 17:
EF = (Cm/CFe)sample / (Cm/CFe)Background
where
(Cm sample)= Heavy metal Concentration in a soil sample.
(CFe sample) = Total Iron concentration in the same sample.
(Cm Background) = Heavy metal Concentration in comparison to soil.
(CFe Background) = Iron concentration in comparison to soil.
Seven categories have been identified to classify the results of the enrichment factor as described by 18, as shown in Table (1).
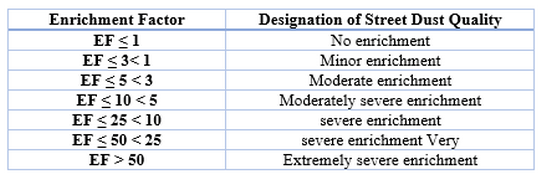
Table 1. Interpretation Levels of Enrichment Factor
RESULTS
The Physicochemical Properties of Soil
It is evident from Table 2 that the proportion of separated (clay, sand and silt) was different for the soil of the study area, as it ranged between (224.5-387) g.kg-1 for clay, and the percentage of silt ranged between (125-460) g.kg-1, while it was The sand ratio ranged between (212-603) g.kg-1, and the electrical conductivity EC values ranged between (0.6-8.6) ds.m-1. As for the pH values, they ranged between (7.38-7.92), and the results showed that the organic matter ranged between (6.87-20.63) g.kg-1. The content of the soils of the study area of calcium carbonate ranged between (45-370) g.kg-1. The results show that the cation exchange capacity of CEC was between (9.56-23.48) centimole (+).kg-1.
Total Content of Heavy Metals
When heavy metals are found in large quantities in soil, this may be due to the accumulation of chemicals containing heavy metals that are discharged into the soil due to oil exploration and production activities 19.Table .3
The results of Table 3 indicate that the concentrations of the total content of Lead in the study soils ranged between (32.33-103.88) mg.kg-1, and it is clear from Figure 1 that the highest values of Lead were in the sites located within Zone A close to the source of pollution, specifically Sample 2 (Q2), then the concentrations start decreasing gradually as we move away from the oil fields in areas B and C until it reaches the lowest value of Lead in the control soil CS, while the results showed that the total chromium concentrations ranged between (19,56-71.08) mg.kg-1, and Figure 2 shows that there is a discrepancy in the total chromium concentration of the studied sites between highs and lows within one region, as the results showed varying concentrations within region A, where the lowest value of Chromium was recorded in sample 3 (Q3), then return to To rise in sites belonging to region B and C with a little difference from region A, as for Nickel, the results of the total content indicated that it ranged between (54,2-221,4) mg.kg-1, and it was shown by Figure 2 that the variation in the total content of Nickel in the soil It was clear and the highest values were in the southeastern part of the study area within area A, specifically in sample 2, while in sample 3 It decreases suddenly, but in areas B and C it rises again significantly, precisely sample 12 and 13.
The results were less than what 20 found, which indicated an increase in total lead concentration in agricultural soils in Baghdad Governorate, which ranged between (56.73- 714.87) mg kg-1 and attributed this to the power stations' impact and oil facilities such as Aldora Refinery, and higher than the results reached by 21 in agricultural soils close to industrial facilities as a result of the waste they pose and decrease the farther away from the source of pollution, as they noted an increase in lead concentrations, which ranged between (9.6 - 44.79) ) mg kg-1
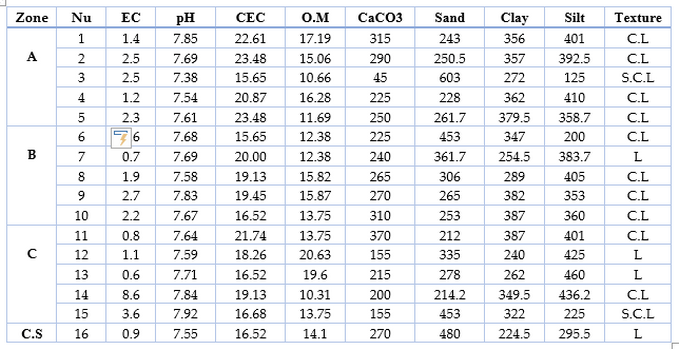
Table 2. Physical and chemical properties of the studied soil
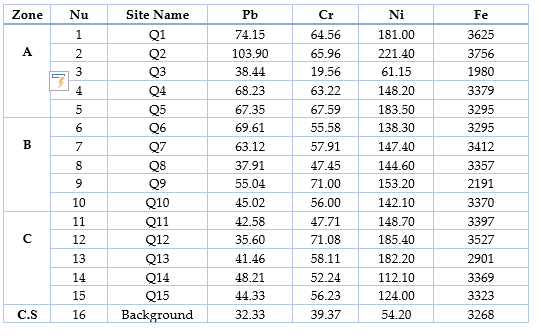
Table 3. Heavy metal analysis of study soils (mg.kg-1)
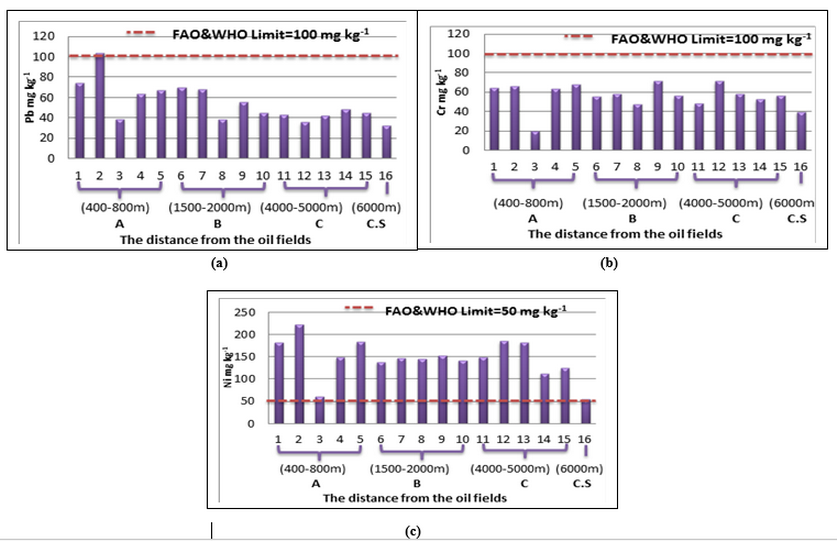
Figure 2. (a) Total content of Lead in the studied soils; (b) Total chromium content in the studied soils; (c) The total nickel content in the studied soils.
The enrichment factor was calculated from the concentration of heavy metals in 15 samples surrounding the oil fields of the study area, and the concentration of heavy metals in sample 16 (comparison soil) was used as a standard concentration to assess the contamination with heavy metals for those soils 22.
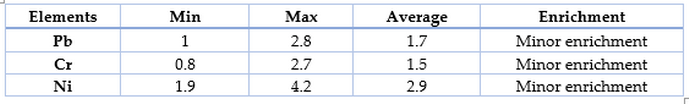
Table 4. Higher, lower value and enrichment factor rate for heavy elements in the study soils.
The results indicate that the values of the enrichment factor for heavy metal pollution are different for the study area soil. The average values increase in the order Ni > Pb > Cr, where the values for Lead ranged between (1 - 2.8) and fall within the range of little enrichment 1> EF>3, and ranged between (0.8 - 2.7) for Chromium which also falls within the range of little enrichment 1> EF>3 except for site 3 it was low within the range of no enrichment EF < 1, while Nickel ranged between (1.9 - 4.2), where most of it falls within low enrichment range 1> EF>3 except for samples 1, 2, 5, 9, 12 and 13 that were within the moderate enrichment range 3> EF>5 according to 18, usually when the value of the enrichment factor is close to or less than 1, this reflect that the primary source of heavy metals is from a natural source. Still, if the enrichment factor exceeds 1, the primary source is human activities 23. Some opinions suggest that enrichment factor values of 1.5 or more indicate human influence, which was determined by 24. According to this suggestion, the sources of heavy metals are considered human in most of the study's soil sites, and what confirms this is the spatial variation of the EF values, which exceeded the critical limit mentioned by 24.
Figure (3) shows that the highest values of Lead were in samples close to the oil fields, precisely samples 1, 2, 3, 4, 5, 6, 7 and 9, which exceeded the critical limit (1.5). For Chromium, the enrichment factor values in samples 1, 2, 4, 5, 9, 12 and 13 were greater or equal to (1.5). However, Nickel shows a significant increase in enrichment factor values, as the values of the enrichment factor in all the 24 study soil sites exceeded the critical value of 1.5, where it reached 4.2.
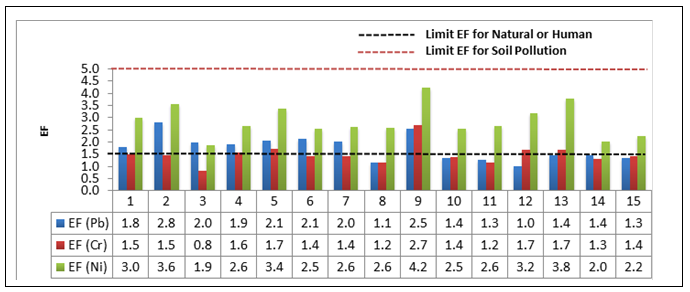
Figure 3. Enrichment factor value for Lead, Chromium and Nickel.
Correlation Matrix
Describe the relationship between the total concentrations of heavy metals and the physical and chemical properties of the soil. It was done by the Pearson correlation coefficient Table 4.
**. Correlation is significant at the 0.01 level (2-tailed).
*. Correlation is significant at the 0.05 level (2-tailed).
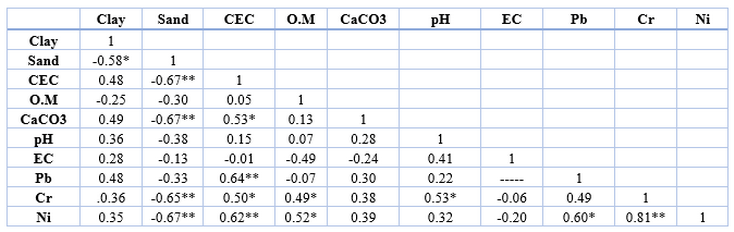
Table 5. Pearson correlation matrix between heavy metals and the chemical and physical properties of the soils of the study area.
The results showed a significant positive correlation between Lead and CEC (0.64**), and a weak positive correlation with clay (0.47), CaCO3 (0.30) and pH (0,22), with a negative correlation of Lead with sand ( -0.33) and organic matter (-0.07), while Chromium showed a significant positive correlation with CEC (0,50*), organic matter (0.49*), pH (0,53*), and a weak positive correlation with clay (0.36) and CaCO3 (0.38), while the correlation of Chromium with sand was significantly negative (-0.65**), and the results showed a significant positive correlation of Nickel with CEC (0,62**) and organic matter (0,52*). Moreover, there was a weak positive correlation with clay (0.35), CaCO3 (0.39) and pH (0.32), while the correlation of Nickel with sand was a significant negative correlation (-0.67**).
The relationship between heavy metals was evaluated to determine the common source of these elements in the study area. It was found that there were significant positive correlations between heavy metals, as Lead showed a significant positive correlation with nickel (0.60*). The relationship between Chromium and Nickel also showed a significant positive correlation (0,81**), but it was a weak positive between Lead and Chromium (0,49).
DISCUSSION
Discussion of the Chemical Properties of Soil
It is clear from these results that most of the soils are average soils whose salinity was (less than 4) dSm -1, with an increase in electrical conductivity in sample 14 observations whose conductivity values exceeded 4 dSm -1; they appear as saline for plates 25. This results from several factors, the most important of which are low rainfall, high surface evaporation, weathering of salt rocks, saline irrigation, and poor agricultural practices 26, indicating that the study area soils were of a neutral to slightly alkaline reaction degree. The reason for the high degree of soil interaction is due to the nature of the soil formation conditions in terms of climate and the origin material rich in calcium carbonate, as the presence of carbonates affects the degree of soil interaction, as carbonate soil is characterized by having a pH greater than 7 27. It is clear that there is a discrepancy in the values of the organic matter between the soils, and in general, it appears that there is a decrease in the values of the organic matter in all soils due to the nature of the dry climatic conditions, with the exposure of these Areas of lower rainfall and higher temperatures result in less input of organic matter and nutrients from external sources 28. The reason for the high values of calcium carbonate in most of the sites may be attributed to the fact that the nature of the origin material for the soils of the study area is mainly rich in calcium carbonate, which is also due to the geological formations of these The area, which was rich in these carbonate minerals, and the lack of rainfall It works on the accumulation of calcium carbonate in the sub-surface horizons 29. The cation exchange capacity (CEC) is one of the essential properties of soil and a primary criterion for its quality and the ability to remove environmental pollution, which affects the adsorption of heavy elements such as copper, zinc and lead 30.
Heavy Metals Content and Soil Pollution.
The highest Lead concentrations were in the sites located within the (A) area close to the source of pollution, where it was highest in Sample 2 (Q2); the reason for the high lead concentration due to its proximity to the oil fields and resulting from the solid, liquid and gaseous wastes that have contaminated these soils and agricultural land near oil wells, and the alkaline pH depositing Lead in the arable soil layers in carbonate and phosphates form at pH greater than 6.5. Thirty-one indicates that Lead is significantly associated with organic matter and metal oxides at 26 % of the total amount.
The results show a discrepancy in the total concentration of Lead for all sites in the study area, as we notice a significant decrease in lead values for some samples in (A) part. Despite their proximity to the oil fields, the sample (Q3), which is located to the west of the oil fields, compared to the rest of the samples located at the same distance as the polluting source; this is due to its low content of clay and organic matter, which catch and fixation lead and the rest of the heavy metals. On the other hand, it has a high content of sand, as the clay soil retains a high amount of heavy metals compared to sandy soil 32. The results obtained showed that all samples are considered to have a high concentration of Lead. However, they are within the permitted limits in the soil, except for sample Q2, which exceeded the maximum limit of (100) mg kg-1 according to the WHO and the FAO 33.
The result Chromium there was a variation in the study area, as the highest concentration appeared in (C) Area, which is 3 km away from the oil fields, precisely sample 12. which is explained by the wind speed and direction, which works to transfer pollutants and their Chromium from the source of pollution to further areas and then are deposited on the surface of the soil in those locations, as weather conditions play an essential role in the distribution of heavy metals in the air 34. Alternatively, it is due to the original material, since soil chromium is inherited from the mother rocks, as the chromium content increases in soils formed from mafic rocks and stone sediments 35. Thirty-six noted that the increase of Chromium in Iraqi soils resulted from the transfer of calcareous deposits from weathering processes in northern and northeastern Iraq. The lowest concentration of total Chromium is upper in the sample (3) despite its proximity to the source of pollution due to the low percentage of clay and the prevalence of sand, as sandy soils have a weak ability to adsorb heavy elements 37. According to 33, the results of the total chromium content in all sites are considered within the permitted limits in soil, which is less than 100 mg kg-1, which are approved by standard regulatory bodies such as (WHO) and (FAO), which do not cause risks to Soil and plant system.
The spatial distribution of high nickel concentrations may be associated with oil combustion and agricultural activities such as phosphate fertilizers 38, as the variation in the total nickel content was apparent. The highest values were in the southeastern part of the study area, where the highest concentrations in sample 2 (Qayyarah 39), due to their proximity to the oil fields and solid, liquid and gaseous wastes posed by these oil wells, in addition to their high content of clay. The other far locations, specifically (Q12 and Q13), which are located in the same direction, were also highly concentration due to the predominance of northwest winds in the region, which transfer these pollutants and the elements they contain and deposit them in those sites. Ni can be released into the atmosphere through industrial activities, accumulating on the surface after precipitation reactions 39. All sites exceeded the maximum allowable limit for nickel components set by the World Health Organization and the Food and Agriculture Organization of (50) mg kg-1, which threatens the soil, plants and human system 40.
Nickei, it has been found that there is a noticeable increase in the total content of Nickel in most locations compared to the rest of the heavy metals due to the high ability of Nickel to adsorb on The surfaces of clay minerals, as clays have a high cation exchange capacity and therefore have a more remarkable ability to stabilize heavy metals 38, Montmorillonite is the dominant mineral in arid and semi-arid region. It may also be attributed to increased sediments and fragments transported from the northern and northeastern regions, which contain pyroxene, olefin and chlorite minerals rich in Nickel.
These high values of Lead, Chromium and Nickel in the areas mentioned above are an explicit confirmation of human activity, which means that the enrichment of these elements results from industrial inputs such as liquid oil residues that flow from those oil wells or emissions of pollutants into the air, This is due to the burning operations of the oil wells that enriched the soils of the region, especially the nearby ones, with heavy elements as a result of smoke and ash emitted from it and the mineral and organic pollutants it contain, which eventually reach the soils of the neighboring lands either through sedimentation or by rain.
It appears in the rest of the locations that the values of the enrichment factor for Lead and Chromium decreased below 1.5 until it reached the lowest value of Chromium, which is 0.8 in sample 3 (Fig. 1), due to the total chromium concentration at that point was slightly due to the nature of the sandy texture poor in clay minerals,
It facilitates the movement and washing of heavy elements and thus reduces their amounts in soil, as well as the calculation of the enrichment factor index with the total iron concentration; whenever the Iron content is high, there is a decrease in enrichment factor 21.
The close positive correlations between heavy metals, which emerged through Pearson correlation analysis, indicate that heavy metals may be produced from the same polluting source, which in our study represents oil fields 41, where the wind works to transfer gaseous emissions containing these heavy metals to agricultural lands. Near the oil fields, which led to an increase in the total content in the soil, and the geological composition of the area may contribute to the rise in the total concentration of Nickel and chromium elements, especially in places far from pollution sources (oil fields) 42.
CONCLUSIONS
The region's soil was contaminated with Nickel, as it exceeded the maximum allowable limit according to FAO and WHO. The Lead and Chromium concentrations in soils were within the permitted extent, except in sample 2 (Qiyarat 39), where Lead exceeded the upper limit allowed in the soil. The values of the enrichment factor explain that the enrichment of these heavy metals results from industrial inputs such as oil residues and emissions of pollutants into the air, which are deposited on agricultural lands adjacent to the polluted source.
REFERENCES
1. Gholizadeh A, Saberioon M, Ben-Dor E, Borůvka L. Monitoring of selected soil contaminants using proximal and remote sensing techniques: Background, state-of-the-art and future perspectives. Crit Rev Environ Sci Technol. 2018;48(3):243-278.
2. ITPS FAO. Status of the world's soil resources (SWSR)—Main report. Food Agric Organ United Nations Intergov Tech Panel Soils. Published online 2015:650.
3. Stolte J, Tesfai M, Oygarden L, et al. Soil Threats in Europe: Status, Methods, Drivers and Effects on Ecosystem Services: Deliverable 2.1 RECARE Project. European Commission DG Joint Research Centre; 2016.
4. Banat KM, Howari FM, Al-Hamad AA. Heavy Metals in urban soils of central Jordan: should we worry about their environmental risks? Environ Res. 2005;97(3):258-273.
5. Cachada A, Rocha-Santos T, Duarte AC. Soil and pollution: an introduction to the main issues. In: Soil Pollution. Elsevier; 2018:1-28.
6. Al-Rawi, K. F.; Ali, H. H.; Guma, M. A.; Alaaraji, S. F. T.; Awad, M. M. The Relationships of Interleukin-33, Ve-Cadherin and Other Physiological Parameters in Male Patients with Rheumatoid Arthritis. Pertanika J Sci Technol 2022, 30 (1), 123–140.
7. Panneerselvam P, Mitra D, Mohanty B, Mondal R, Shadangi S. Soil pollution and their impact on soil microorganisms. They were published online 2022.
8. Shahid M, Dumat C, Khalid S, Schreck E, Xiong T, Niazi NK. Foliar heavy metal uptake, toxicity and detoxification in plants: A comparison of foliar and root metal uptake. J Hazard Mater. 2017;325:36-58.
9. Kalandadze B, Matchavariani L. Soil pollution. In: The Soils of Georgia. Springer; 2019:153-166.
10. UNEP FAO. Global Assessment of Soil Pollution—Summary for Policy Makers. Published online 2021.
11. Gee, G.W.; Bauder, J.W. Particle size analysis. In Methods of Soil Analysis. Part 1. Physical and Mineralogical Methods; Klute, A., Ed.; American Society of Agronomy and Soil Science Society of America: Madison, WI, 1986; 383–409.
12. Jackson ML. Soil chemical analysis prentice Hall. Inc, Englewood Cliffs, NJ. 1958;498:183-204.
13. Page AL, Miller RH, Keeny DR. Methods of Soil analysis part (2) 2nd (ed). Agronomy 9. Amer Soc Agron Madison Wisconsin Papanicolaou, EP (1976) Determ cation Exch Capacit calcareous soils their percent base Satur soil Sci. 1982;121:67-71.
14. Yuswir NS, Praveena SM, Aris AZ, Ismail SNS, Hashim Z. Health risk assessment of heavy metal in urban surface soil (Klang District, Malaysia). Bull Environ Contam Toxicol. 2015;95(1):80-89.
15. Janadeleh H, Jahangiri S, Kameli MA. Assessment of heavy metal pollution and ecological risk in marine sediments (A case study: Persian Gulf). Hum Ecol Risk Assess An Int J. 2018;24(8):2265-2274.
16. Aguilar Pesantes A, Peña Carpio E, Vitvar T, María Mahamud López M, Menéndez-Aguado JM. A Multi-Index Analysis Approach to Heavy Metal Pollution Assessment in River Sediments in the Ponce Enríquez Area, Ecuador. Water. 2019;11(3):590.
17. Adamu S, Ayuba M, Murtala A, Uriah LA. Assessment of potentially toxic metals in soil and sediments of the Keana Brinefield in the Middle Benue Trough, North central Nigeria. Am J Environ Prot. Published online 2014. 3(6-2):77-88.
18. Kamani H, Mirzaei N, Ghaderpoori M, Bazrafshan E, Rezaei S, Mahvi AH. Concentration and ecological risk of heavy metal in street dusts of Eslamshahr, Iran. Hum Ecol risk Assess an Int J. 2018;24(4):961-970.
19. Hussain Qaiser MS, Ahmad I, Ahmad SR, Afzal M, Qayyum A. Assessing Heavy Metal Contamination in Oil and Gas Well Drilling Waste and Soil in Pakistan. Polish J Environ Stud. 2019;28(2).
20. Abdulateef AA, Naser KM. Evaluation of Pollution of the Soils and Plants of Baghdad Governorate with the Elements of Lead and Cadmium. iraqi J soil Sci. 2019;19(1).
21. Abbas AK, Al-Jubouri HHR. Evaluation of pollution parameters by Lead, Nickel and Cadmium as a result of the industrial wastes of the Al-Forat for chemicals and Cement Al Sadda factories in Agricultural Soil of Babylon Province. iraqi J soil Sci. 2018;18(1).
22. Singovszka E, Balintova M. Enrichment Factor and geo-accumulation index of trace metals in sediments in the river Hornad, Slovakia. In: IOP Conference Series: Earth and Environmental Science. Vol 222. IOP Publishing; 2019:12023.
23. Jahan S, Strezov V. Comparison of pollution indices for the assessment of heavy metals in the sediments of seaports of NSW, Australia. Mar Pollut Bull. 2018;128:295-306.
24. Birch GF, Olmos MA. Sediment-bound heavy metals as indicators of human influence and biological risk in coastal water bodies. ICES J Mar Sci. 2008;65(8):1407-1413.
25. Shrivastava P, Kumar R. Soil salinity: A serious environmental issue and plant growth promoting bacteria as one of the tools for its alleviation. Saudi J Biol Sci. 2015;22(2):123-131.
26. Hussain S, Shaukat M, Ashraf M, Zhu C, Jin Q, Zhang J. Salinity stress in arid and semi-arid climates: Effects and management in field crops. Clim Chang Agric. 2019;13.
27. Drouet T. Pédologie. BING-F-302 Edition. Lagev. http://www.geologues-prospecteurs.fr/cours/pedologie/pe-dologie-1. 2010; 140 p.
28. Hag Husein H, Lucke B, Bäumler R, Sahwan W. A Contribution to Soil Fertility Assessment for Arid and Semi-Arid Lands. Soil Syst. 2021;5(3):42.
29. Taalab AS, Ageeb GW, Siam HS, Mahmoud SA. Some Characteristics of Calcareous soils. A review AS Taalab1, GW Ageeb2, Hanan S. Siam1 and Safaa A. Mahmoud1. Middle East J. 2019;8(1):96-105.
30. Liao KH, Xu SH, Wu JC, Ji SH, Qing LIN. Cokriging of soil cation exchange capacity using the first principal component derived from soil physico-chemical properties. Agric Sci China. 2011;10(8):1246-1253.
31. Yobouet YA, Adouby K, Trokourey A, Yao B. Cadmium, copper, lead and zinc speciation in contaminated soils. Int J Eng Sci Technol. 2010;2(5):802-812.
32. Pikuła D, Stępień W. Effect of the degree of soil contamination with heavy metals on their mobility in the soil profile in a microplot experiment. Agronomy. 2021;11(5):878.
33. Chiroma TM, Ebewele RO, Hymore FK. Comparative assessment of heavy metal levels in soil, vegetables and urban grey waste water used for irrigation in Yola and Kano. Int Ref J Eng Sci. 2014;3(2):1-9.
34. S. M. Abdulateef, O. K. Atalla1, M. Q. A L-Ani, TH. T Mohammed, F M Abdulateef And O. M. Abdulmajeed. Impact of the electric shock on the embryonic development and physiological traits in chicks embryo. Indian Journal of Animal Sciences.2021, 90 (11): 1541–1545.
35. Mohammed MS, Abdullah EJ. Heavy metals pollution assessment of the soil in the northern site of east Baghdad oil field, Iraq. Iraqi J Sci. 2016;57(1A):175-183.
36. Mahmoud, A.; Khudair , M. Y. . Evaluation Of Al Kabeer Al Shamali River's Water Suitability For Drinking, Based On Modeling And Pseudomonas Aeruginosa Detection In Syria. JLSAR 2023, 4, 9-29.
37. Alamgir M. The effects of soil properties to the extent of soil contamination with metals. In: Environmental Remediation Technologies for Metal-Contaminated Soils. Springer; 2016:1-19.
38. Bibani, N. M. S., Khidhir, Z. K., Shaker, A. S., Kirkuki, S. M. S. & Abdulateef, S. M. Analyses of mycotoxins in broiler's local and imported feeds. Iraqi J. Vet.2019 Sci. 33.
39. Kabata-Pendias A, Mukherjee AB. ; Trace elements from soil to human. Springer-Verlag Berlin Heidelberg; 2007; pp:561.
40. Iyama WA, Okpara K, Techato K. Assessment of Heavy Metals in Agricultural Soils and Plant (Vernonia amygdalina Delile) in Port Harcourt Metropolis, Nigeria. Agriculture. 2021;12(1):27.
41. Zhang S, Liu Y, Yang Y, et al. Trace elements in soils of a typical industrial district in Ningxia, northwest China: Pollution, source, and risk evaluation. Sustainability. 2020;12(5):1868.
42. BAYRAKLI B, Dengiz O. Determination of heavy metal risk and their enrichment factor in intensive cultivated soils of Tokat Province. Eurasian J Soil Sci. 2019;8(3):249-256.
Received: 25 June 2023/ Accepted: 26 August 2023 / Published:15 September 2023
Citation: Ibrahim, I.M.; Khaled, K.A.; Abdullah, M. As-sessment of pollution with some heavy metals in agricultural soils near Qayyarah oil fields, southern of Mo-sul. Revis Bionatura 2023;8 (3) 124 http://dx.doi.org/10.21931/RB/2023.08.03.124