2021.06.02.6
Files > Volume 6 > Vol 6 No 4 2021 > Vol 6 No 2 2021
INVESTIGATION / RESEARCH
Assessing sugarcane brown rust resistance using Image analysis

Yaquelin Puchades-Izaguirre 1, Mónica Tamayo-Isaac 2, Wilfre Abiche-Maceo 3, Reynaldo Rodríguez-Gross 4, María La O-Hechavarría 5, Mérida L. Rodríguez-Regal 6
Available from: http://dx.doi.org/10.21931/RB/2021.06.02.6
ABSTRACT
Image analysis provides an accurate and precise method of pest evaluation. This work's objective was to compare the usefulness of the ImageJ® 1.43u image processor and visual estimation as methods to characterize brown rust lesions and estimate the resistance of new sugarcane cultivars. For this, leaves images of 10 cultivars were captured, and the parameters quantity, most regular size of the pustules, and leaf area affected were determined. The data were correlated with the eight control (standard) genotypes' evaluations to obtain a classification of disease resistance. The results showed that the software's determinations were the most accurate, although all the methods were reliable for rating the reaction to brown rust. Therefore, it is proposed to move away from visual disease assessment toward a system based on digital image analysis.
Keywords: sugarcane, brown rust resistance, Image analysis
INTRODUCTION
In-plant pathology, accurate assessments of pest severity are essential to breed resistant and less susceptible plant cultivars, classify or rate cultivar resistance, correlate lesions with yield losses, calculate damage thresholds, determine the efficacy of pesticides and perform reproducible experiments. Although visual disease estimates provide a relatively quick and easy method, they are prone to inaccuracy, leading to incorrect conclusions 1.
Image analysis provides a more accurate and precise method of disease evaluation than visual estimation. Many software can be used for processing and provide a measure of severity, for example, ImageJ® and MATLAB. These are mainly used to compute the affected leaf area and the characteristics of the symptoms (size, quantity, etc.) 2.
The ImageJ® 1.43u program 3 is a Java-based open-source image analysis and processing tool that contains numerous features applicable to the measurement of disease severity. It has been used 9) to quantify the development of the Aspergillus oryzae fungus 4; in the classification of insects 5; for morphological and morphometric characterization of Puccinia kuehnii (Krüger) 6, and in the identification of the symptoms of ringspot and orange rust of sugar cane 7; 8.
Brown rust from sugarcane is a disease widely distributed in most of the sugarcane areas of the world 9; 10. It is caused by the fungus Puccinia melanocephala Sydow & P. Sydow and is considered among the most important to the crop 11. It is characterized by linear pustules, reddish to dark brown, on the underside of the leaf, and the percentage of affected leaf area varies depending on the resistance that cultivars offer to the pathogen 12.
In Cuba, disease resistance is a criterion for the selection of new sugarcane cultivars. From the above derives the importance of keeping the strategies of its evaluation updated. The evaluation methodology was recently modified, and a new scale containing new quantitative criteria (area with pustules and more frequent length of the pustules) was proposed 13. The present work's objective was to compare the utility of the ImageJ® 1.43u image processor and visual estimation as methods to characterize brown rust lesions and to estimate the resistance of new sugar cane cultivars.
METHODS
Field experiment: The trial was established in September 2018 with 10 cultivars of the 2007 series (C07-593, C07-594, C07-595, C07-596, C07-597, C07-598, C07-599, C07- 600, C07-601 and C07-602) and controls representing different categories of brown rust infection: PR980 (highly resistant, AR), Ja64-11 (resistant, R), SP70-1284 (moderately resistant, MR) , C88-380 (moderately susceptible, MS), C334-64 (MS), C323-68 (susceptible, S), My5514 (S), Ja60-5 (highly susceptible, AS), and B4362 (very highly susceptible, MAS) 13. Controls are rating from 1 to 7 according to the different categories of brown rust infection from the most resistant to the most susceptible.
An experimental random block design with three replicates was used. Each experimental plot consisted of one row of 6 m in length with 1,6 m row spacing. As barriers of the experiments and every two cultivars, B4362 was planted to increase and homogenize the inoculum pressure.
Data collection: Evaluations were carried out between 3 and 5 months of age in the crop's plant cane cycle. In each plot, 2 cm2 images were taken of the middle third of the leaf +3 of 10 sugarcane stems (Figure 1) with a conventional digital camera. The variables: quantity (CPUST) and most frequent length of the brown rust pustules (LPUST) were determined by visual estimation and ImageJ® 1.43u software. Figure 2 presents an example of image processing and determination of study variables.
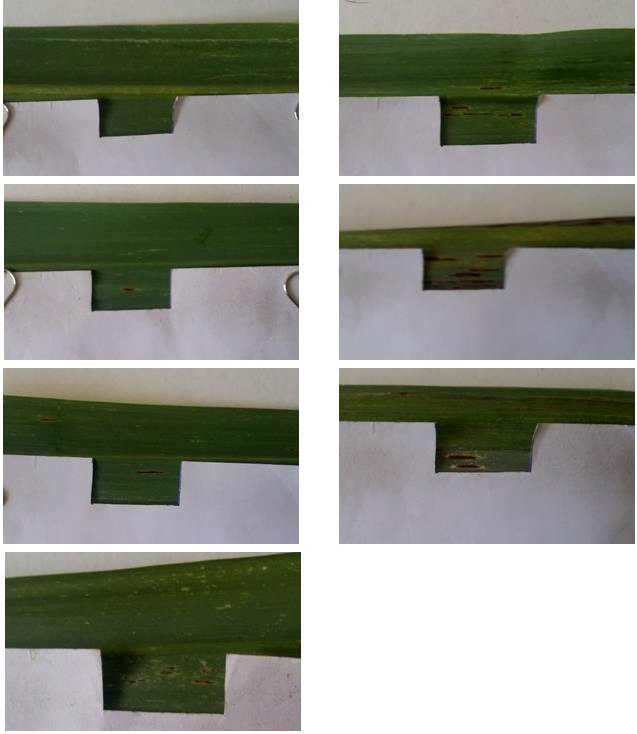
Figure 1. Images of 2 cm2 of the middle third of the +3 leaf of different sugarcane cultivars affected by brown rust. Sample images from our dataset.
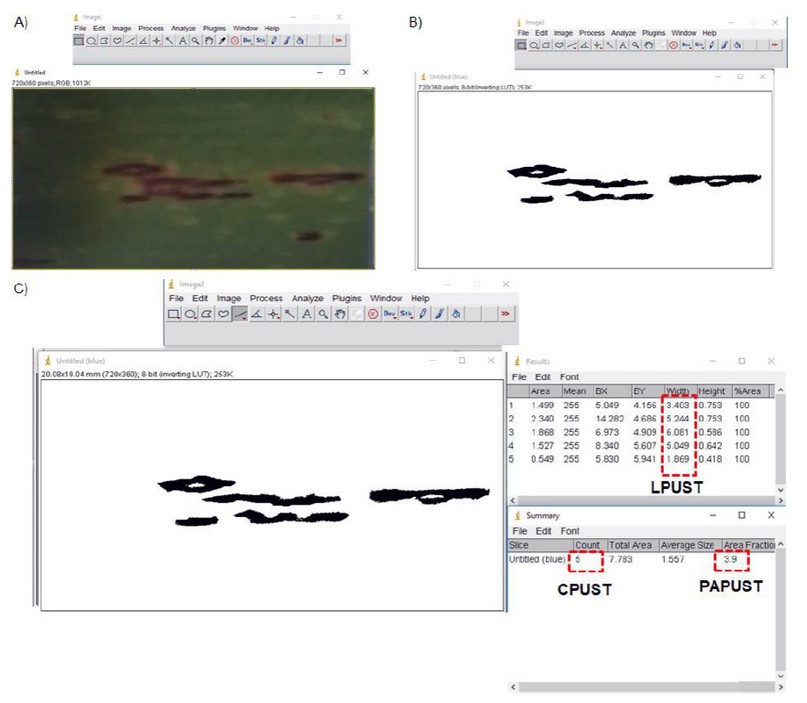
Figure 2. Example of image processing in ImageJ® 1.43u to determine the study variables (CPUST, LPUST y PAPUST). A) 2 cm2 original image, B) binary processed image, C) determination of variables quantity (CPUST), most frequent length of the pustules (LPUST) and percentage of affected leaf area (PAPUST).
Data analysis: The differences between the values of the CPUST and LPUST variables obtained through visual estimation and the ImageJ® 1.43u software were determined using factorial variance analysis and Tukey's multiple comparison test (p <0.05).
The percentage of affected leaf area (PAPUST) was calculated using the equation:
Pustules / cm2 (%) = PAPUST = (CPUST * LPUST * 0.38) / 2 13. Additionally, this variable was recorded directly by computation in the ImageJ® 1.43u software (Figure 2). The results of the PAPUST variable obtained from: (i) calculation with the visual estimation variables, (ii) calculation with the variables estimated by ImageJ® 1.43u, and (iii) direct computation of PAPUST by ImageJ® 1.43u were compared. The precision of the methods was estimated using the standard deviation, standard error, and repeatability statistics parameters.
The relationship between the percentage affected leaf area and the different rating degrees was verified by linear regression for the controls. The reliability of the results was determined using Pearson correlation between the means reported in the new methodology for brown rust evaluation 13 and those accounted for by the different methods used in the present work. The ratings of the new cultivars were calculated from the linear equations obtained in regression 14.
RESULTS AND DISCUSSION
The variance analysis verified that there are very significant differences between the values of the variables LPUST and CPUST obtained both by visual estimation and by image analysis. The differences between cultivars are determined by their differential response to brown rust (Table 1).
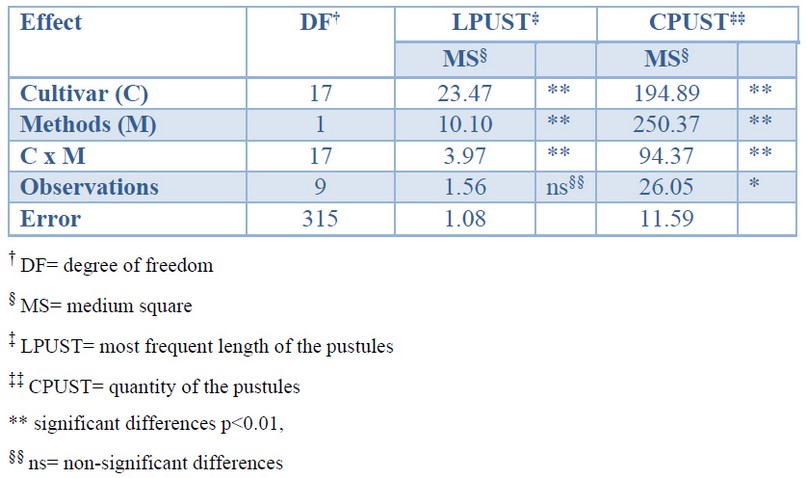
Table 1. Effect of determinations by visual estimation and image analysis on the quantity and most frequent length of the pustules in 18 sugarcane cultivar affected by brown rust.
The individual analysis observed fewer differences between the methods in determining the LPUST variable (Table 2). However, image processing measurements were more accurate based on a statistical analysis of standard deviation and standard error.
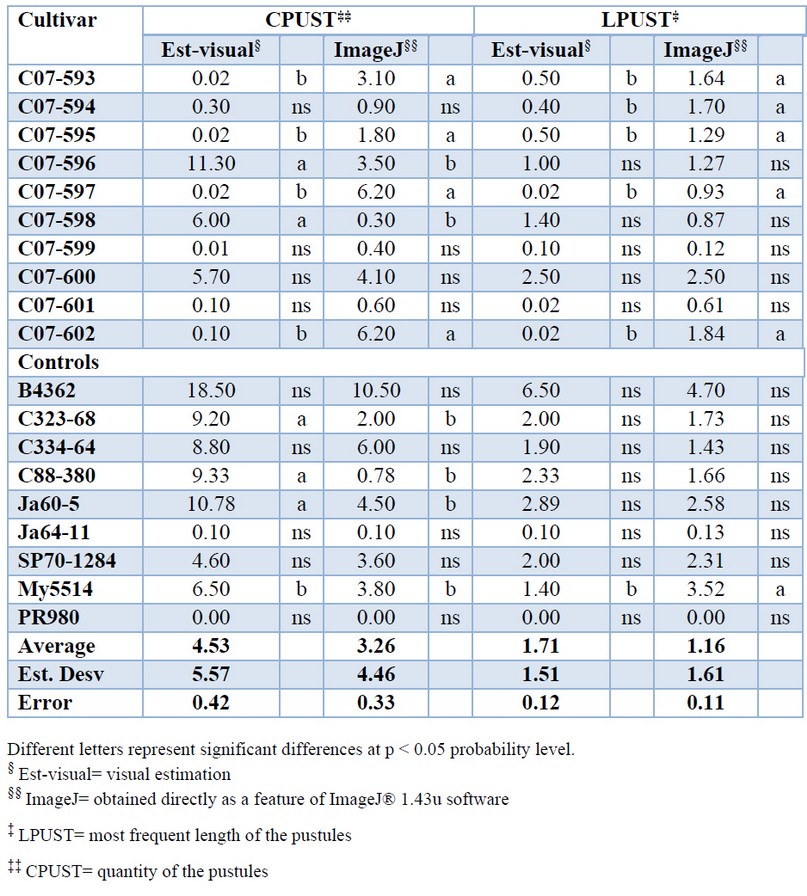
Table 2. Average values of quantity (CPUST) and most frequent length of the pustules (LPUST) in 18 sugarcane cultivar affected by brown rust
The comparison between the percentages of affected leaf area (PAPUST) calculated according different methods established very significant differences between cultivars and methods (Table 3). The determination of this variable is of great importance, and it is the basis of the new cultivar classification system due to the differential reaction of the sugarcane cultivars to brown rust.
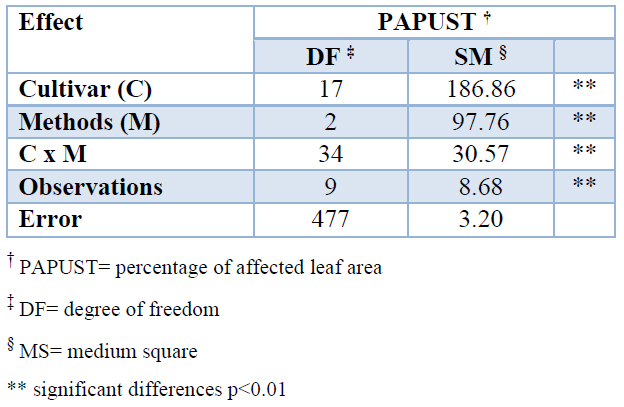
Table 3. Effect of the determinations by visual estimation and image analysis on the variable percentage of leaf area affected (PAPUST) by brown rust in 18 sugarcane cultivars.
More significant variability was observed in the PAPUST determinations made by visual estimation. The data offered directly by the ImageJ® 1.43u was more precise but very similar to that obtained when the CPUST and LPUST resulting of the software were used for the calculation. Repeatability confirmed the greater robustness of the determinations offered by ImageJ® 1.43u (Table 4).
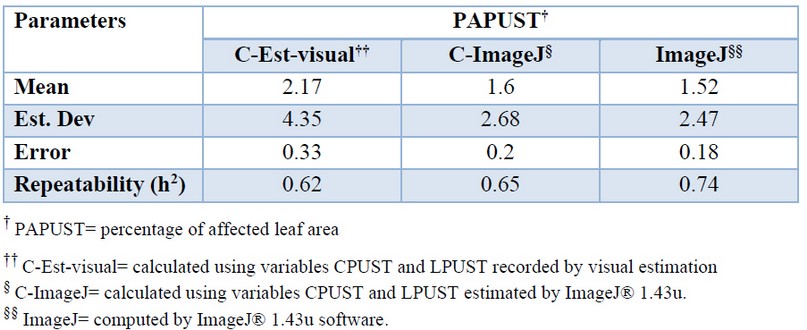
Table 4. Mean values, standard deviation and standard error of the variable percentage of leaf area (PAPUST) affected by brown rust of different methods used in its determination.
The use of linear regression detected in all methods a significant relationship between the percentage of affected leaf area and the rating degrees assigned to the control cultivars (Table 5). The mathematical models obtained explained between 74 and 71% of the total variation of the data.
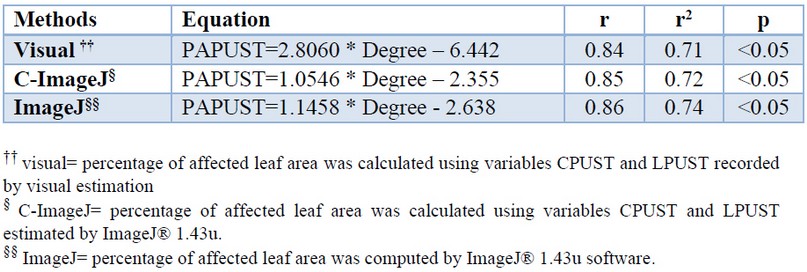
Table 5. Linear models associated with the determination of the rating degree of the brown rust resistance in sugarcane cultivar
The correlation between the means of the percentage of leaf area affected by brown rust of the control cultivars, reported in the new methodology for brown rust evaluation 13 and those accounted by the different methods used in the present work, revealed the existence of a significant association in all cases (Table 6). This indicated that the results are consistent or coherent with each other. The determination coefficients (r2) for the image processing methods were higher than the visual estimate.
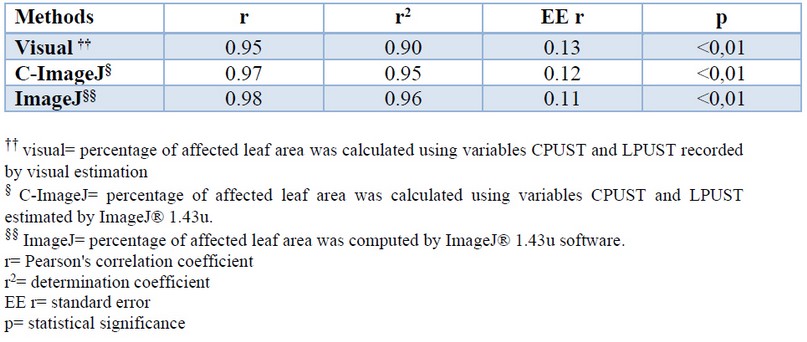
Table 6. Pearson's correlation coefficient between the percentage of leaf area affected by brown rust of the control cultivars reported in the new methodology (13) and those estimated by different methods.
The resistance classification obtained by each method showed very similar results (Table 7). All new cultivars showed an intermediate reaction (moderately resistant or moderately susceptible) to brown rust, which indicates that they should be selected for extension in commercial areas for their agro-industrial potential managed appropriately in areas of the low incidence of the disease.
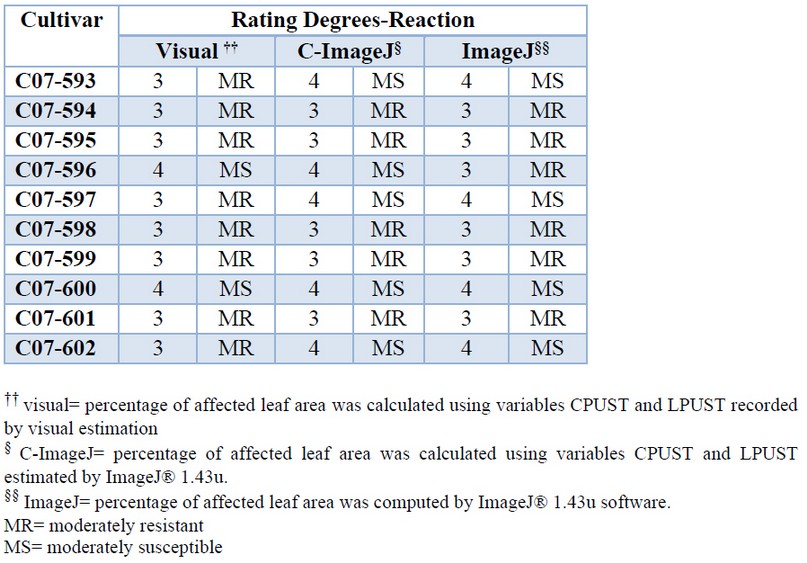
Table 7. Rating degrees and reaction to brown rust of 10 sugarcane cultivars estimated by different methods
The results derived from this work demonstrate that the visual estimation presents a high degree of variation in evaluating the lesions caused by brown rust in sugarcane cultivars. This method used on a large scale is very time consuming, subjective and error-prone 15. Automated analysis of digital images can overcome these problems without differing results.
Identifying new cultivars by their resistance to diseases is an essential step in any genetic improvement program. With this consideration, the application of image processing is a promising approach to overcome the drawbacks of visual estimation 16. This method, accompanied by a suitable analysis algorithm, is objective and allows non-invasive measurements directly in greenhouses and fields.
To estimate the precision of the experiments, the repeatability statistic (h2) was included because it considers the variability by the treatments (methods) and not the variation of the experimental error. Traditionally, the coefficient of variation has been used to decide whether an experiment is reliable or not; however, it is closely related to the environmental mean and does not allow determining whether the differences are determined by genotype or experimental error 17, 18.
The use of the Pearson's coefficient as an indicator of the experiment's quality was essential in deciding whether the data obtained is reliable and consequently whether or not to accept their validity. Similarly, linear equations allowed the estimation of varietal resistance. Australia uses a similar method to assign a reliability category to disease resistance trials in the sugarcane breeding program, thereby ensuring accuracy in the classification of new cultivars 14.
The modifications to the methodology for evaluating resistance to brown rust proposed in the genetic improvement program for sugarcane in Cuba included incorporating quantitative indicators in the measurement of symptoms of a disease to ensure the reliability of the results 13. The present work verifies that, regardless of the method used to estimate the lesions, the cultivar classification results are consistent with each other, although with greater precision in those obtained through image processing.
CONCLUSIONS
Image analysis has been employed in a novel manner to assess brown rust - sugarcane pathosystem to accurately compute characteristic disease lesion and classify new cultivars' resistance with more precision than visual estimation. Although the accuracy of visual scoring methods can be improved through scorer training and standard area diagrams and scales, a degree of variation and inaccuracy remains. Inaccuracies in disease assessment can lead to erroneous conclusions drawn; thus, any steps to improve accuracy should be taken. Therefore, it is proposed to move away from visual disease assessment toward a system based on digital image analysis, as outlined here. The method is simple to implement and is not computationally complex.
Acknowledgments
The authors are grateful for the financing support and facilities provided by the Oriente Sur Experiment Station (ETICA Oriente Sur) of the Institute for Sugarcane Research (INICA) for the realization of this research that is part of the project entitled "Updating of methodological procedures for pest resistance evaluation in sugarcane cultivars " ((PROY- 0097-003-002-044).]
REFERENCES
1. Parker, S. R., Shaw, M. W., Royale, D. J. Measurements of spatial patterns of disease in winter wheat crops and the implications for sampling. Plant Pathol., 1997; 46:470-480. doi: 10.1046/j.1365-3059.1997.d01-38.x
2. Bock, C. H., Poole, G. H., Parker, P. E., Gottwald, T. R. Plant disease severity estimated visually, by digital photography and image analysis, and by hyperspectral imaging. Crit. Rev. Plant Sci., 2010; 29:59-107. doi: 10.1080/07352681003617285
3. Schneider, C.A., Rasband, W.S., Eliceiri, K.W. NIH Image to ImageJ 25 Years of Image Analysis. Nature Methods, 2012; 9: 671-675. doi: 10.1038/nmeth.2089.
4. Barry, D.J., Chan, C. Williams, G.A. Morphological quantification of filamentous fungal development using membrane immobilization and automatic image analysis. Journal of Industrial Microbiology & Biotechnology, 2009; 36(6): 787-800. doi: 10.1007/s10295-009-0552-9.
5. Gimmen, J. Garcia, S. Generating Color Vignettes and Metadata for Insect Auto-Classification. In: Proceedings of The National Conference on Undergraduate Research (NCUR). Weber State University, Ogden Utah, University of Guam, Mangilao, GU 96923, USA, March 29 – 31, 2012: 505-509. http://ncurproceedings.org/ojs/index.php/NCUR2012/article/download/126/77
6. Tamayo, M., Puchades, Y., Hechavarría, M., Rodríguez, R., Chacón, V., Alfonso, I. Caracterización morfológica y morfométrica del organismo causal de la roya naranja de la caña de azúcar. Cuba & Caña, 2014; 1: 12-16.
7. Aday, O. C., González, R., Díaz-Mujica, F. R., Reyes, C., Gil, Y., Reyes, S., Barroso, J. Aplicación del software ImageJ® 1.43u en la caracterización de los síntomas de la mancha anular de la caña de azúcar. Centro Agrícola, 2017; 44(2): 83-88. http://cagricola.uclv.edu.cu
8. Aday, O. C., Alfonso, I., Rodríguez, E., Díaz-Mujica, F. R., Gil, Y., Váldes, B. L., Barroso, J. Caracterización de los síntomas de la roya naranja (Puccinia kuehnii (W. Kruger) E. J. Butler) en cuatro cultivares de caña de azúcar en Cuba. Centro Agrícola, 2017;44(2): 61-67. http://cagricola.uclv.edu.cu
9. Rott, P., J. Girard, J.C. Comstook. Impact of pathogen genetics on breeding for resistance to sugarcane diseases. Proc. Int. Soc. Sugar Cane Technol., 2013; 28: 1–11. http://www.issct.org/proceedings/2013.html
10. Huang, Y.K., W.F. Li, Zhang, R.Y., Wang, X.Y. Color Illustration of Diagnosis and Control for Modern Sugarcane Diseases, Pests, and Weeds. China Agriculture Press and Springer Nature Singapore Pte Ltd., 2018; 18–20. https://doi.org/10.1007/978-981-13-1319-6
11. Peixoto Jr., R.F.; Figueira, A.V.O.; Landell, M.G.A.; Nunes, D.S.; Pinto, L.R.; Sanguino, A. Development and characterization of microsatellite markers for Puccinia melanocephala, causal agent of sugarcane brown rust. Proc. Int. Soc. Sugar Cane Technol., 2013; 28: 1-4. http://www.issct.org/proceedings/2013.html
12. Raid, R.N., Comstock, J.C. Common rust. In: A guide to sugarcane diseases. Rott, P., Bailey, R.A., Comstock, J.C., Croft, B.J., Saumtally, A.S. (Eds) CIRAD and ISSCT CIRAD publications, Montpellier, France, pp 85-88.
13. Montalván, J., Alfonso, I., Rodríguez, E., Puchades, Y., Rodríguez, J., Aday, O., Carvajal, O., Delgado, J. Evaluación de la resistencia a roya parda de la caña de azúcar en Cuba. Centro Agrícola, 2018; 45(2): 47-54. http://cagricola.uclv.edu.cu
14. Stringer, J., Croft, B., Bhuiyan, S., Deomano, E., Magarey, R., Cox, M., Xu, X. A new method of statistical analysis for disease screening trials. Proc. Aust. Soc. Sugar Cane Technol., 2012; 34: 6 p. https://espace.library.uq.edu.au/view/UQ:f30daf2
15. Stewart, E. L., McDonald, B. A. Measuring quantitative virulence in the wheat pathogen Zymoseptoria tritici using high-throughput automated image analysis. Phytopathology, 2014; 104:985-992. doi: 10.1094/PHYTO-11-13-0328-R.
16. Thomas, S., Behmann, J., Steier, A., Kraska, T., Muller, O., Rascher, U., Mahlein, A. K. 2018. Quantitative assessment of disease severity and rating of barley cultivars based on hyperspectral imaging in a non-invasive, automated phenotyping platform. Plant methods, 2018; 14, 45. doi:10.1186/s13007-018-0313-8
17. Yan, W., Holland, J. B. A heritability-adjusted GGE Biplot for test environmental evaluation. Euphytica, 2010; 171:355-369. doi: 10.1007/s10681-009-0030-5
18. Gordón-Mendoza, R., Camargo-Buitrago, I. Selección de estadísticos para la estimación de la precisión experimental en ensayos de maíz. Agron. Mesoam., 2015; 26(1):55-63. doi 10.15517/am.v26i1.16920
Received: 30 November 2020
Accepted: 15 january 2021
Yaquelin Puchades-Izaguirre 1, Mónica Tamayo-Isaac 2, Wilfre Abiche-Maceo 3, Reynaldo Rodríguez-Gross 4, María La O-Hechavarría 5, Mérida L. Rodríguez-Regal 6
1. Yaquelin Puchades-Izaguirre* Ph.D., Plant Pathology Researcher, https://orcid.org/0000-0001-6608-4997. Scopus Author ID: 6508050636
2. Mónica Tamayo-Isaac MSc., Plant Pathology Researcher, http://orcid.org/0000-0002-2981-6172.
3. Wilfre Abiche-Maceo Eng., Plant Breeding Researcher, https://orcid.org/0000-0002-3412-9414
4. Reynaldo Rodríguez-Gross PhD., Plant Breeding Researcher, http://orcid.org/0000-0003-3910-2656
5. María La O-Hechavarría PhD., Plant Pathology Researcher, http://orcid.org/0000-0002-1469-8038
6. Mérida L. Rodríguez-Regal PhD., Plant Pathology Researcher, http://orcid.org/0000-0002-8668-070X]
1-4: Experiment Station for Sugarcane Research Oriente-Sur (ETICA Oriente Sur), Institute for Sugarcane Research (INICA), Carretera Central Km 2 ½, Los Coquitos, Palma Soriano, 92610, Santiago de Cuba, Cuba
5-6: Institute for Sugarcane Research (INICA), Carretera CUJAE, Km 1½, Boyeros 19390, La Habana, Cuba
Corresponding author: [email protected].