2022.07.02.22
Files > Volume 7 > Vol 7 No 2 2022

Mohammed Subhi Altaweel 1, Hyatham Abdull Star Saied 2, Shaymaa khaleel alhialy 3,
1 Field Crops Dept. College of Agriculture & Forestry – University of Mosul – I.R.A.Q.
2 Department of Plant Production Techniques/Agricultural Technical College/Mosul/Northern Technical University.
3 Department of Biology/College of Science/University of Mosul
* Correspondence: [email protected], ORCID : 0000-0002-3780-0218
Available from: http://dx.doi.org/10.21931/RB/2022.07.02.22
ABSTRACT
In this study, nine types of bread wheat (Triticum aestivem L.) were used. To analyze it at the molecular level, Random Amplified Polymorphic D.N.A. (R.A.P.D.) markers based on PCR technology were used to study the variations of the cultivars. It is absent in other varieties and can be used as a distinctive genetic fingerprint to preserve plant breeders' rights. Genetic banks can use it to distinguish the mentioned varieties and models, confirming the importance of this technique in molecular characterization and genetic fingerprinting studies. From the results of the molecular aspect, the similarity matrix was implemented based on the coefficients of (Nei & Lie) for the nine studied varieties.
The highest similarity value was between the variety (Taymoz/2 and Baghdad/3), and its value was 0.9167. Most of the traits showed a similarity in the mean between them for all the genetic traits, but the lowest similar value was between the two varieties (Rashid and Baghdad/1). Genetic level, the cultivar seeds were sown under arid conditions in the fields. The experimental unit contained two lines for each category, the length of the line was 2 m, and the distance between the lines was 30 Cm. The characteristics of the number of days of 50% flowering, plant height (Cm), biological yield (gm/plant), grain yield (gm/plant) and weight of 100 grains (gm) were studied. The inputs differed significantly at the 1% probability level for all studied traits. There was high genetic variance for the characteristics of the biological yield (kg/ha) and seed yield (kg/ha), and the weight of one hundred seeds (g). The highest values of genetic variation coefficients for seed yield were superior. The percentage of heritability in its broad sense was high for all the studied traits. The values of the expected genetic improvement were a high percentage of seed yield, vital yield, harvest index, number of total branches per plant, the average for plant height, first pod height (Cm), number of seeds/pod, the weight of 100 seeds, and few numbers of days to flowering at 50%.
Keywords. Triticum aestivem, R.A.P.D., Phylogenetic, Molecular markers
INTRODUCTION
Bread wheat (Triticum aestivum L.) is one of the most important cereal crops globally and the most cultivated and productive. The area planted with wheat in 2018 reached 214 million hectares, and its productivity was about 34.254 tons/hectare1. In Iraq, the area planted with wheat reached about 6331 thousand dunams for the winter season of 2019, and its production capacity for the same year is about 4,343,000 tons2.
The study of genetic parameters has a preliminary indicator for evaluating the varieties and the extent of variation between them. Several researchers estimated these genetic parameters in the wheat crop were estimated by several researchers where3 indicated that the values of genetic, phenotypic, and environmental variations were significantly high for plant height and leaf area. The environmental variance values were higher than the genetic variance values. 4reported that the values of genetic variance were significant for most of the traits except for the traits of several days to flowering, the number of spikes/m2, biological yield g/m2, and grain yield g/m2. Grains/spike and the weight of 1000 grains in bread wheat.
4showed that the phenotypic variation coefficient values were high for grain yield, g/m2, medium for the number of spikes/m2, biological yield, g/m2, and the number of grains/spike, and low for the rest of the traits in bread wheat. As for the genetic variation coefficient values were high for the number of grains/spike and grain yield g/m2 and the average for the rest of the traits, and the values of the phenotypic variation coefficient were more significant than the genetics for all traits.
3showed that the values of heritability in the broad sense were high for plant height, the number of spikes per plant, The numerical quantity of wheat grains in the spike grain yield and weight of 100 grains, and 5indicated that the expected genetic improvement values were high for the characteristics of grain weight/spike, plant height, 1000-grain weight, and spike length in coarse wheat.
Since the R.A.P.D. Technique high efficiency has been used Widely in the genetic variation analysis 6 have estimated the genetic variation using 23 random primers with various bread wheat varieties, and they found that gene diversities were 0.8028 and 0.927. Tease high values indicate that the random primers used in the R.A.P.D. can identify the variation between the wheat varieties depending on the presence of the prominent bands and their numbers. 7has reported that the primers he used showed an apparent genetic variation among the refined wheat under study. 8reported the genetic distance for 8 tetraploid wheat varieties using 24 random primers; two of them showed standard bands while 22 primers showed 141 bands, 101 of them were variable. The genetic distance percentage was 72.6% using R.A.P.D. markers.
The study of the genetic dimension is important because it is one of the goals that plant breeders aspire to evaluate varieties for each breeding program, whether (selection, crossbreeding, introduction), and to locate quantitative traits and preserve genetic assets, in addition to that it does not require hypotheses about the nature of the data distribution, and The reflection of the field assessment of varieties with the laboratory through the use of polymorphic random multiplication indicators9.
This study aims to evaluate the performance of cultivars and their adaptation to environmental conditions by estimating genetic parameters and estimating the degree of genetic divergence between the studied cultivars.
MATERIALS AND METHODS
The study included two phases:
The field study
The study was carried out in the fields of the College of Agriculture and Forestry, University of Mosul, and included the cultivation of seeds of fifteen varieties of bread wheat (Triticum aestivum L. sourced from the Plant Breeding Center / Ministry of Science and Technology - Baghdad and Table (1) show the genealogy of the varieties. They were planted on 16/12 /2018, according to the design of complete randomized sectors. RCBD10, with three replications, where the items were randomly distributed in each repetition and by two lines for each item. The line length was 2 meters, the distance between the lines was 30 cm, and urea fertilizer was added at a rate of 20 kg (nitrogen). per dunum11, which is equivalent to 43.47 kg of urea, in two batches, the first - when planting and the second before the spikes were expelled. The study was conducted on 10 plants taken randomly, excluding the terminal plants from each line.
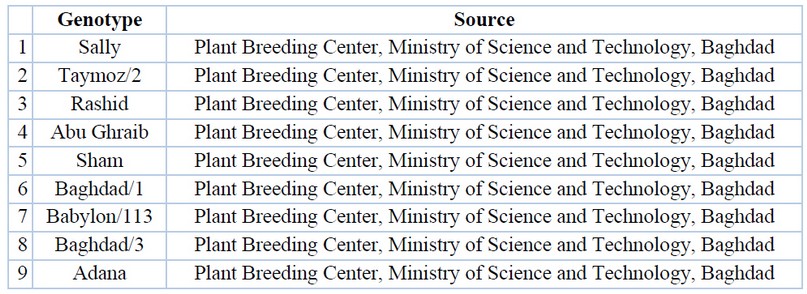
Table 1. Genealogy of genotypes and their numbers used in the study
The amount of rain falling during the growing season was (812.5 mm). The study was conducted on 10 plants randomly taken from every two lines, and the following characteristics were studied:
1- The number of days from planting until 50% of the spikes left the flag leaf sheath.
2- Plant height (Cm): The height of the plants was measured from the surface of the soil to the top of the ears, without the ridge.
3- The length of the spike (Cm): It was measured from the base of the spike to the top of the spike without the spur estimated.
4- The number of spikes/m2.
5- The number of grains of a spike: the average number of grains in each spike were calculated.
6- The vital yield: It represents the weight of the product of two lines (spikes + straw) and converted to kg/ha.
7- Grain yield: This is from the yield of two lines and then converted to kg/hectare.
8- Harvest index (%): It was calculated using the formula: Harvest index % = (grain yield/biological yield) x 100 mentioned by12.
9- The weight of 1000 grains is estimated in grams. The data were statistically analyzed according to the randomized complete block design (R.C.B.D) using the S.A.S. program (2004); genetic, phenotypic and environmental variances were estimated according to the method explained by13 according to the randomized complete block design (R.C.B.D) as reported by10.
 (1)
(1)As for the standard error of the phenotypic variance, it was estimated according to what was mentioned by14 according to the equation:
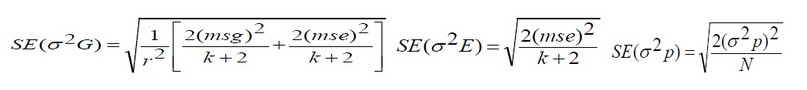 (2)
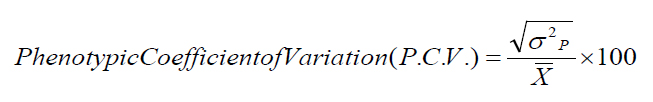
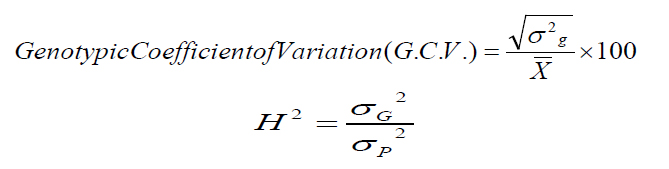
(2)Note that k = degrees of freedom for each source (genotypes or experimental error), r = the number of replicates, where N = the sum of the degrees of freedom for genotypes and experimental error, and the values of the coefficients of phenotypic variation (PCV) and genetic variation (G.C.V.) were calculated according to the method explained by15, and based on the ranges used by16 it is less than 10% low, 10-30% medium, and more than 30% high.
 (3)
(3)And finding the values of inheritance in the broad sense in the way they explained17. The ranges explained by18 were adopted. The values of heritability in the broad sense are less than 40%, low, 40-60% is medium, and 60% or more are high.
 (4)
(4)The expected genetic improvement when 5% of the plants were selected was estimated19. The ranges suggested by16 for the expected genetic improvement were adopted as a percentage of the average: less than 10% is low, 10-30% is medium, and more than 30% is high.
The Laboratory Study
Although the R.A.P.D. The technique is a relatively old and simple molecular method, but it is still widely used due to its ease of application and economics compared with other high accuracy techniques.
DNA Extraction
Genomic D.N.A. was extracted from plant tissue according to the protocol of Wizard Genomic D.N.A. Purification Kit (Promega, U.S.A.)
Quantitation of D.N.A.
To detect the extracted D.N.A., a fluorescent indicator was used to detect the goodness of samples for downstream applications. For 1 μl of D.N.A., 199 μl of diluted Quanty Flour Dye was mixed. After 5min incubation at room temperature, D.N.A. concentration values were measured.
PCR Amplification
Thermal Cycling Protocol
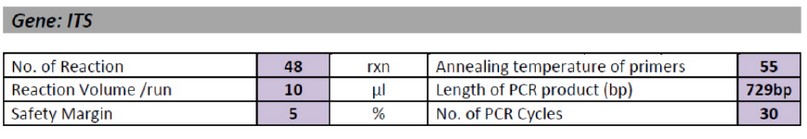
Table 2. Thermal Cycling Protocol
Primers
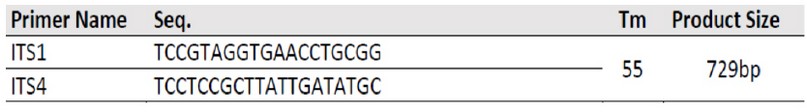
Table 3. Primers
RAPD Technique
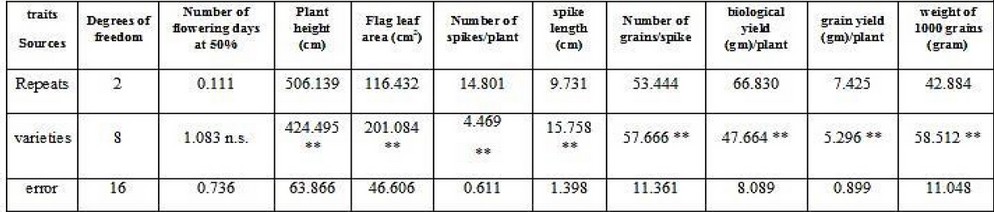
The R.A.P.D. The technique was applied using nine random primers in the sequences shown in table (4) to study the discrepancy between 9 varieties of wheat entering Iraq for the first time (Table 1).
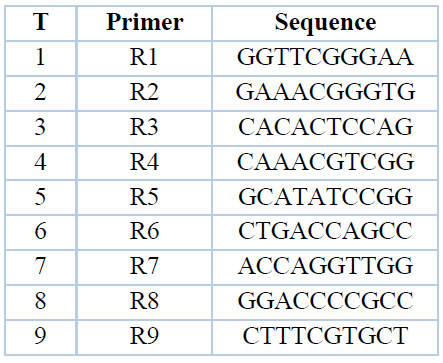
Table 4. Names and sequences of the random primers used in the experiment
Table 5. PCR Program
Agarose Gel Electrophoresis
After PCR amplification, agarose gel electrophoresis was adopted to confirm the presence of amplification at 80 volts for an hour and 40 minutes. The results of the R.A.P.D. Random multiplication was examined by imaging the electrophoresis patterns for each primer and identifying the bands, where the presence of the bands is represented by the number (1) and the absence of the band by the number (0). Cluster analysis was also conducted using the Euclidean program, and the scale through the genetic distance was estimated according to the R.A.P.D. Indicators and based on the similarity scale (Jaccard Index), after calculating the similarity ratios according to the previous laws, the other stage begins to calculate the genetic kinship and the Phylogenic evolution tree was drawn for a class of similar individuals next to each other in one cluster. If the genetic material is identical between two classes, this indicates that the genetic dimension must be equal to zero, and the similarity ratio is equal to 1 (100%)20 .
RESULTS AND DISCUSSION
It is noted from Table (6) that the averages of the cultivars' squares differed significantly at the 1% probability level for all the studied traits except for the trait of the number of days to flowering at 50%, which did not reach the level of significance. Such differences between varieties in the characteristics give the appropriate opportunity for plant breeders to benefit from them in future breeding programs.
**** Significance at 0.01
Table 6. Analysis of variance for the studied traits in bread wheat
Table (7) indicates the averages of the cultivars and for nine studied traits, during which it becomes clear to us that there are differences in these cultivars and for all traits, where the cultivar Adana and in the desired direction outperformed the rest of the cultivars in the short period of days for flowering at 50% as it reached (94 days). As for the plant height characteristic, the cultivar Sally showed its superiority in the desired direction over the rest of the cultivars in length and reached (101.733 cm). The characteristic of the area of the flag leaf showed the highest value in the variety Babylon/113 in the desired direction, as it reached (42.079 cm2). The cultivar Sally showed its superiority over the rest of the cultivars and in the desired direction, as it reached a value of (5.800) for the characteristic of the number of spikes/plant thus it is possible to benefit from the cultivar Sally by including it in the crossbreeding programs. It is noted that the highest value of the average spike length was in the cultivar Babylon/113 in the desired direction, and it reached (12.367 cm). As for the characteristic of the number of grains/spike, the Rashid variety excelled in the desired direction and reached (68,333) over all other varieties, and from this, it is possible to benefit from the variety Rashid in improving the grain yield of gm/plant by increasing the number of grains/spike.
The genetic structure of Sally gave the highest value in the trait of biological yield, g/plant, and in the desired direction, which amounted to (23.415 g). The results of the average values of the grain yield, g/plant, indicate the superiority of the cultivar Sally over the rest of the cultivars and in the desired direction, as it reached (7.805 g). Therefore, it is possible to select the variety Sally and replanted in subsequent studies and in multiple locations to ensure its superiority and stability of its characteristics, to benefit from it either directly as a new variety or by entering it into crossbreeding programs with other varieties. As for the 1000-grain weight trait, Rashid showed a high superiority over the rest of the cultivars in the desired direction and reached (60.564 g); and thus, Rashid could be entered into the crossbreeding program with other cultivars to transfer the genes of the high yield, as the 1000-grain weight trait is one of the main yield components.
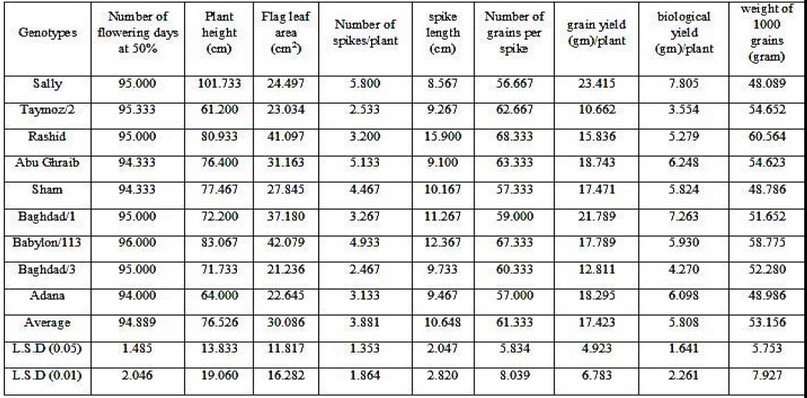
Table 7. Average varieties of bread wheat for the studied traits
Table (8) shows that the values of phenotypic, genetic and environmental variances were significant from zero for all studied traits except for the number of days to flowering at 50%. Environmental variations were significant for most traits except for the traits of a number of days to flowering at 50%, several spikes/plant, spike length, and the grain yield, and concerning the phenotypic variations, it was significant for all traits except for the number of days to flowering at 50%, the number of spikes/plant and the grain yield and this is in line with what was mentioned by,21,22 and 4and 23 As for the coefficients of phenotypic and genetic variation, they were medium and low for most of the traits, and these results are in line with what was reached by4. As for the values of heritability in the broad sense, they were high for the characteristics of plant height, the number of spikes/plant, spike length, biological yield and grain yield, medium and low for the rest of the traits is consistent with3. The expected genetic improvement values were high for the characteristics of the leaf area/cm2, the number of spikes/plant, spike length; biological yield, grain yield, medium and low for the rest of the traits, and these results are in line with what5,4 .
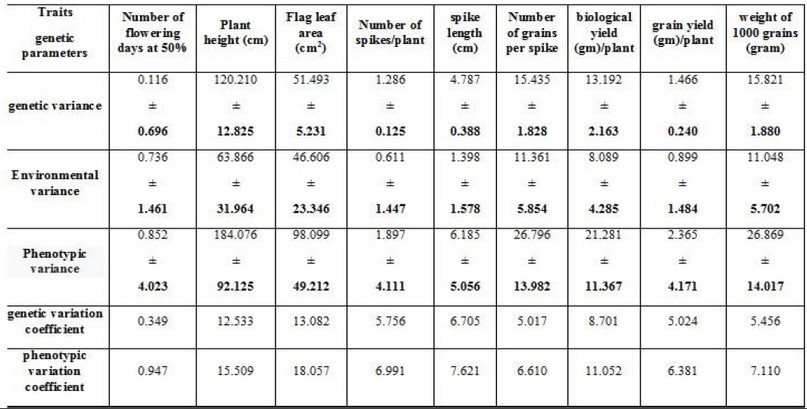
Table 8. Genetic parameters of the studied traits in bread wheat
PCR expansion
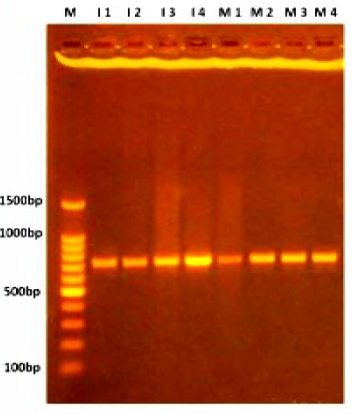
Figure. 1 ITS region amplification fractionated on 1% agar gel electrophoresis stained with Eth.Br. M: 100bp D.N.A. marker.
Polymorphism resulting from the use of R.A.P.D. technique
Eight primers were highly efficient in detecting the divergences between the varieties, according to Table (9).
Depending on the primer used, the results showed a clear difference in the number of alleles, in addition to the presence of primers that did not show any bands, and the reason may be due to the absence of a complementary linkage region for the sequence of bases for this primer on a complementary site within the D.N.A. sequences of the genome of the studied species. Several studies showed the presence of differences in results for primers24,25. The rest of the primers had varying abilities to detect the magnitude of genetic variation among the studied genotypes, while others gave a less number of bands. We also note that the nine primers gave 30 allelic loci, including 9 major alleles for their appearance in all genotypes, while the different alleles are of the characteristic alleles of the genotypes, and 21 alleles are relied upon to determine the genetic link between the genotypes.
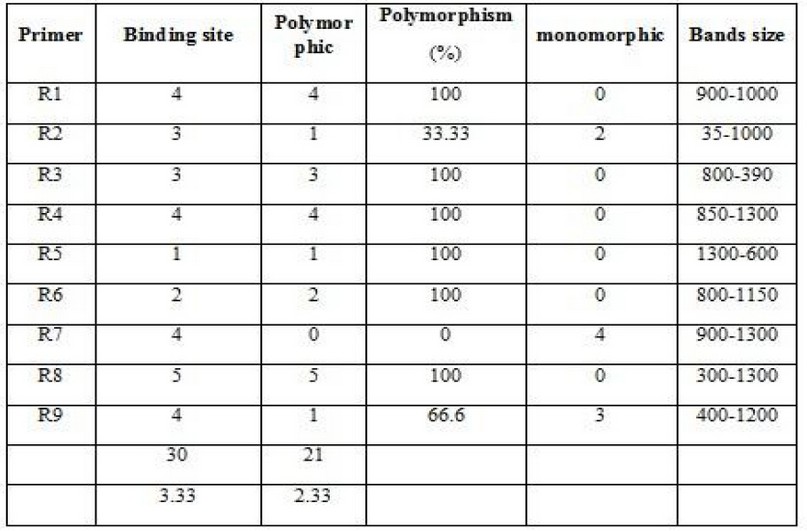
Table 9. Genetic variances for the primers used
Primer R1
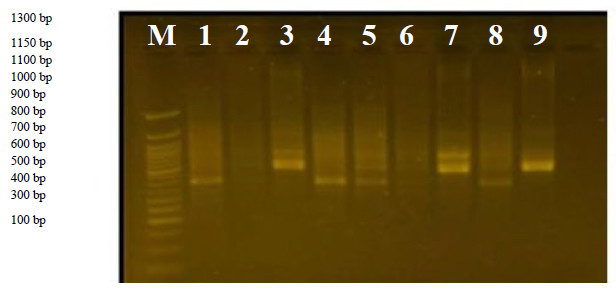
This primer was used in genotypic D.N.A. replication, and 4 different allelic binding sites were obtained, and the percentage of them was 100%. This primer showed an apparent variation in bands position and a molecular weight ranging between 1000-1100bp.
From Figureure (1), it is clear that cultivars 6 and 4 do not have any linkage site with this primer, and the reason is due to the absence of a complementary linkage region for the base sequence of this primer on a complementary site within the genome D.N.A. sequences of the studied species.
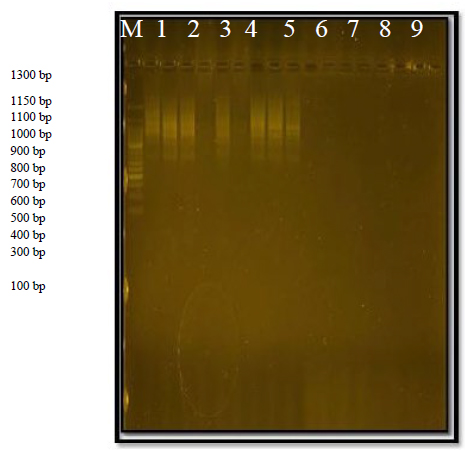
Figure 2. The product of the random amplification reaction of D.N.A. using the R1 primer.
Primer R2
The primer was able to identify 3 sites of its complementary sequences in the D.N.A. of the genome; all of the first structures with a size of 35 bp and the second 1100 bp are present in all varieties. The third link site has complementary sites in the first and second variants, with a size of 1000 Pb. This primer showed a 33.33% variation.
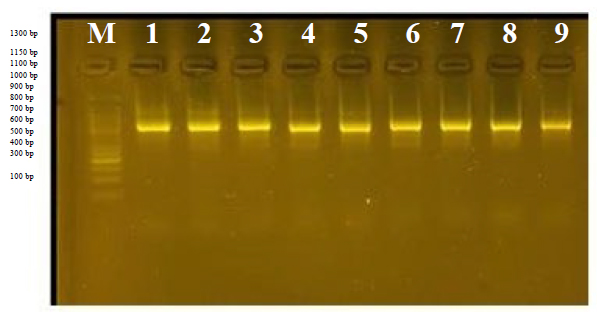
Figure 3. The product of the random amplification reaction of D.N.A. using the R2 primer.
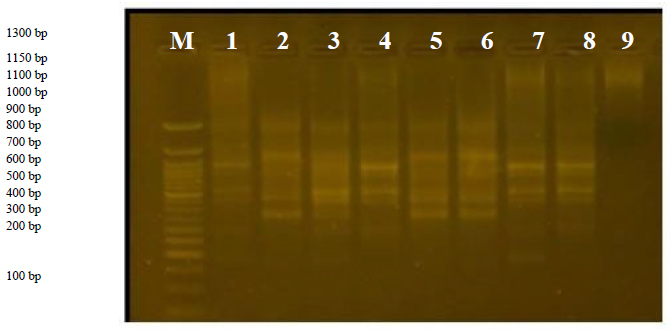
Primer R3
The number was 3, whose sizes ranged from 390bp to 800bp. Cultivar 6 was distinguished by the absence of bands and was considered a distinctive feature of this cultivar, and the variance ratio was 100%.
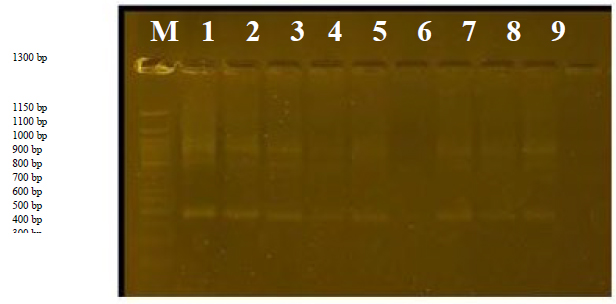
Figure 4. The product of the random amplification reaction of D.N.A. using the R3 primer.
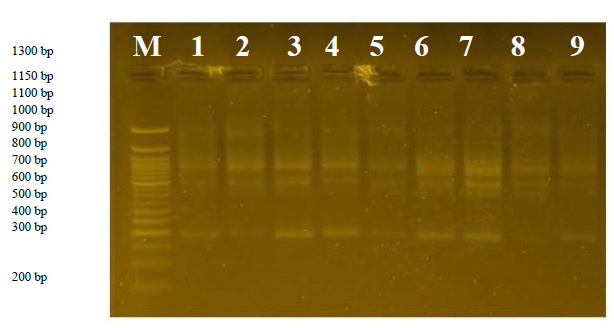
Primer R4
This primer has many 32 packets that resulted from 4 alleles, all bands are different, so the percentage of divergent bundles becomes 100%. The primer was able to identify the complementary sequences in the D.N.A. of the genome for the genotypes, and it showed an apparent variation in the molecular weight ranging between 850-1700 bp; from Figureure (4) we note that the primer did not find its complementary series at genotype 3, so no bundle appeared; thus it can be considered as an imprint of this genotype in this prim.
R5
This primer distinguished variant 1 with a band size of 1700 bp. It also able to identify the complementary sequences in the D.N.A. of the genome, as it showed a clear variation in the molecular weight, ranging between 600-300 bp,
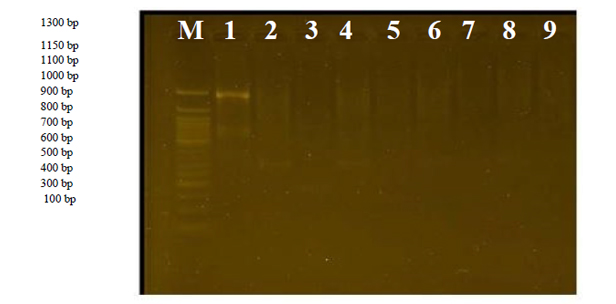
Figure 5. The product of the D.N.A. random amplification reaction using the primer R5.
R6
This primer showed two complementary genomic loci, the first was associated with a size of 800 bp, and the second site distinguished a locus with a size of 1500 pb. As for variants 2 and 6 respectively, it was distinguished by the absence of any complementary linkage to the primer, and the divergence ratio was 100%.
R7
This primer was distinguished by the presence of 4 identical bans for all types, the similarity rate was 0%, and their sizes ranged from 900 to 1700bp.
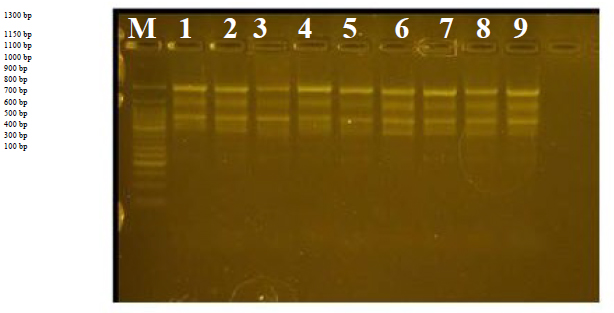
Figure 7. The product of the D.N.A. random amplification reaction using the initiator R7
R8
This primer produced 5 different bands, ranging from 400 to 1700bp, with a variance of 100%.
Figureure 8. The product of the D.N.A. random amplification reaction using the initiator R8
R9
This primer produced 3 bands ranging from 400 to 1200pb. Variant 8 was distinguished by the absence of a band with a size of 400pb in all varieties, and the variance ratio was 66%. This is considered a distinctive feature of variant 8 because the initiator did not find a complementary site for it.
Figureure 9. The product of the D.N.A. random amplification reaction using the initiator R9
The relative relationship between the wheat cultivars under study based on R.A.P.D. data
According to the previous results, the R.A.P.D. The technique was able to find unique and distinct bands capable of distinguishing between the studied wheat varieties; that is, these bundles were found in a particular variety and absent in other varieties. Genetic banks can use it to distinguish the mentioned cultivars. This confirms the importance of this technique in studies of molecular characterization and genetic fingerprinting.
A genetic relation tree was made for the nine taxa, where U.P.G.M.A. similarity values were estimated using the studied R.A.P.D. method based on data analysis.
The similarity between the studied wheat cultivars was Estimated based on the results shown by the primers, where the results that appeared in the gel electrophoresis were transferred to the characterization tables by placing one in the presence of a band and zero in its absence after that the symmetry matrices are formed based on the coefficients Table (3) results of the similarity matrix between the studied varieties. The highest similarity was between the variety (2 and 8), and its value was 0.9167; most of the traits showed closeness in the arithmetic means between them for all genetic traits, while the lowest similarity value was between the two variants (3 and 6), where the result of reading the arithmetic mean was significantly different in most of the phenotypic traits between these two variants, these results between varieties using R.A.P.D. Indices were associated with phenotypic traits and were consistent with what was found before8, where the results showed that the lowest genetic distance was between two cultivars that have specific significant characteristics in common.
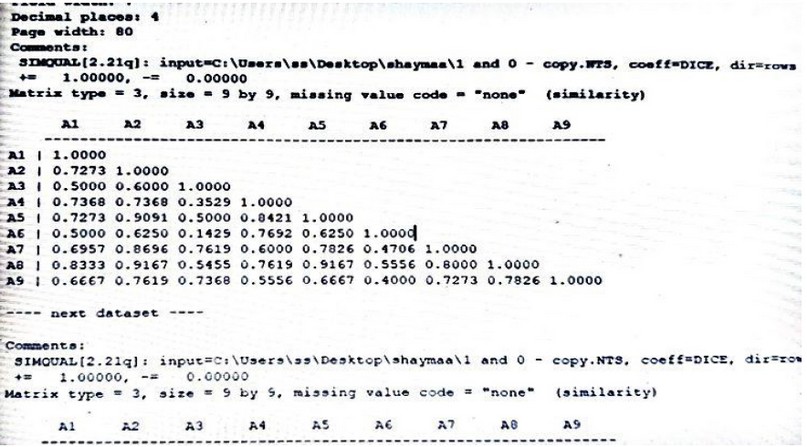
Figure 10. The kinship relationship between the studied wheat cultivars based on R.A.P.D. data.
Cluster analysis of genotypes of bread wheat based on R.A.P.D. Markers
Cluster analysis shows the evolutionary relationship of a group of living organisms that arose from a common lineage containing the largest possible number of genotypes in plant breeding and development programs,. The accessions may be collected in one group according to their geographical location or origin and lineage Figureure (11).
The nine bread wheat varieties cluster tree showed two main groups; the first leading group was divided into two secondary groups, and the first secondary group was divided into two branches. The genetic material of these genotypes may be similar according to the number of D.N.A. segments to the gene of these complementary structures of the primer sequences used, while the second secondary group included variants 4 and 6, and the reason for this relationship is due to sharing most of the genetic traits and their possession of a number of similar D.N.A. pieces to show the extent related to each other, while the second main group included only variants 3 and 9, due to their uniqueness of their behavior with most of the primers used in the study.
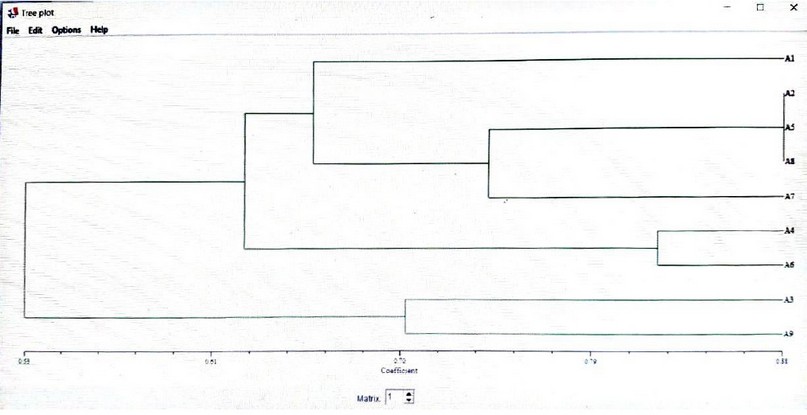
Figure 11. Neighbor-joining tree for the studied varieties using unequal pairs groups (U.P.G.M.A.).
CONCLUSION
Among the results obtained from both aspects, the molecular study proved its effectiveness of and usefulness for plant breeders and the as the building block for the success of any plant breeding program, and the shortening of time in determining the appropriate varieties to conduct crosses and improving the characteristics of the yield.
Funding: self-funding
Acknowledgments: In this section, we acknowledge any person who supports us in completing this project.
Conflicts of Interest: there is no conflict
REFERENCE
1. F.A.O. Annual Agricultur Statisticaln food and agriculturer organization of united nations F.A.O.,Roma .Italy.2020
2. Agricultural Statistics Directorate/Central Statistical Organization/Iraq. Wheat and barley production for the year 2019
3. Ayoob, Mohammed H.Estimation of Phenotypic Variance Components, Heritability, Average Degree of Dominance and Genetic Advance for Early Generation in Bread Wheat (Triticum aestivum L.) Rafidain Journal of Science,2020: 1(28) : 11-23 .
4. Al-Najjar, Safwan Muhammad Younis .Estimation of genetic parameters, path analysis and genetic dimension of genotypes introduced of bread wheat for different sowing distances. Master's thesis, College of Agriculture and Forestry, Department of Field Crops, University of Mosul.2020.
5. Jabbour, Yaman, Muhammad Shafiq Hakim, Filippo Bassi, Abdullah Al-Youssef, Maysoon Saleh and Ahmad Shams Al-Din Shaaban. Estimation of genetic indicators for some important traits in crosses of a type of durum wheat (Triticum durum Desf) Syrian Journal of Agricultural Sciences,2019: 6(4): 221-238.
6. Al-karkhi ,Hadeel. A. Hatam, Jassim M. A. AL-Joburi and Naoroz. A. Tahir. Estimate of The Genetic Diversity For Many Genotypes of Bread Wheat (Triticum aestivum L.) Depending on R.A.P.D. Technology. Tikrit university of Sci.Agric.2018: 18(1) : 1813-1646
7. Awaad, H.A.; Youssef, M.A.H. and Moustafa, E.S.A., Identification of Genetic Variation among Bread Wheat Genotypes for Lead Tolerance Using Morpho – Physiological and Molecular Markers. J. American Sci. ;2010:6(10):1142-1153]. (ISSN: 1545-1003).
8. Abdullah,Shaymaa,kh.; Sulyman, Saffaa Aldeen A.and Al-Hamdany, Ghada A. T. Evaluation of Genetic Diversity among Eight Tetraploid Wheat Varieties Using Random Amplified Polymorphic D.N.A. (R.A.P.D.) Markers. College of Basic Education Researchers Journal,2013: Vol. (12), No.(4).
9. Yan.S.K. and G.Ortiz.1994 .Regression and analysis of elite wheat lines grown in rain fed environment. J. of Genetics and Breeding. 48:183-190.
10. Al-Rawi, Khasha Mahmoud and Abdul Aziz Khalaf Allah . Design and analysis of agricultural experiments. Ministry of Higher Education and Scientific Research, University of Mosul.2000.
11. Al-Kubaisi, Ahmed Mudlul Muhammad and Hamad Muhammad Salih. Irrigation and fertilization scheduling for crops wheat and barley using the center pivot method. Ministry of Agriculture - General Authority for Agricultural Extension and Cooperative.2000.
12. Sharma, R. C., and E. L. Smith.Selection for high and low harrest index in three winter wheat population.CropScience .,1986: 26: 1117-1150.
13. Walter,A.B.Manual of quantitative genetics (3rd edition) Washington State Univ.Press.U.S.A.1975.
14. Mather , K. and Jinks , J.L.Biometrical genetics : The study of continuous variation . 3rd edition . Chapman and Hall , London , 396 pp.
15. Falconer, D. S. (1981). Introduction to quntiatve genetic longman group limited, London.
16. Agarwal, V. and Z. Ahmad. Heritability and genetic advance in tritcale. Indian J. Agric. Res.,1982: 16 : 19 – 23.
17. Singh, R.K. and B.D. Chaudhary. Biometrical Methods in Quantitative Genetic Analysis. Kalyani publishers, Ludihiana, New Delhi, 1977:pp.39–54, 239-266.
18. Ali, Abd al-Kamil Abdullah . Hybrid vigor and gene action in maize (Zea mays L.), PhD thesis, College of Agriculture and Forestry, University of Mosul.1999.
19. Johnson, H.w.; H.F. Robinson and R.E. Comstock. Genetic and phenotypic correlation in soy bean and their implication in selection. Agron. J.,1995: 47: 477- 483 .
20. Essleman, E.J.; Crawford, D.J.; Brauner, S.; Stuessy, T.F.; Anderson, G.J.and Mariosilva, O. R.A.P.D. markers diversity within and divergence among species of Dendroseris (Asteraceae : Lactuceae )Am . J. Bot.2000: 87 : 591-609.
21. AL_layla ,M.J. Genetic Analysis of Yield Seed and Its Components for Wheat. Jordanian Journal of Agricultural Sciences.2015: Issue 2 Volume 11؛507 -524
22. Kumar, A.; Kumar, A.; Rathi, V.; Tomer, K.P.S.Variability, heritability and genetic advance analysis in bread wheat (Triticum aestivum L.) genotypes. Intern. J. Current Micr. and Applied Sci.,2017: 6(8), 2687-2691.
23. Asaud, Abdelrazzak ; Khaity , Maamoun and Suleiman, Ahmad Haj,. The Contribution of Some Physiological Traits of Durum Wheat Crop in the Tolerance Improvement of Water Deficit Stress. Syrian Journal of Agricultural Research.2013: Volume 3 , Number 1 .
24. Nwangburuka, C.C.; Kehinde, O.B.; Ojo, D.K.; Popoola, A.R.; Oduwaye, O.; Denton, O.A. and Adekoya, M. Molecular characterization of Twenty-nine Okra Accessions using the random amplified polymorphic D.N.A. (R.A.P.D.) molecular marker J. of L. and Ph. Sci.ac. Satech,2011: 4 (1): 1-14 .
25. Mohammad, Abdullah K., and Muhammad S. Al-Taweel. STUDY OF GENETIC PARAMETERS AND CLUSTER ANALYSIS FOR NEW GENOTYPES OF BREAD WHEAT (TRITICUM AESTIVUM L.)." Plant Archives 20.2 (2020): 2396-2402.
Received: 8 December 2021 / Accepted: 29 January 2022 / Published:15 May 2022
Citation: Mohammed Subhi Altaweel, Hyatham Abdull Star Saied, Shaymaa khaleel alhialy. Study of genetic dimension for local varieties of bread wheat. Revis Bionatura 2022;7(2) 22. http://dx.doi.org/10.21931/RB/2022.07.02.22