2020.05.04.4
Files > Volume 5 > Vol 5 No 4 2020
INVESTIGATION / RESEARCH
Comparative Pilot Study Between a Tomographic Score and RT-PCR to Determine Diagnostic Prediction in Patients with COVID 19
Jorge Luis Vélez-Paez2,3, Rafael Salazar-Montesdeoca1, Juan Pablo Echeverría1, Steffy Reinthaller-Subía1, Sebastián Vásquez-Barzallo1, Andrea Villegas-Polanco1, Santiago Xavier Aguayo-Moscoso2
Available from: http://dx.doi.org/10.21931/RB/2020.05.04.4
ABSTRACT
In today's COVID-19 pandemic, application of RT-PCR is the diagnostic standard; however, such factors as the delayed availability of its results and the false negatives that are stemming from technical-dependent factors, the anatomical site of sampling, the time of the evolution of the symptoms and the viral load, make it possible to fail. Therefore, finding a diagnostic alternative becomes crucial, and pulmonary computed tomography (CT), using characteristic COVID-19 patterns, can fulfill this function by building tomographic scores. A prospective and observational cohort study was conducted in March-July 2020 in 30 patients with suspicion of SARS COV-2, admitted to the emergency department (ED) at Pablo Arturo Suárez Hospital. The purpose of the study was to compare the diagnostic correlation of a tomographic score and biomarkers, such as ferritin and D-dimer, with the standard RT-PCR diagnostic test. The score has a maximum value of 11 points, made up of bilateral involvement (2 points), peripheral distribution (2 points), posterior distribution (2 points), multilobar involvement (2 points), ground-glass opacification (2 points), and consolidation (1 point). The ROC curve was used to determine positive PCR predictors for COVID-19 by determining cut-off points and calculating the parameters corresponding to the diagnostic tests. At the multivariate level, the logistic regression approach was applied. The average age of the participants was 52 years, being higher in the positive ones (57 vs. 46, p: 0.045); there was no difference in gender, comorbidities, and prognostic scales. With the ROC curve, the cut-off points were established for positive or negative diagnoses: for the CT score it was 7 (AUC: 0.77 S: 93.33% and NPV: 88.89%), and it presented an adjusted OR of 53.51 (95% CI: 3-1036, p: 0.008), while for ferritin it was 883 ng/ml (AUC: 0.74 S: 93.33% and NPV: 90.91%) and had an adjusted OR of 80.18 (95% CI: 4-1475, p: 0.003), the AUC for D-dimer was not significant. The tomographic score, created for this pilot study, yielded promising results, giving an excellent diagnostic correlation with RT-PCR, being augmented with the ferritin biomarker, and reaching a predictive diagnostic level.
Keywords: COVID-19, RT-PCR, ferritin, D-dimer.
INTRODUCTION
In Wuhan, a city in China's Hubei province, an outbreak of pneumonia began in late 2019, quickly associated with the coronavirus family, and later spread worldwide. The SARS-CoV-2 virus, declared a pandemic, causes severe acute respiratory syndrome and the pathology, known as COVID-19 (Coronavirus Disease 2019), called so by the World Health Organization. 1
Viral genome sequencing was available to WHO on January 12, 2020, allowing laboratories in different countries to produce specific diagnoses via RT-PCR tests, which is currently the standard diagnostic test, but which, however, has false negatives dependent on the sampling site, operator experience, and viral load, so finding a complementary or supplementary test is desirable. 2
Chest computed tomography (CT) has a high sensitivity to show patterns suggestive of COVID 19; however, this study is generally intended for hospitalized patients.3 Different studies have been conducted worldwide to determine the diagnostic value of CT in SARS-CoV-2, finding sensitivity and specificity of 97% and 68%, respectively. Tao Ai et al. conducted a study involving 1014 patients, which attempted to determine the diagnostic value of chest CT scan in SARS-CoV-2 compared to RT-PCR. It was determined that the tomography has a high sensitivity for the diagnosis of COVID-19, especially in epidemic areas, and that it should be taken into account for patient screening, evaluation, and follow-up. 4-5
In this study, we aim to compare a CT score created based on the most common radiological patterns in chest CT scan with the results of the RT-PCR in patients entering the ED with a presumptive diagnosis of COVID-19, and to determine whether analytical biomarkers, such as ferritin and the D-dimer, can interact with the score and improve the diagnostic efficiency of the score.
MATERIALS AND METHODS
A prospective observational cohort study was conducted in 30 patients with suspicion of SARS COV-2 admitted to the Pablo Arturo Suárez Hospital ED in March-July 2020, comparing the diagnostic correlation of a tomographic score and biomarkers, such as ferritin and D-dimer, with the standard RT-PCR diagnostic test.
TOMOGRAPHIC SCORE
It was built by assigning a score based on CT findings reported in the Japanese Coronavirus Disease 2019 (COVID-19) study: A Systematic Review of Imaging Findings in 919 Patients, 6 The following scores were determined: bilateral involvement in 12 meta-analysis studies was for a whole of 497 patients, where 435 presented this finding, corresponding to 87.5% (2 points); peripheral distribution - 12 meta-analysis studies were evaluated for a total of 121 patients, out of which 92 presented this type of lesion, corresponding to 76% (2 points); posterior involvement - 1 meta-analysis study is for 51 patients, 41 of whom had these findings, corresponding to 80.4% (2 points); a multilobar involvement - with 5 meta-analysis studies of 137 patients, of whom 108 had these findings, corresponding to 78.8% (2 points); ground glass opacities were evaluated in 22 meta-analysis studies with 393 patients, out of whom 346 had this, corresponding to 88%; the consolidation - in 10 meta-analysis studies, where 204 patients were assessed, 65 had this complication, corresponding to 31.8% (1 point).
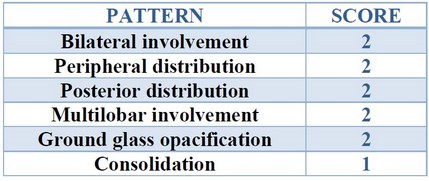
Inclusion and exclusion criteria
Within the inclusion criteria are patients over 18 suspected of having SARS COV-2.
Patients under the age of 18 and over 85, and those who are carriers of primary immune pathologies, HIV-like infectious and neoplastic pathologies, were excluded from the study.
Statistical processing
The analyses were performed using the RStudio and IBM SPSS version 25 statistical packages, using descriptive statistics, using tables and charts, representing absolute and relative values of qualitative variables, and measures of central tendency and scatter for quantitative variables.
The assumption of normality of quantitative variables was verified using the Shapiro-Wilk test, where the t-test was used for quantitative variables with a normal distribution (age), and the Mann Whitney test for non-normal quantitative variables, such as SOFA (it is a daily measurement system of multiple organ failure: respiratory, cardiovascular, coagulation, hepatic, renal, neurological; it is a prognostic indicator), APACHE II (it estimates the probability of death of a patient according to the values of a series of physiological variables, plus age and previous health status), CT score, ferritin, and D-dimer.
The Chi-square test or Fisher's exact test was used for qualitative variables.
To compare the CT score, ferritin, and D-dimer per PCR result for COVID 19, the graphic function of the RStudio program and the gstatsplot, and ggbetweenstats packages were used.
The Receiver Operating Characteristic (ROC) curve was applied to determine positive PCR prognosticators for COVID-19 by determining cut-off points and calculating the parameters for diagnostic tests: sensitivity, specificity, positive predictive value, negative predictive value, accuracy, and odds ratio. At a multivariant level, the logistic regression approach was used, determining predictors and defining the predictive equation. Statistical significance was set for p-value <0.05.
Ethical Considerations
Researchers have respected the bioethical principles of human research. The data obtained is secondary, obtained from the blogs and medical records; the identification of the patients will not be disclosed and has been recorded to avoid recognition. We also have permission to publish this work from the authorities and the Department of Teaching and Research.
RESULTS
30 patients were tested with PCR for COVID-19, of which 15 PCR test results were positive and 15 negatives. The average age of patients stood at 52 years; significant differences were observed between the PCR results with p-value 0.045, with the average age of 57 years for positive PCR vs. 46 years for negative PCR results. The sample was made up of 80% male majority. Among the most frequent comorbidities was diabetes mellitus - 23.33%, Arterial Hypertension (AH) - 16.67%, obesity - 13.33%, COPD - 10%, among others. Parameters associated with mortality risk showed an average of 12.77 for APACHE II and 3.87 for SOFA, the mortality rate was 16.67% with no differences observed in these parameters relative to the PCR outcome (see table 1).
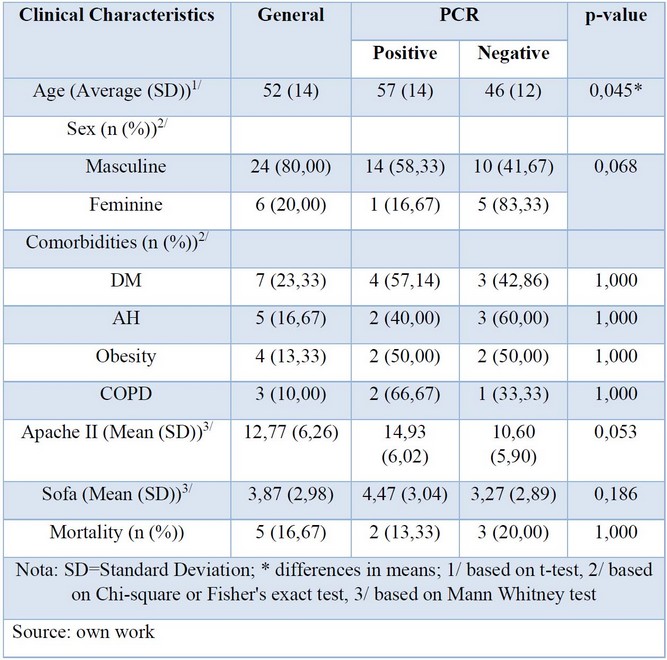
Table 1. Clinical Characteristics of Patients who were Tested with PCR for COVID-19
When comparing CT score between patients with positive or negative results, significant differences with p-value 0.009 were observed, where the mean was 5.13 (95% CI 3.83-7.07) for negative PCR vs. 8.33 (95% CI 7.3-9.17) for positive PCR; for this test, the effect size r was observed (0,48), which indicates that the relationship between CT score and PCR result for COVID-19 is medium. (see Figure 1)
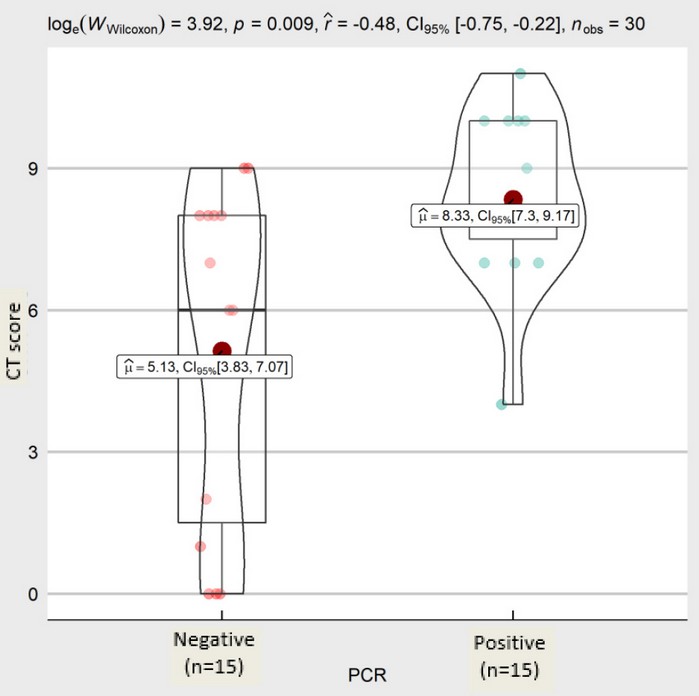
Figure 1. CT score comparison with PCR results for COVID-19
For ferritin, when comparing patients with positive and negative PCR, significant differences were observed with a p-value of 0.022, where the means were 839.31 ng/ml (95% CI 542.64-1201.48) for negative PCR vs. 1327.25 ng/ml (CI 95% 1198.52-1491.76) for positive PCR, for this test the effect size r (0.42) was observed, indicating that the relationship between ferritin and the PCR result for COVID-19 is medium. (see Figure 2)
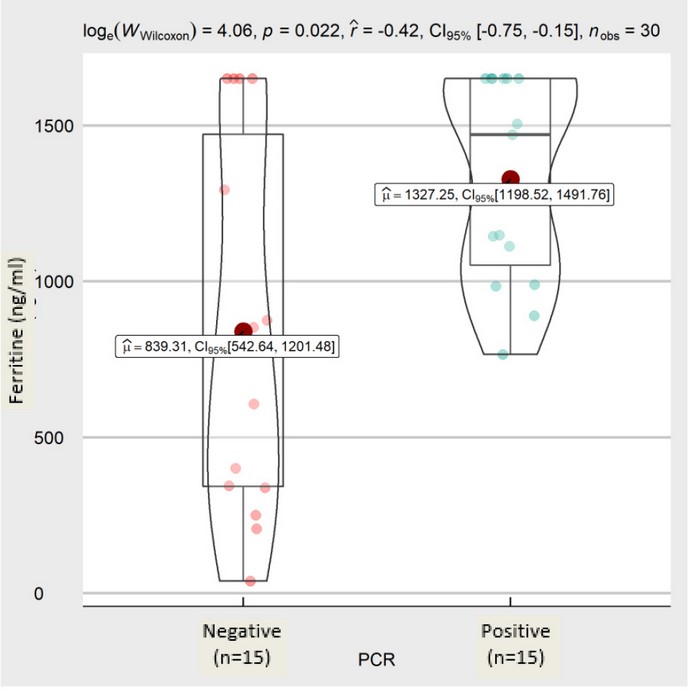
Figure 2. Comparison of ferritin by PCR results for COVID-19
Comparing the D-dimer between patients with positive and negative PCR did not find any significant differences; however, their averages were 1244.81ng/ml (CI 95% 698.14-2159.83) for negative PCR and 1193.55 ng/ml (CI 95% 856.51-1530.12) for positive PCR. (See Figure 3)
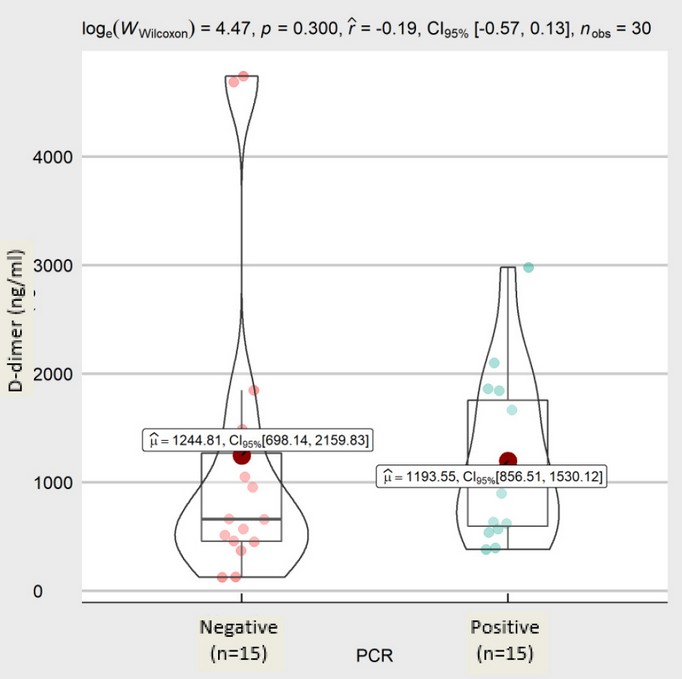
Figure 3. D-dimer comparison by PCR results for COVID-19
The CT score, ferritin, and D-dimer variables were considered to determine if they could be positive PCR predictors for COVID-19.
Targeted evaluation of the area below the ROC curve to estimate positive PCR results for COVID-19 was for a CT score of 0.776 (0.613-0.938) and ferritin 0.742 (0.551-0.933). These areas showed confidence intervals that do not include the value 0.5, which proved to be significant to predict positive PCR for COVID-19, whereas the D-dimer, whose area under the curve was 0,613 (0,402-0,825), was not significant. (see Figure 4)
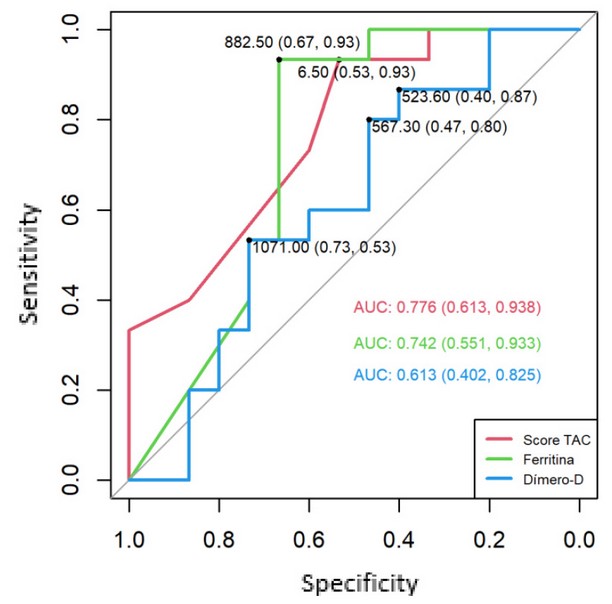
Figure 4. ROC curve to predict positive PCR for COVID-19, based on CAT score, ferritin, and D-dimer
Based on the ROC curve, the cut-off points for CT scores were established at seven (7), while for ferritin at 883 ng/ml.
For the CT score cut-off point, PCR was considered as positive if it was ≥ 7; otherwise, PCR was considered negative, resulting in a sensitivity of 93.33%, specificity 53.33%, PPV 66.67% (positive predictive value: likelihood of disease if a positive test result is obtained), NPV 88.89%(negative predictive value: the probability that a person with a negative test result is healthy), accuracy 73.33%. Besides, an odds ratio suggests that patients with CT score ≥ 7 are 16 times more likely to have a positive PCR result for COVID-19 than those reporting CT score <7.
On the other hand, the ferritin cut-off point was considered as PCR positive if this was ≥ 883; otherwise, it was deemed to be negative. Sensitivity obtained was 93.33%, specificity 66.67%, PPV 73.68%, NPV 90.91%, accuracy 80%, the odds ratio at cut-off point was significant. This indicates that patients with ferritin ≥ 883 ng/ml are 28 times more likely to have a positive PCR result for COVID-19 as compared to patients with ferritin <883 ng/ml.
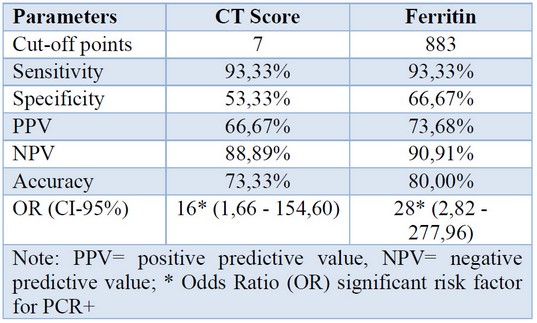
Table 2. Diagnostic test parameters for positive PCR results for COVID-19, based on CT score cut-off points and ferritin.
Through logistic regression, the multivariant relationship and predictive model for PCR positive COVID-19 were determined, based on the CT score cut-off points and ferritin.
The results showed that the CT score cut-off points p-value 0,008 and ferritin p-value 0,003 were positive PCR predictors for COVID-19, where CT score values ≥7 and ferritin ≥ 883 were 53,51 and 80,18 times more likely to present positive PCR for COVID-19.

Table 3. Logistical regression to predict positive PCR for COVID-19.
The logistic regression equation based on the βi coefficients and the cut-off points of the CT score and ferritin, as well as the constant of the model, allowed to predict the group membership, i.e. positive or negative PCR for COVID-19, where the concordance of results was obtained in 90%.
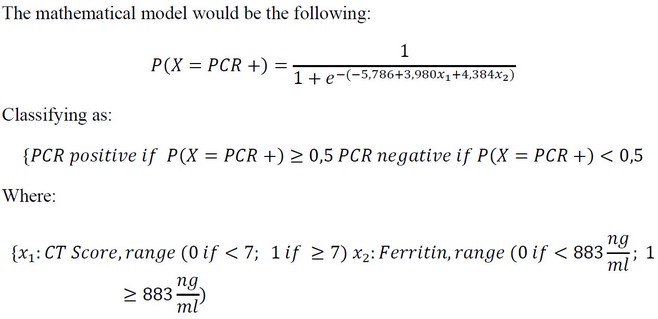
The prognosis or classification, based on the regression model, resulted in a sensitivity of 86.67%, specificity 93.33%, PPV 92.86%, NPV 87.50%, accuracy 90%.
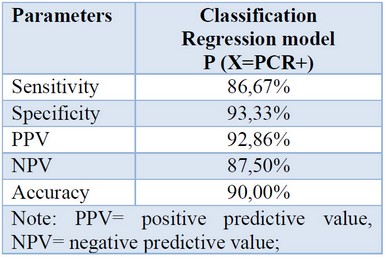
Table 4. Diagnostic test parameters for positive PCR COVID-19 based on the logistic regression model
DISCUSSION
In the current SARS COV 2 pandemic, around 80% of infected patients have mild disease symptoms and recover after 2-3 weeks. In severe patients, lung impact develops between days 7 and 10; the severity of the disease is mainly due to cytokine release inflammatory syndrome ('cytokine storm'). This is where typical tomographic findings, established as patterns for diagnosing COVID 19 disease, are evidenced. Once infected patients progress to acute respiratory distress syndrome (ARDS), more than 10% of them worsen within a short period and die of multiple organ failure.
Severe cases of COVID-19 are presented primarily in males over the age of 50. In our study, we replicate this data with a predominance of the male sex and an average age of 52. The comorbid factors associated with severe disease are arterial hypertension, diabetes mellitus, pneumopathy, and obesity - factors found in the population studied in our series. 7
The gold standard diagnostic test for COVID-19 is the RT-PCR, which was taken as a comparator of the CT image score, built for the study. Typical image characteristics include interstitial pattern, extensive consolidation with multifocal ground glass images, bilateral involvement, peripheral or subpleural distribution, rear, and lower lobe predilection, and multiple lesions. Based on these patterns, we set a score for the diagnostic imaging of this disease. 8
As for imaging scales, the CO-RADS scale, used by medical imaging specialists, assesses COVID-19 pulmonary involvement with the help of chest CT and provides good predictive performance in patients with moderate to severe symptoms. But as clinicians, we have found it imperative to present a different way to score image findings simply, in real-time and without the strict necessity for a physician specializing in imaging; the tool, which allows to have diagnostic certainty and to make clinical-therapeutic decisions and the one that has results adequately correlated with the RT-PCR test, providing an additional instrument for the clinical physician in charge of the first-line care in the current pandemic. 9
The CT score cut-off point was determined to be ≥7, with an odds ratio of 16, i.e., patients who achieve this score are 16 times more likely to have a positive PCR for COVID-19 than those with lower values, with high sensitivity values (93.3%) and negative predictive value (88.89%). This data correlates with international studies such as Ai et al. and Fang et al., which demonstrated in 1014 and 51 patients respectively, the usefulness of CT concerning RT-PCR with high sensitivities of 97% and 98%. 10, 11
There are patients with typical COVID 19 tomographic patterns, with negative PCR tests; if the clinic is reliable, this could correspond to false-negative results, and it could be explained by the variety of types of tests on the market available for the detection of this virus, the variation in the detection rate by different manufacturers, and a low viral load on the patient. Considering that in most cases, patients go to ED when the disease presents symptoms of pulmonary involvement; this happens when viral load is sometimes undetectable in the upper respiratory tract. Another inconvenience could be an inadequate clinical sample, since, as well as many other tests; this one is also centered around the dependent operator framework.
In this context, obtaining a CT scan will help us support early diagnosis and faster patient classification, even if the RT-PCR test is not reported or available or when the PCR result is negative and clinical suspicion is high. 12
As for diagnostic biomarkers and laboratory forecasts, ferritin is the predictor of the hyperinflammatory state given by the cytokine storm, and the D-dimer is the marker for identifying the procoagulant state of the blood system in infected patients.
In our research, the cut-off point found for ferritin was ≥ 883 ng/ml, the odds ratio being at 28 at the significant cut-off point, which implies that patients with these ferritin values are 28 times more likely to have a positive PCR for COVID-19 as compared to the ones with ferritin <883 ng/ml; high sensitivity (93.33%) and negative predictive value (90.91%).
In two studies conducted in China by Wang et al. and Sun et al., 13,14 severe patients showed serum ferritin values > 800 µg/L, reporting significant differences between mild and too severe groups. Besides, high levels of D-dimer were found in severe and too severe patients. To sum up, these studies showed a correlation between gravity and high inflammatory biomarkers.
Our data reveal correspondence comparing them to the studies mentioned above regarding ferritin cutting values, with a very similar cut-off point. However, concerning the D-dimer, they differ with the other findings since we did not find any statistical association between the RT-PCR and the D-dimer.
Finally, employing logistic regression, the multivariate relationship was determined with the cut-off points of the CT score (≥7) and ferritin (≥ 883 ng/ml), which determine the OR of 53.51 and 80.18 respectively, the high value of OR can be explained by the small sample. In the predictive model, generated by the logistic regression equation, the model-based classification yielded a sensitivity of 86.67%, specificity 93.33%, PPV 92.86%, NPV 87.50%, accuracy 90%, i.e., the two tests give a high diagnostic probability of COVID-19, turning the finding into a tool of high diagnostic value.
The limitation of our work, being a pilot study, was the size of the sample, but this analysis may be the starting point for new studies on this subject with a broader sample that could analyze other variables and healthy outcomes, such as mortality.
CONCLUSION
The tomographic score, created for this pilot study, yielded promising results; it provided an excellent diagnostic correlation with the RT-PCR with a cut-off point greater than or equal to 7 and, being augmented with the ferritin biomarker with values equal to or greater than 883 ng/ml, and thus reached a predictive diagnostic level.
It becomes mandatory to expand the sample of this study to verify if the results are replicated. For the time being, we will add the score to our hospital's diagnostic arsenal to facilitate the diagnosis and treatment of this disease.
REFERENCES
- Mcintosh, K. UpToDate. [Online]. Available from: https://www.uptodate.com/contents/coronavirus-disease-2019-covid-19-clinical-features?search=covid&source=search_result&selectedTitle=1~150&usage_type=default&display_rank=1 [Accessed 17 August 2020].
- Salehi, S, Abedi, A, Sudheer, B, Gholamrezanezhad, A. Coronavirus Disease 2019 (COVID-19): A Systematic Review of Imaging Findings in 919 Patients Read More: https://wwwajronlineorg/doi/102214/AJR2023034. American Journal of Roentgenology. [Online] 2020;215(1): 87-93. Available from: https://doi.org/10.2214/ajr.20.23034 [Accessed 17 August 2020].
- Farias Lucas de Pádua Gomes de, Strabelli Daniel Giunchetti, Fonseca Eduardo Kaiser Ururahy Nunes, Loureiro Bruna Melo Coelho, Nomura Cesar Higa, Sawamura Márcio Valente Yamada. Thoracic tomographic manifestations in symptomatic respiratory patients with COVID-19. Radiol Bras [Internet]. 2020 Aug [cited 2020 Aug 17] ; 53( 4 ): 255-261. Available from: http://www.scielo.br/scielo.php?script=sci_arttext&pid=S0100-39842020000400255&lng=en. Epub July 15, 2020. https://doi.org/10.1590/0100-3984.2020.0030.
- Yang, Z, Tao, A, Hou, H, Zhan, C.H, Chen, C.H. Correlation of Chest CT an RT-PCR Testing for Coronavirus Disease 2019 (COVID-19) in China: A Report of 1014 Cases. Radiology. 2020;296(2): 32-40. Available from: https://doi.org/10.1148/radiol.2020200642 [Accessed 16 August 2020].
- Xie, X, Zhong, Z, Zhao, W, Zheng, C.H, Wang, F. Chest CT for Typical Coronavirus Disease 2019 (COVID-19) Pneumonia: Relationship to Negative RT-PCR Testing. Radiology. [Online] 2020;296(2): 41-45. Available from: https://doi.org/10.1148/radiol.2020200343 [Accessed 17 August 2020].
- Sana Salehi, Aidin Abedi, Sudheer Balakrishnan, and Ali Gholamrezanezhad. Coronavirus Disease 2019 (COVID-19): A Systematic Review of Imaging Findings in 919 Patients. American Journal of Roentgenology 2020 215:1, 87-93. Available from: https://www.ajronline.org/doi/full/10.2214/AJR.20.23034
- Chen G, Wu D, Guo W, Cao Y, Huang D, Wang H, et al. Clinical and immunological features of severe and moderate coronavirus disease 2019. J Clin Invest. 1 de mayo de 2020;130(5):2620-9.
- Zu ZY, Jiang MD, Xu PP, Chen W, Ni QQ, Lu GM, et al. Coronavirus Disease 2019 (COVID-19): A Perspective from China. Radiology. 2020;296(2):E15-25.
- Prokop M, van Everdingen W, van Rees Vellinga T, Quarles van Ufford H, Stöger L, Beenen L, et al. CO-RADS: A Categorical CT Assessment Scheme for Patients Suspected of Having COVID-19-Definition and Evaluation. Radiology. 2020;296(2):E97-104.
- Ai T, Yang Z, Hou H, Zhan C, Chen C, Lv W, et al. Correlation of Chest CT and RT-PCR Testing for Coronavirus Disease 2019 (COVID-19) in China: A Report of 1014 Cases. Radiology. 2020;296(2):E32-40.
- 10. Fang Y, Zhang H, Xie J, Lin M, Ying L, Pang P, et al. Sensitivity of Chest CT for COVID-19: Comparison to RT-PCR. Radiology. 19 de febrero de 2020;296(2):E115-7.
- Rubin GD, Ryerson CJ, Haramati LB, Sverzellati N, Kanne JP, Raoof S, et al. The Role of Chest Imaging in Patient Management during the COVID-19 Pandemic: A Multinational Consensus Statement from the Fleischner Society. Radiology. 7 de abril de 2020;296(1):172-80.
- Wang F, Hou H, Luo Y, Tang G, Wu S, Huang M, et al. The laboratory tests and host immunity of COVID-19 patients with different severity of illness. JCI Insight. 21 de 2020;5(10).
- Sun Y, Dong Y, Wang L, Xie H, Li B, Chang C, et al. Characteristics and prognostic factors of disease severity in patients with COVID-19: The Beijing experience. J Autoimmun. 1 de agosto de 2020;112:102473.
Received: 20 August 2020
Accepted: 28 September 2020
Jorge Luis Vélez-Paez2,3, Rafael Salazar-Montesdeoca1, Juan Pablo Echeverría1, Steffy Reinthaller-Subía1, Sebastián Vásquez-Barzallo1, Andrea Villegas-Polanco1, Santiago Xavier Aguayo-Moscoso2
1.Emergency Department-Pablo Arturo Suárez Hospital.
2.Critical Care Service-Pablo Arturo Suárez Hospital.
3.Medical Science School-Central University of Ecuador.
2.Critical Care Service-Pablo Arturo Suárez Hospital.
3.Medical Science School-Central University of Ecuador.
Jorge Luis Vélez Paez. Universidad Central del Ecuador-Hospital Pablo Arturo Suárez. (ORCID https://orcid.org/0000-0002-6956-4475), mail: [email protected]
Santiago Xavier Aguayo Moscoso. Hospital Pablo Arturo Suárez. (ORCID: https://orcid.org/0000-0003-4919-5497), mail: [email protected]
Franklin Rafael Salazar Montesdeoca. Hospital Pablo Arturo Suárez. (ORCID: https://orcid.org/0000-0003-2941-5528), mail: [email protected]
Juan Pablo Echeverría Echeverría. Hospital Pablo Arturo Suárez. (ORCID: https://orcid.org/0000-0003-1367-9692), mail: [email protected]
Steffy Mercedes Reinthaller Subia. Hospital Pablo Arturo Suárez. (ORCID: https://orcid.org/0000-0003-2941-5528), mail: [email protected]
Andrea Patricia Villegas Polanco. Hospital Pablo Arturo Suárez. (ORCID: https://orcid.org/0000-0002-7787-9872), mail: [email protected]
Sebastian Patricio Vasquez Barzallo. Hospital Pablo Arturo Suárez. (ORCID: https://orcid.org/0000-0001-9174-9989), mail: [email protected]
Correspondign author: Dr. Jorge Luis Vélez Páez. Medical Science School – Central University of Ecuador Iquique N14-121 y Sodiro – Itchimbía, El Dorado. Telephone: (593-02) 2528 690 E-mail: [email protected]
