2023.08.01.86
Files > Volume 8 > Vol 8 No 1 2023
Dynamic fluctuation of the tropospheric height over Baghdad city

Hussain Abodi Nemah1,*, Nagham Abbas Mohammed2, Khawla Nihad Zaki3 and Iqbal H. Abdulkareem4
1 Department of Atmospheric Science, College of Science, Mustansiriyah University, Iraq.
2 Department of Atmospheric Science, College of Science, Mustansiriyah University, Iraq.
3 Department of Atmospheric Science, College of Science, Mustansiriyah University, Iraq.
4 University of Babylon, Faculty of Graduate Studies, Babylon, IRAQ.
* Correspondence: [email protected]
Available from: http://dx.doi.org/10.21931/RB/2023.08.01.86
ABSTRACT
Troposphere height has extensive interaction with other atmospheric components; it gives a good indication of what happened inside; therefore, this work tried to investigate the heat rate effect on troposphere height, especially after the global warming intensity and increased temperature degree rate along the time; thus the study covered 13 years to understand the real behavior of troposphere. Data for this work was given from the European center for medium-range weather forecasting (ECMWF) over Baghdad city, the result showed that there is a fluctuation in troposphere height, and the difference between a higher and lower point in winter was about (120 m), and that was higher than its rate on summer which was about only (30 m), also the result denoted that the fluctuation frequency becomes lower in the late of the study period. On the other side, the study found that the coherence between temperature and troposphere height fluctuation becomes higher in summer than in winter. Still, in general, the troposphere height recorded an increasing trend over time of the study period.
Keywords: Troposphere height, Temperature, Baghdad city, ECMWF, Seasonal variation.
1INTRODUCTION
The Troposphere layer is one of four layers involved in the atmosphere shown in figure 1, and it has a significant impact on atmospheric conditions; it is related to other atmospheric variables it can depend on to understand the current weather condition according to its height. The troposphere height varies according to its geographic location, and many studies showed that it becomes higher in tropical regions. In contrast, it becomes lower in the poles because of the earth's shape 1.
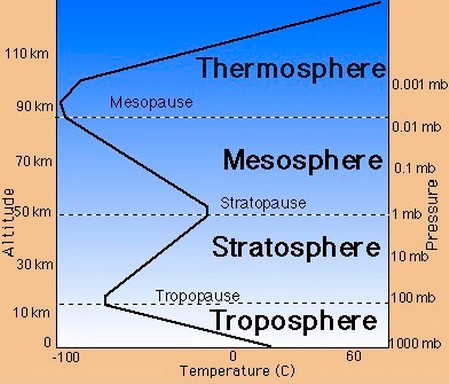
Figure 1. Atmospheric layers
The type of orographic surface affects the height of the troposphere because of its effect on the air column height above the surface; therefore, it leads to various height values of troposphere layer tops 2. Also, the seasonal conditions, such as weather systems, including cyclones, anticyclones, troughs, ridges, and jet streams, have broad correlations with troposphere height because of their impact on sea surface level and wind direction 3. It is worth saying that the dynamical equations are a perfect description of understanding the movement of the atmospheric air parcel. These equations depend on temperature degree as an input to calculate the thickness of layer 4.
dz= -RT dp/ MPg ………………….. (1)
Where:
dz: is the total layer height from the surface.
R: is the gas thermodynamic constant.
T: layer temperature.
dp: is the pressure changed.
M: is the molar mass.
g: is the gravity.
So the above equation can be applied to calculate the troposphere height by computing it thickness from the surface depending on the mean temperature of the layer itself, therefore the idea of this work become to seek the effect of global warming and the increase in atmospheric temperature on the troposphere height along 13 years period, especially if we know that the earth surface temperature becomes higher as a result of greenhouse gases effect that becomes higher in the corresponding industrial revolution 5.
Many studies focused on the troposphere layer and its interactions with atmospheric variables, some studies deepened on statistical methods, and other studies depended on analytic methods, while some recent studies used numerical way; for example, 6 used the statistical way to correlate between high-velocity wind current with troposphere height using correlation equations to understand the behavior of troposphere layer in corresponding with wind speed flow 6. Scientist 7 did research based on analyzing meteorological maps over one decade to show the height variation of the troposphere in four seasons to analyze the deviation and correlate it with atmospheric waves 7. another study was done by 8. It was based on the numerical method of solving numerical equations using advanced accurate computer systems by inputting the troposphere and sea surface height to predict some future atmospheric parameter status 8. Like the previous study, scientist 9 attempted to correlate the troposphere height and some atmospheric phenomena over (30) years; he found that the highest impact was from monsoon rain in winter.
-Waste that does not require spatial treatment but is collected and sorted according to its nature
water can be reused in industrial processes without being wasted in water sources.
MATERIALS AND METHODS
The troposphere height and surface temperature were calculated from monthly data given by (ECMWF) for Baghdad city in the period from (1990) to (2003), so this study depended on statistical calculations to get seasonal and annual averages for each year separately. Then the study tried to examine and analyze the relationship between the troposphere height and surface temperature over Baghdad and their fluctuation over time, especially under the effect of the increase of global warming over time.
RESULTS
The effectiveness of sugarcane beads in improving the specifications of water contaminated with This study was based on data given by the European center for medium-range weather forecasting. The period extended for thirteen years, from (1990) to (2003) to examine the behavior of troposphere layer height yearly over Baghdad; the annual averages were calculated for each year of the study. This study also depended on surface data of temperature to inveterate whether there is a relation between the surface temperature and troposphere height. Therefore the survey obtained several related diagrams and statistical results to show their connection.
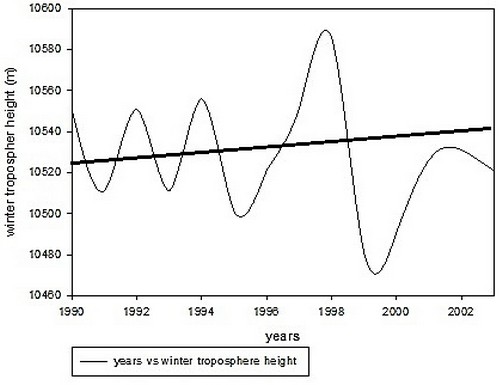
Figure 2. Troposphere height fluctuation with the trend overall study years in winter
When studying the fluctuation of troposphere height in summer seasons in figure (3), it was found that there was a difference in behavior as compared with winter, and this fluctuation in values was about (30) meters which were higher than it in winter. The change existed between (10800) meters and (10770) meters. The study found a similarity in behavior between summer and winter from the fluctuation of the first half of the study period from (1990) to (1998). Still, there is a difference between them for the second half of the study period (from 1998 to 2003) in opposition to the first one, and also, there was an increasing trend of the troposphere height over time.
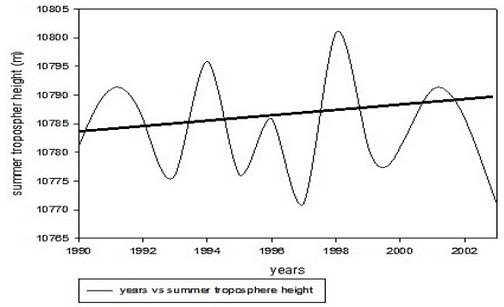
Figure 3. Troposphere height fluctuation with the trend overall study years in summer)
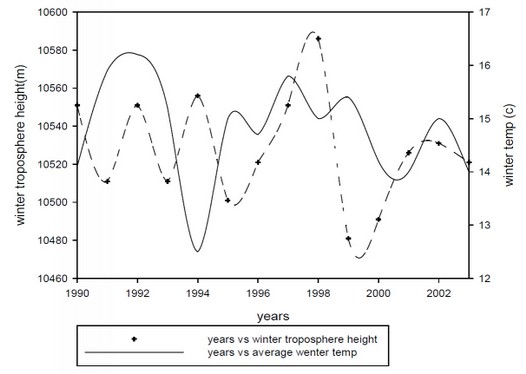
Figure 4. Relation between temperature and troposphere height along the study years in winter
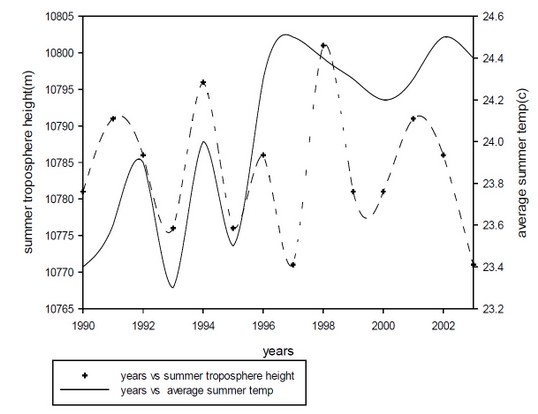
Figure 5. Relation between temperature and troposphere height along the study years in summer.
By attempting to understand the correlation between the change in troposphere height in summer and winter, the study reached a correlation between the difference in size between summer and winter, as shown in figure (6), where the fluctuation in the troposphere height is highly correlated between summer and winter with some differences. It's worth mentioning that most of the study years recorded higher values in height in summer compared to winter, as shown in figure (7), and this is an expected result caused by heat expansion for the air layer.
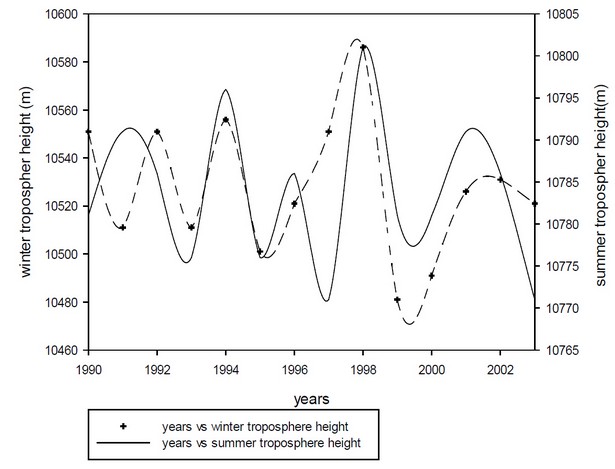
Figure 6. Comparison between troposphere height fluctuation in winter and summer
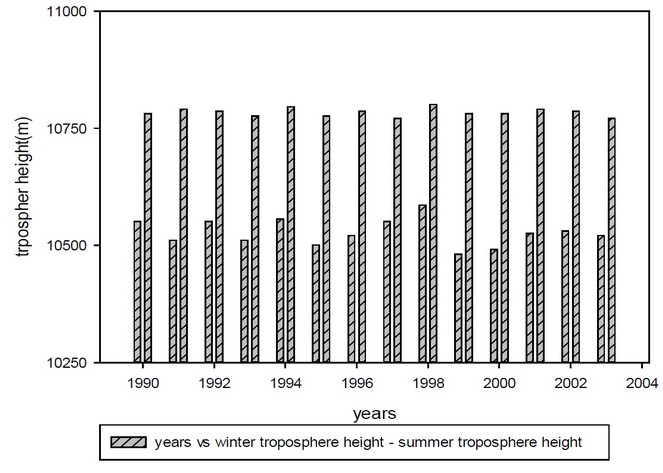
Figure 7. Troposphere height peak values comparison between winter and summer
DISCUSSION
When comparing the temperature degrees with troposphere height in winter, it's found that there is a simple correlation between them in figure (4), and this is less than it in summer; figure (5) refers to a more significant correlation, despite the increase of temperature degrees caused by global warming but the height of troposphere layer not affected at this period of study, and this show that the upper layer is less involving by surface temperature changes as compared with the lowest layers as it shown in recent studies 10. it is worth mentioning that many studies tried to correlate the pollutant emission and troposphere layer stability depending on the temperature effect on the air mass that varies between summer and winter 11. The study reached a correlation between the change in height between summer and winter, as shown in figure (12), by attempting to understand the correlation between the change in troposphere height in summer and winter. Besides, the fluctuation in the troposphere height is highly correlated between summer and winter with some differences. It's worth referring to that most of the study years recorded higher values in size in summer as compared with winter, as shown in figure (13), and this is an expected result caused by heat expansion for air layer14,15
CONCLUSIONS
Baghdad's surface temperature has increased over time as a result of global warming, and this fluctuation increment corresponds with the fluctuation of troposphere height along the study period from the year (1990) to the year (2003). Therefore the result showed that the heat-increasing rate affects the troposphere layer. The fluctuation of troposphere height in winter reach about (120 m) which is higher than its rate in summer, which reaches about (30) m, also the first (7 years) of study has a higher fluctuation frequency with a lower gradient as compared with rest late other years of the study that have lower frequency with higher gradient rate. The study found a similarity in the behavior between summer and winter from the fluctuation behavior in the first half of the study period to the second half. Also, the heat expansion of air caused by temperature increase led to a record higher value of summer troposphere height as compared with winter in all years, and worth to say that the troposphere has an increasing height trend overall over the time of the study period.
Acknowledgments
We want to thank the Laboratory of Mustansiriyah University.
REFERENCES
1. Hu, S., & Vallis, G. K. (2019). Meridional structure and future changes of tropopause height and temperature. Quarterly Journal of the Royal Meteorological Society, 145(723), 2698-2717.
2. Fu, Y., Ma, Y., Zhong, L., Yang, Y., Guo, X., Wang, C., & Wang, D. (2020). Land-surface processes and summer-cloud-precipitation characteristics in the Tibetan Plateau and their effects on downstream weather: a review and perspective. National Science Review, 7(3), 500-515.
3. Hall, R., Erdélyi, R., Hanna, E., Jones, J. M., & Scaife, A. A. (2015). Drivers of North Atlantic polar front jet stream variability. International Journal of Climatology, 35(8), 1697-1720.
4. Vallis, G. K. (2017). Atmospheric and oceanic fluid dynamics. Cambridge University Press.
5. Hussain, H. H., Nemah, H. A., & Sada, B. A. (2019). ESTIMATING SEASONS STARTING POINT TIME AS A RESULT OF CLIMATE CHANGE IMPACTION. Plant Archives, 19(2), 1525-1528.
6. Solomos, S., Kalivitis, N., Mihalopoulos, N., Amiridis, V., Kouvarakis, G., Gkikas, A., & Marenco, F. (2018). From tropospheric folding to Khamsin and Foehn winds: How atmospheric dynamics advanced a record-breaking dust episode in Crete. Atmosphere, 9(7), 240.
7. Böhm, J., Möller, G., Schindelegger, M., Pain, G., & Weber, R. (2015). Development of an improved empirical model for slant delays in the troposphere (GPT2w). GPS solutions, 19(3), 433-441.
8. Bauer, P., Thorpe, A., & Brunet, G. (2015). The quiet revolution of numerical weather prediction. Nature, 525(7567), 47-55.
9. Barnes, E. A., & Screen, J. A. (2015). The impact of Arctic warming on the midlatitude jet‐stream: Can it? Has it? Will it?. Wiley Interdisciplinary Reviews: Climate Change, 6(3), 277-286.
10. Nassif, W. G., Nemah, H. A., & Sada, B. A. (2020). STUDY OF GEOPOTENTIAL HEIGHT VALUES AND ITS INRACTION WITH TEMPERATURE DEGREE OVER BAGHDAD CITY, IRAQ. Plant Archives, 20(2), 1388-1391.
11. Roomi, T. O., & Abed, A. S. (2021). Estimating gaseous pollutants in the air near Daura Refinery, Daura Power Plant and South of Baghdad Power Plant by calculating the fuel discharge. Scientific Review Engineering and Environmental.
12. Ohmayed, K. H. .; Sharqi, . M. M. .; Rashid, H. M. . Comparison Of The Physical And Chemical Changes In Local Organic Waste After Cultivation Of The Ganoderma Lucidum Mushroom And Composting By Common Methods. Journal of Life Science and Applied Research. 2020, 1, 1-9.
13. Emad H. H. Alsalmany , TH. T. Mohammed. Effect of adding natural zeolite and vitamin E to diets of laying hens ( Lohman Brown) on some physiological traits and productive performance during hot weather. Revis Bionatura .2022;7(4) 12. http://dx.doi.org/10.21931/RB/2022.07.04.12.
14. Maysaloon W. Ibraheem, Abdulkhaliq A. Farhan, Sataa M. Salih, Th.T. Mohammed. Carcass characteristics of Awwasi lambs supplemented with Selenium and Vitamin D3. Iranian Journal of Ichthyology.2022, Vol 9, No. 1, pp: 355-359.
15. Alkubaisy,S.A., A.A. Majid, S.M. Abdulateef, F.A. Al-Bazy, O.K. Attallah, O.M. Abdualmajeed, Th. T. Mohammed, F.M. Abdulateef, K.I. Mahmud. Effects of In-Ovo injection of Biotin on chick's embryonic development and physiological traits. IOP Conference Series: Earth and Environmental Science.2021, 761(1), 012111
Received: January 15, 2023 / Accepted: February 25, 2023 / Published:15 March 2023
Citation. A.; Mohammed, N.A.; Zaki, K.N. Abdulkareem. I.H. Dynamical Fluctuation of Troposphere Height over Baghdad City. Revis Bionatura 2023;8 (1) 86. http://dx.doi.org/10.21931/RB/2023.08.01.86