2022.07.03.30
Files > Volume 7 > Vol 7 No 3 2022
Heart Rate Detection using a Piezoelectric Ceramic Sensor: Preliminary results

Eduardo Cepeda1 , Diego H. Peluffo-Ordóñez2,3
 , Paúl Rosero-Montalvo4
 , Miguel A Becerra5
 , Ana C. Umaquinga-Criollo6
 , and Lenin Ramírez1
1 School of Biological Sciences and Engineering. Yachay Tech University. Urcuquí-Ecuador; [email protected] [email protected]
2 Modeling, Simulation and Data Analysis (MSDA) Research Program, Mohammed VI Polytechnic University, Lot 660, Hay Moulay Rachid Ben Guerir, 43150, Morocco. [email protected]
3 Faculty of Engineering, Corporación Universitaria Autónoma de Nariño, Carrera 28 No. 19-24, Pasto, 520001, Colombia. [email protected]
4 IT University of Copenhagen, Denmark; [email protected]
5 Institución Universitaria Pascual Bravo, Medellín-Colombia; [email protected]
6 Técnica del Norte University, Ibarra-Ecuador; [email protected]
Available from: http://dx.doi.org/10.21931/RB/2022.07.03.30
ABSTRACT
Real-time vital signs monitoring, particularly heart rate, is essential in today's medical practice and research. Heart rate detection allows the doctor to monitor the patient's health status to provide immediate action against possible cardiovascular diseases. We present a possible alternative to traditional heart rate signal monitoring systems, a cardiac pulse system using low-cost piezoelectric signal identification. This system could benefit health care and develop continuous pulse waveform monitoring systems. This paper introduces a heartbeat per minute (BPM) cardiac pulse detection system based on a low-cost piezoelectric ceramic sensor (PCS). The PCS is placed under the wrist and adjusted with a silicone wristband to measure the pressure exerted by the radial artery on the sensor and thus obtain the patient's BPM. We propose a signal conditioning stage to reduce the sensor's noise when acquiring the data and make it suitable for real-time BPM visualization. As a comparison, we performed a statistical test to compare the low-cost PCS with types of traditional sensors, along with the help of 21 volunteers. Experimental results show that the data collected by the PCS, when used for heart rate detection, is highly accurate and close to traditional sensor measurements. Therefore, we conclude that the system efficiently monitors the cardiac pulse signal in BPM.
Keywords: Heart rate; Piezoelectric, BPM; Pulse Detection.
INTRODUCTION
Heart rate detection is critical for health care and plays a crucial role in preventing cardiovascular disease. In recent years, the number of people with cardiovascular problems has raised1. By studying these signals, diseases and physiological changes in the human body can be detected using sensors connected to a computer or heart rate system2. The radial pulse contains rich information about the human cardiovascular system3. Heart rate monitoring is of great importance in preventing disease. Increasing medical costs due to increased patients with noncommunicable diseases (NCD) have become a critical problem worldwide4. One of the main NCDs is cardiovascular disease.
Portable devices are convenient for monitoring biosignals and physical activities in daily life. Monitoring biosignals using portable devices can contribute to early disease detection5. Electrocardiography (ECG) is the established method to record the human heart rate6. Although several biomedical devices detect heart rate, a portable heart rate system based on piezoelectric identification could be a possible alternative to traditional sensors. In this paper, we propose a cardiac pulse system using PCS; this sensor is widely used in recent studies and fast processes. The PCS is used in studying pulsed disturbances of condensed media7 due to its high sensitivity, high robustness, and low cost8. In the last two decades, interest in developing new technologies with the use of piezoelectric sensors has expanded9. The need for a low-cost sensor is due to the high demand and low supply of these devices in cardiovascular disease prevention.
In the past, heart rate alteration was not considered one of the risk factors for cardiovascular disease, but now every doctor must have access to a heart rate measuring device to monitor the patient, as heart rate is the main factor influencing the effectiveness of heart disease treatment10. To ensure that the proposed system provides reliable results, we compared it with an XD-58C pulse sensor11 and an Innovo oximeter12, testing 21 volunteers between 19 and 22 years of age.
MATERIALS AND METHODS
The section details the materials used in developing the cardiac pulse system. The device detects the signal by piezoelectric identification, reduces signal noise, and amplifies the signal to observe the individual's BPM on LCD screen. Our main contribution to this paper is using a PCS for cardiac pulse measurement. The energy passing through the PCS is generated from slight body movements13. Piezoelectric sensors have already been used to measure a specific body part14. Figure 1 displays a block diagram of the procedure.
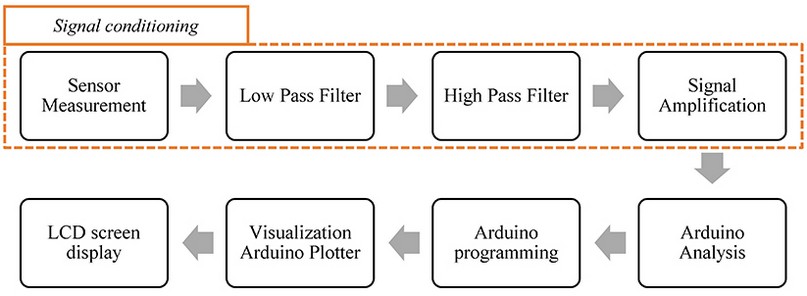
Figure 1. Block diagram representing the methodology. The pulse system design consists of four main stages: (a) electronic device design, (b) signal conditioning, (c) BPM evaluation, (d) results in visualization.
Subsection
Figure 2 displays the prototype design and its components: PCS, Arduino one, LCD screen, pass-band filter, and signal amplification. Figure 2 also shows the hardware connection: the incoming communication between the PCS and the Arduino (red arrow), and the outgoing communication between the Arduino and the LCD (yellow arrow)15. Table 1 describes the electronic item used16. Finally, Figure 3 shows the system developed in Proteus17.

Figure 2. Pulse system hardware using piezoelectric signal identification. The red arrow reflects the incoming communication to the Arduino, and the yellow arrow reflects the outgoing communication from the Arduino to the LCD.
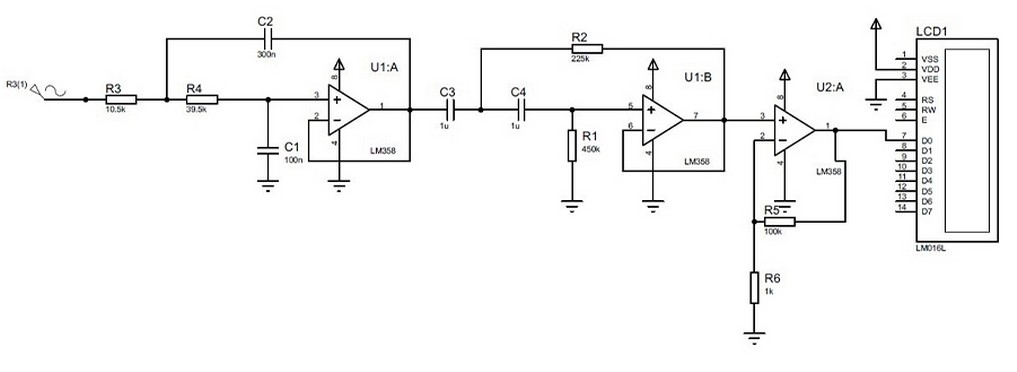
Figure 3. The pulse system's technical design, which includes the sensor signal input, resistors, capacitors, logic gates, and LCD display, was created in proteus software.
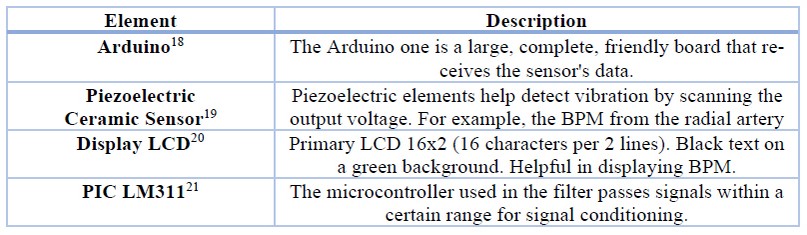
Table 1. Description of the electronic components of the pulse system.
Signal conditioning
We designed a bandpass filter and a signal amplifier to correct heart rate measurement and reduce the noise produced by the PCS. The bandpass filter consists of a low and high pass filter. Filter pass-through information limiters are used to limit the passage of specific frequencies located within a given bandwidth and to attenuate those outside this width22,23. Thus, we get a signal with less noise and an optimal appreciation for BPM calculation and measurement.
BPM measurement
According to to8, when the PCS undergoes slight deformation, electrical charges are generated in the sensor's flat area, and in this way, pressure changes in the sensor can be captured. When a person uses the PCS under the wrist, the sensor will suffer a slight deformation due to the movements generated by blood circulation in the radial artery. Once we obtain this pressure data through the PCS, this information has to be analyzed to measure the BPM of the person24. The BPM is calculated by obtaining the maximum points per minute of the filtered and amplified heart pulse wave from the PCS reading [Figure 2]. As shown in Figure 4, the radial artery originates along with the ulnar artery; this artery can be divided into three segments: the proximal segment in the forearm, the middle segment, and the distal segment that passes from the wrist to the dorsal side of the hand25. For the sensor to have optimal functionality, it must be placed over the radial artery in the distal part of the forearm, and the patient must be at rest so that sudden movements do not affect the signal obtained by the PCS.
Results Display
The cardiac pulse analysis is performed on an Arduino board, which allows us to add an LCD screen, and, together with our programming, shows the patient's BPM on the screen. Arduino Serial Plotter26, with the help of a computer, shows the heart rate wave in real-time. As shown in Figure 5-a, the heart rate wave without signal conditioning is difficult to analyze for measuring the BPM. Figure 5-b shows the heart pulse wave with signal conditioning that allows the BPM to be calculated. Figure 4 shows the correct PCS position to obtain the necessary information to measure the heart pulse.
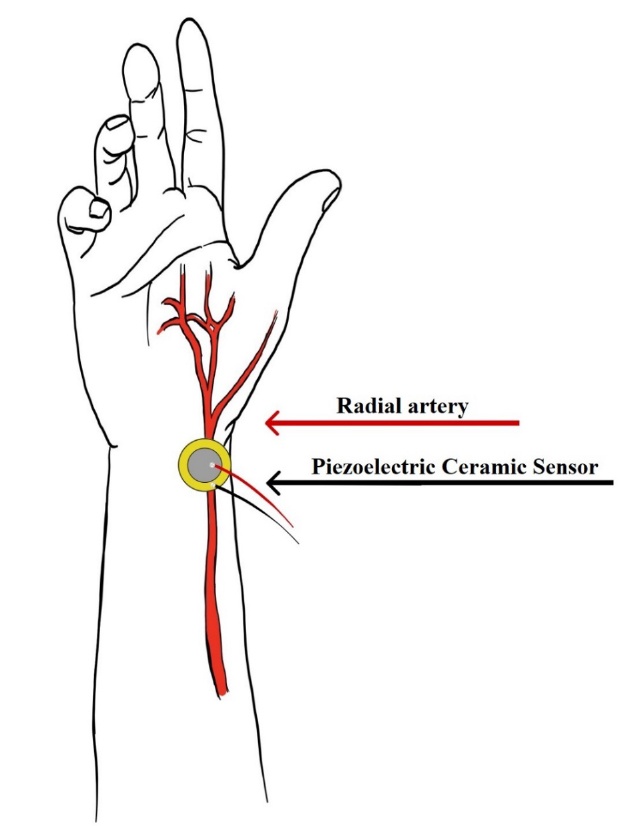
Figure 4. Proper placement of the piezoelectric sensor.
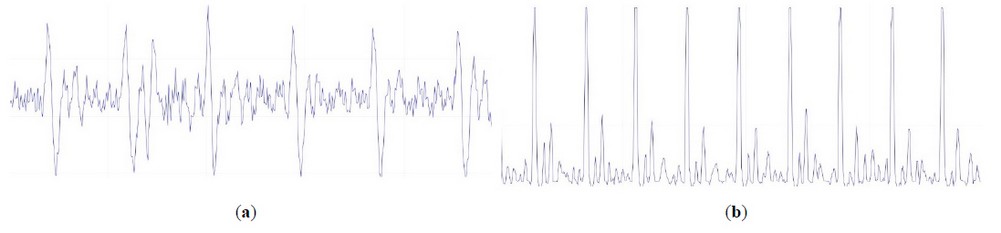
Figure 5. This figure shows the behavior of the signal, which changes due to the proper use of the bandpass filter to reduce noise efficiently. (a) Heart pulse wave without signal conditioning and (b) Heart pulse wave with signal conditioning plotted on Arduino serial plotter.
Experimental Framework
The data collected from volunteers between 19 and 22 years of age. It was chosen to employ a sample of healthy persons, in a defined age range, without preexisting diseases, decreasing the variability between age groups to study the reaction of the sensor versus commercial analogs. The PCS was placed on the radial artery with a flexible and comfortable silicone echo bracelet. The patient was seated and stayed comfortable while the heart rate measure was taken.
The patient does not move during the heart rate measurement because of the important relationship between the movement or the external manipulation of the sensor and the person under study. We compared each patient's heart rate using a table with the results from the PCS, the XD-58d heart pulse sensor, and the Innovo oximeter. We assess the quality of the measure using the Repeated Measures Analysis of Variance (rANOVA) statistical approach, which evaluates the differences between several variables' values27. It allows us to analyze the data and shows whether the PCS is statistically acceptable compared to traditional cardiac pulse measurement sensors.
RESULTS AND DISCUSSION
Data collection, BPM visualization, and statistical visualization
We assessed the heart rate of 21 participants between 19 and 22 years of age, who exhibited a positive evaluation of the data. Figure 6 displays the suggested pulse system and demonstrates that it successfully estimates the volunteer's BPM. The signal acquired by the piezoelectric behavior sensor estimates the pressure exerted by the blood circulating through the radial artery, so if this signal has a variation known as cardiac pulse, this signal has noise due to what passes through the band pass filter and ends up in the Arduino, which is in charge of displaying the individual's BPM on the LCD display. Table 2 presents the data received from participants at BPM.
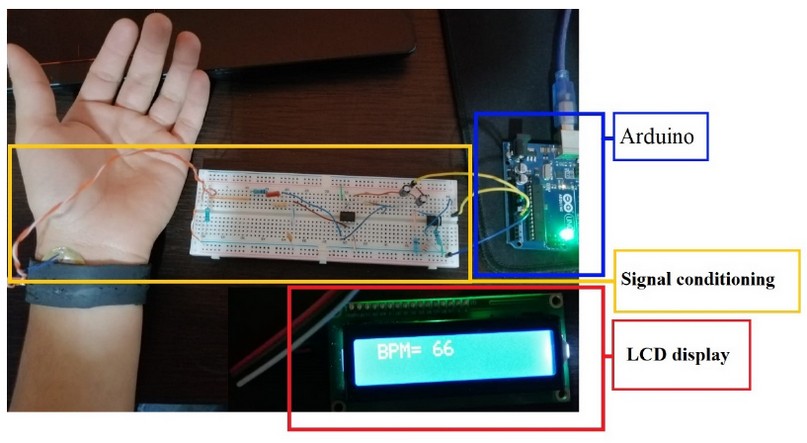
Figure 6. Location of the piezoelectric ceramic sensor attached to the silicone bracelet on the wrist. Signal conditioning stage, Arduino, and LCD screen displaying the BPM.
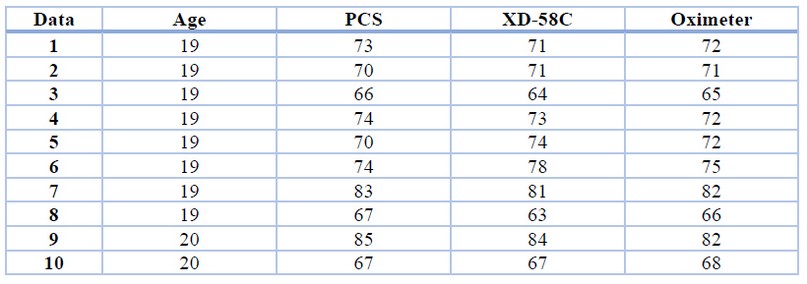
Table 2. BPM from patients between 19 and 22 years of age, measured with piezoelectric analysis, XD-58C pulse sensor, and Innovo oximeter.
Software is used to represent the results of sample data more optimally. Figure 7 shows a histogram of the patient's BPM. We infer that the data follow a normal distribution. Most of the recorded values are within the 70 to 80 BPM range.
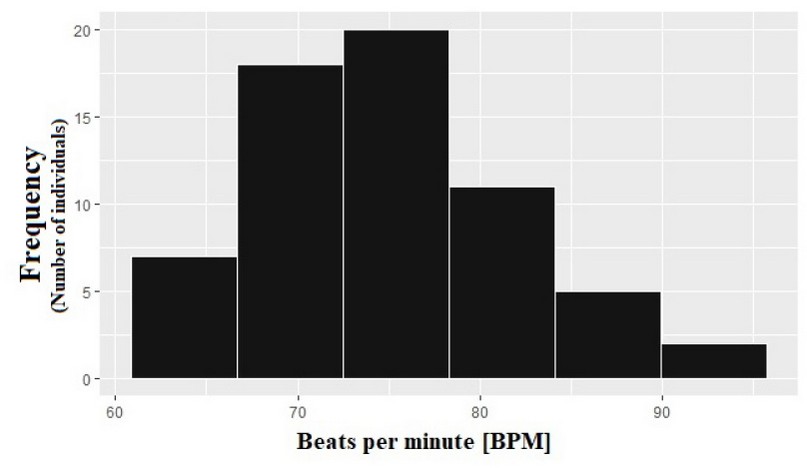
Figure 7. BPM Histogram; a normal data distribution is observed; thus, the ANOVA statistical method is carried out.
The measure of comparison and quality
We check the quality of the measurements using the repeated measures ANOVA (rANOVA) statistical method that validates the quality of the results. We compare the resulting F-value with the F-value from the distribution table. This comparison provides us with rich information about whether or not there is a good relationship between the measurements from the three types of sensors. Our null hypothesis proposes a relationship between the data from the three types of sensors, whereas our alternative hypothesis establishes that at least one the three types of sensors is significantly different from the rest.
By comparing the values from each sensor, we obtain an F value of 0.07; then, our null hypothesis is not rejected. This F value, when compared with the distribution table F value, with a statistical alpha significance of α = 0.05, shows that 0.07 = F < Fα = 3.52. This indicates that the test of the relationship between the three types of sensors that measure the pulse rate is statistically acceptable. We calculate the p-value in relation to the rANOVA statistical method using the R software environment, resulting in a p-value of 0.9326. Table 3 shows the results of the rANOVA, inferring that the PCS is optimal for cardiac pulse detection. Figure 8 offers a clearer view of why the null hypothesis is not rejected; there is a high probability that the data provided by the PCS are reliable.
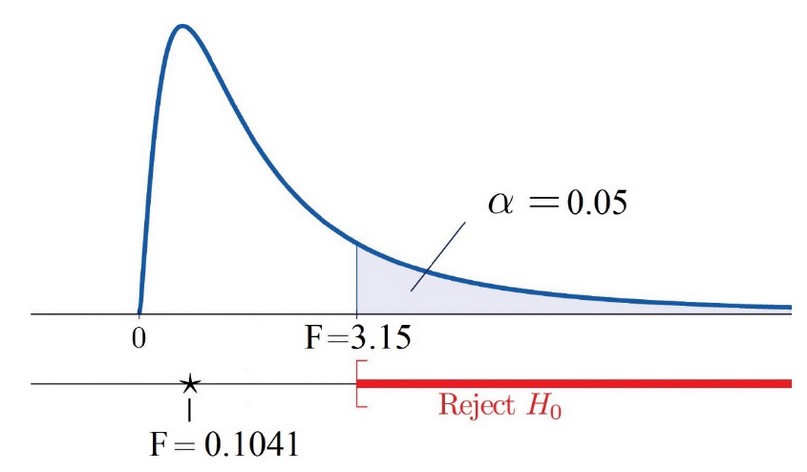
Figure 8. F-value is falling outside of the rejection region.
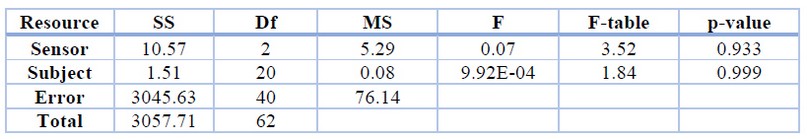
Table 3. Analysis of Variance ANOVA results.
Table 3. The subject F value of 9.92E-04 shows that the volunteers' data values are very consistent, probably, because of the age range of 19 to 22 years. Table 4 shows that the effect of going from the oximeter to the PCS is 1 BPM, which is considered statistically irrelevant; likewise, the effect of going from the XD-58C sensor to the PCS is 0.42 BPM and considered irrelevant.
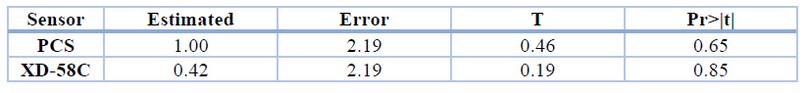
Table 4. Statistical Analysis.
We measured an effect size of 0.0035, which allows us to compare the sum of squares and relate the variance percentage affecting the response when we change from one sensor to the other. Thus, we observe a positive impact on the total variability that has changed from one sensor to the other.
Furthermore, we measured an effect size of 0.005 for the volunteers, indicating a relationship between the volunteers' variance with a minimum variance percentage. Thus, we conclude that the three sensors produce statistically equivalent results for every individual. So, there is no evidence from the statistical analysis that allows us to reject the null hypothesis.
The means of the measures from the three types of sensors are considered statistically similar, as the null hypothesis wasn't rejected. Figure 9 shows each sensor's measures using a box plot.
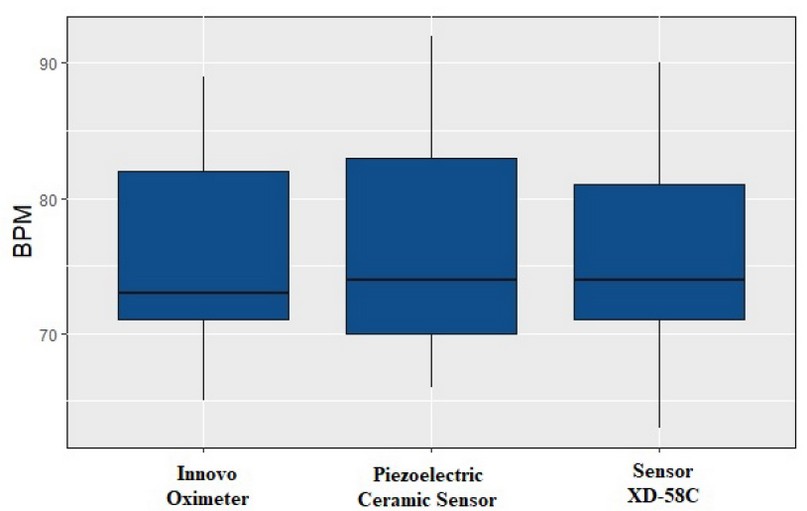
Figure 9. Statistical box plot. BOM was measured with the three types of sensors, two conventional ones for comparison with the piezoelectric ceramic sensor.
Figure 9 shows the comparison between the data from the three types of sensors; we estimate they are equivalent. Therefore, we conclude that the values registered by the PCS are statistically acceptable. In figure 9, all the collected data have been considered; there are no statistically unusual or strange values (outliers) that lead to readjustments. However, the PCS shows a slight increase in its BPM measures, which means that although the sensor is optimal for everyday use, it is still possible to improve it. The sensor's operation can be retouched and optimized for future work, either by hardware calibration or a software improvement. The slight increase is not significant for the analysis presented in this paper.
DISCUSSION
The proposed system was tested with statistical quality measurement methods and gave positive results when calculating the heart pulse beats per minute in BPM. Compared with traditional sensors that exist today, the PCS achieves reliable results in detecting and observing the patient's BPM. The main objective of this paper is to introduce a heart rate system that employs piezoelectric signal identification as an alternative to traditional sensors; according to the GUM guide28, based on the usual uncertainty error propagation rule, it offers us an uncertainty of 1.44 with 10 degrees of freedom, which suggests that the sensor may achieve the popular market level, given that the oximeter is the most marketed globally. However, due to the electromechanical properties of the PCS, the system works correctly under the following condition: the patient has to stay and maintain the sensor in its original position. The PCS has to remain unmoved during the heart rate detection because there is a strong relationship between the patient's movement and the heart rate detection. PCS indicates a little rise in its BPM readings, which suggests that while the sensor is appropriate for everyday usage, there is still potential for development, so for future work, the sensor performance may be tuned and enhanced, either by hardware validation or by software updating. As for the hardware, it is advised to use a Bakelite and add more elaborated stabilizers and filters for this purpose; on the other hand, a different software must be highly beneficial to make the data acquired more trustworthy despite the rapid movement that the human may make.
CONCLUSION
In this paper, we implement a heart rate system employing piezoelectric signal identification to detect a patient's heart rate. The primary motivation for developing the system was to propose a low-cost, portable and immediate solution to detect possible cardiovascular diseases; the innovator oximeter costs around $20 on the market; the suggested system without the Arduino costs less than or equivalent to $5 per unit since the electrical components used are meager cost as does its sensor, which costs less than 50 cents. It is a possible alternative to the current traditional sensor that detects the pulse signal. The proposed pulse system can monitor the heart rate in real-time and thus prevent cardiovascular diseases. We carried out an experiment with 21 patients to analyze the functionality and performance of the proposed pulse system, measures of comparison and quality were implemented, and these gave positive results; We propose a comparison between the PCS, the XD-58C pulse sensor, and the Innovo oximeter, demonstrating that the PCS is an exact and reliable heart rate sensor for continuous pulse monitoring.
We conclude that the system produces positive results for pulse rate monitoring as long as the patient does not manipulate the sensor while it is monitoring the data; the patient must not make any sudden movement not correct the device location. This heart rate system is essential for people who want to know their heart rate's current status and prevent cardiovascular diseases. An experienced doctor can read this data and reach meaningful conclusions. However, not everyone can detect abnormal values within the data; therefore, for future research, we propose improving the system so that anyone can recognize the signs of abnormal heart rates. We also propose adjusting the software or the hardware to correct the non-significant increase that the PCS of the heart pule shows at the time of measuring the BPM. Finally, we suggest fixing the wristband so that the sensor remains stable and measures the BPM despite sudden arm, hand or wrist movements.
Author Contributions: EC: conceptualization, methodology, software, validation, formal analysis, investigation, resources, data curation, writing-original draft preparation, DHPO, PRM, MAB, AUC, and LR: writing-review and editing, visualization, supervision, project administration. All authors have read and agreed to the published version of the manuscript.
Acknowledgments: This work is supported by SDAS Research Group (www.sdas-group.com).
Conflicts of Interest: The authors declare no conflict of interest.
REFERENCES
1. Callaway CW, Carson AP, Chamberlain AM, Chang AR, Knutson KL, Lewis TT, et al. Heart Disease and Stroke Statistics — 2020 Update A Report From the American Heart Association. 2020. 139–596 p.
2. Keat LC, Jambek AB, Hashim U. A Study on Real-Time Pulse Sensor Interface with System-on-Chip Architecture. 2016;281–6.
3. M SR, Rao R. Experimental investigation on the suitability of flexible pressure sensor for wrist pulse measurement. 2018;
4. Okano T. Multimodal Cardiovascular Information Monitor Using Piezoelectric Transducers for Wearable Healthcare. 2018;
5. Bennett JE, Stevens GA, Mathers CD, Bonita R, Rehm J, Kruk ME, et al. NCD Countdown 2030: worldwide trends in noncommunicable disease mortality and progress towards Sustainable Development Goal target 3.4. Vol. 392, The Lancet. 2018. p. 1072–88.
6. Lohani M, Payne BR, Strayer DL. A Review of Psychophysiological Measures to Assess Cognitive States in Real-World Driving. 2019;13:1–27.
7. Surkaev AL, Kul VG. Investigation of a Pulsed Waveguide Piezoelectric Pressure Sensor. 2006;52:218–21.
8. Peng M. Detection of Sleep Biosignals Using an Intelligent Mattress Based on Piezoelectric Ceramic Sensors †. 2019;1–17.
9. Jiao P, Egbe KI, Xie Y, Nazar AM, Alavi AH. Piezoelectric Sensing Techniques in Structural Health Monitoring : A State-of-the-Art Review.
10. Davidovic G, Iric-cupic V, Milanov S. Associated influence of hypertension and heart rate greater than 80 beats per minute on mortality rate in patients with anterior wall STEMI. 2013;6:358–66.
11. XD-58C Pulse Sensor | Open ImpulseOpen Impulse.
12. INNOVO Fingertip Pulse Oximeter User Manual - Manuals+.
13. Dagdeviren C, Joe P, Tuzman OL, Park K Il, Lee KJ, Shi Y, et al. Recent progress in flexible and stretchable piezoelectric devices for mechanical energy harvesting, sensing and actuation. Extrem Mech Lett. 2016;9:269–81.
14. Curry EJ, Ke K, Chorsi MT, Wrobel KS, Miller AN, Patel A, et al. Biodegradable piezoelectric force sensor. Proc Natl Acad Sci U S A. 2018;115:909–14.
15. Rosero-Montalvo PD, Peluffo-Ordonez DH, Lopez Batista VF, Serrano J, Rosero EA. Intelligent system for identification of wheelchair user's posture using machine learning techniques. IEEE Sens J. 2019;19:1936–42.
16. Vargas-muñoz AM, Chamorro-sangoquiza DC, Umaquinga-criollo AC. Diseño de un prototipo de bajo coste computacional para detección de arritmias cardiacas. 2020;470–80.
17. PCB Design and Circuit Simulator Software - Proteus [Internet]. [cited 2022 Apr 22]. Available from: https://www.labcenter.com/
18. Arduino Uno Rev3 — Arduino Online Shop [Internet]. [cited 2022 Apr 22]. Available from: https://store-usa.arduino.cc/products/arduino-uno-rev3/
19. Piezo Element - SEN-10293 - SparkFun Electronics [Internet]. [cited 2022 Apr 22]. Available from: https://www.sparkfun.com/products/10293
20. Basic 16x2 Character LCD - Black on Green 5V - LCD-00255 - SparkFun Electronics [Internet]. [cited 2022 Apr 22]. Available from: https://www.sparkfun.com/products/255
21. Differential Comparator - LM311 - COM-13950 - SparkFun Electronics [Internet]. [cited 2022 Apr 22]. Available from: https://www.sparkfun.com/products/retired/13950
22. Parente FR, Santonico M, Zompanti A, Benassai M, Ferri G, D'Amico A, et al. An electronic system for the contactless reading of ECG signals. Sensors (Switzerland). 2017;17:1–10.
23. Prutchi D, Norris M. Design of Safe Medical Device Prototypes. Design and Development of Medical Electronic Instrumentation. 2005. 97–146 p.
24. Cevallos A, Solórzano A. Stem cell activity in the repair of cardiovascular tissues. Rev Bionatura. 2019;4.
25. Scalise RFM, Salito AM, Polimeni A, Garcia-Ruiz V, Virga V, Frigione P, et al. Radial artery access for percutaneous cardiovascular interventions: Contemporary insights and novel approaches. J Clin Med. 2019;8.
26. Arduino - Home [Internet]. [cited 2022 Apr 22]. Available from: https://www.arduino.cc/
27. Schober P, Vetter TR. Repeated measures designs and analysis of longitudinal data: If at first you do not succeed-try, try again. Anesth Analg. 2018;127:569–75.
28. Pérez M del M. Estimación de incertidumbres. Guía GUM. Rev Española Metrol [Internet]. 2012;114,130. Available from: http://www.uv.es/~meliajl/Docencia/WebComplementarios/GuiaGUM_e_medida.pdf
Received: 30 April 2022 / Accepted:20 June 2022 / Published:15 Agoust 2022
Citation: E Cepeda, D H. Peluffo-Ordóñez, P Rosero-Montalvo, M A Becerra, A C. Umaquinga-Criollo, L Ramírez. Heart Rate Detection using a Piezoelectric Ceramic Sensor: Preliminary results. Revis Bionatura 2022;7(3) 30. http://dx.doi.org/10.21931/RB/2022.07.03.30