2023.08.03.81
Files > Volume 8 > Vol 8 No 3 2023
Correlation between the Ankle-Brachial Index and Body Mass Index in adult inpatients in the Internal Medicine ward of the University School Hospital of Honduras from May to July 2023

Andrea Agurcia1, Enoc Gonzalez1, Kelyn Vasquez1, Robersy Medina1, Marcio Madrid1,*, Carlos Santiago Pastelin1, Jose Isaac Zablah1, Antonio Garcia Loureiro2, Yolly Molina1, Salvador Diaz1, Carlos A. Agudelo1 and Jorge Valle-Reconco1
1 Facultad de Ciencias Médicas, Universidad Nacional Autónoma de Honduras (UNAH); [email protected], [email protected], [email protected], [email protected], [email protected], [email protected], [email protected], [email protected], [email protected], [email protected], [email protected]
2 Departamento de Electrónica y Computación, Universidad Santiago de Compostela, España; [email protected]
* Corresponding author: [email protected]; Tel.: (504) 2239-4292
Available from: http://dx.doi.org/10.21931/RB/2023.08.03.81
ABSTRACT
The ankle-brachial index (ABI) is a diagnostic tool to know the status of a patient in terms of peripheral vascular health. The body mass index (BMI) is another tool that helps health personnel know the patient's body composition. The data that have been considered are from 151 adult patients hospitalized in the internal medicine service of the University School Hospital. They found that the relationship between these two variables is weak; this is known through statistical techniques of probability study and correlation using the methods of Spearman and Pearson. It is concluded that ABI and BMI have a weak negative correlation. Additionally, age is not a factor that affects the ABI value since it can be affected by variables and conditions not considered in this study.
Keywords: ankle-brachial index; body mass index; peripheral vascular disease
INTRODUCTION
The ankle-brachial index (ABI) is a low-complexity measurement that allows critical decision-making in the medical field, with significant importance in assessing the health of peripheral vessels and the cardiovascular system. The early detection of peripheral vascular disease has become a public health problem in recent years as it occurs in lifestyle-related diseases, including metabolic syndrome, diabetes mellitus and high blood pressure. This indicator is based on the relationship between systolic blood pressure in the ankle and systolic blood pressure in the arm, so it is expressed as a quotient.1-4
ABI is essential because it can diagnose peripheral arterial disease (PAD), a pathology that affects the blood vessels that supply the extremities, especially the legs. DBP is a marker of an increased risk of cardiovascular disease and adverse events like heart attacks and strokes. The ABI can detect early arterial obstructions by assessing the decrease in blood pressure in the lower extremities compared to the upper extremities, allowing timely intervention. The ABI also acts as a valuable tool for monitoring the effectiveness of treatments and the progression of chronic vascular diseases, leading to the implementation of appropriate preventive and therapeutic strategies.3-6
The ABI is interpreted according to the value; if it is greater than or equal to 0.9, it is normal; if it is between 0.8 to 0.9, it is a slight decrease; from 0.6 to 0.7, it is a moderate decrease; and less than or equal to 0.6 it is a severe decrease. It is essential to mention that a low ABI value may indicate an increased risk of complications such as ischemia, gangrene, and amputation.1-2
Body mass index (BMI) is an anthropometric measure to assess an individual's nutritional status. The BMI, according to its values, classifies people by their weight, so that a person is underweight if the BMI is less than 18.5, with healthy weight if their BMI is between 18.5 and 24.9, and overweight if it is between 25 and 29.9 and in obesity if the BMI is greater than or equal to 30. Because of this, BMI is useful for identifying people with an increased risk of developing chronic diseases, heart disease, type 2 diabetes, and some cancers.7-10
This research shows the correlation between ABI and BMI, which has been analyzed using standard statistical techniques and compared using a pair chart. The structure of this article contains this introduction, a section on methodology, results, discussion, and conclusions.
MATERIALS AND METHODS
From a sample of 151 patients obtained by intentional non-probability sampling. Variables such as age, gender, weight, height, presence of chronic diseases such as type II diabetes mellitus and hypertension, and the value of the ankle-brachial index (ABI) and body mass index (BMI) have been captured. We have worked with a cross-sectional study design; the data were obtained between May and July of 2023 in the Internal Medicine ward of the University School Hospital in Tegucigalpa, Honduras.
The selection of patients for this study required meeting the following criteria: being hospitalized in the internal medicine ward, having blood chemistry of cholesterol and triglycerides, and voluntarily wishing to participate. The exclusion criterion for not being considered was being hospitalized for complications other than cardiovascular disease, not having cholesterol and triglyceride values in blood chemistry, or not wanting to participate.
The procedure to take the ABI begins by lying the patient on a stretcher with the legs extended; the blood pressure in each ankle and arm is measured, obtaining the systolic pressure of the posterior tibial arteries and brachial systolic pressure. This measurement should be performed for each ankle and arm, grouped by left and right sides. ABI is calculated by dividing posterior tibial systolic blood pressure and dorsal ask by brachial systolic pressure, using the lowest value of both legs as ABI.1-2
BMI is calculated by dividing a person's weight measured in kilograms by the square of their average height in meters; equation 1 describes that formula. take special attention to the units mentioned:
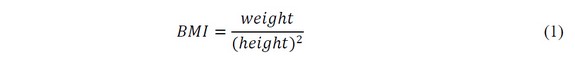
BMI is an indirect measure of how much body fat a person has, although it is not an exact measure as it can be affected by muscle mass, body water, and other factors.9-10
The Python v3.10.3 programming language and the Notepad++ v7.9.3 text editor have been used to perform the statistical analysis of the collected data. Multiple libraries were used, including Matplotlib v3.7 and NumPy v1.18.; Pandas v2.1, SciPy v1.10.1, Seaborn v0.12.2, among others. Part of this analysis has been supplemented with the MedCalc v19.7.1 64-bit application. All these applications have been run on a personal computer with Microsoft Windows 10 64bit operating system.11-13
RESULTS
ABI values have a median of 0.9 with a standard deviation of 0.1697, a maximum value of 1.4, and a minimum of 0.5. The primary BMI statistic shows a median of 25.39 with a standard deviation of 3.5972, a maximum value of 38.04, and a minimum of 11.98. Using the Kolmogorov-Smirnov normality test,14-15, it was found that ABI measurements reject normality with a D=0.1553 statistic (p<0.0001). In this same sense, the BMI does not meet the criteria of normality, with a value D = 0.0925 (p>0.10).
In terms of gender, these correspond to 89 women and 62 men. The median age for women is 61 years, with a standard deviation of 16.04, with a maximum age of 88 and a minimum of 22 years. For men, the median age was 56 years, with a standard deviation of 16.57, with a maximum age of 87 and a minimum of 19 years. According to the Kolmogorov-Smirnov normality test, age has a normal behavior with a D=0.1011 statistic (p>0.10). The data have been represented by histograms, as shown in Figure 1.
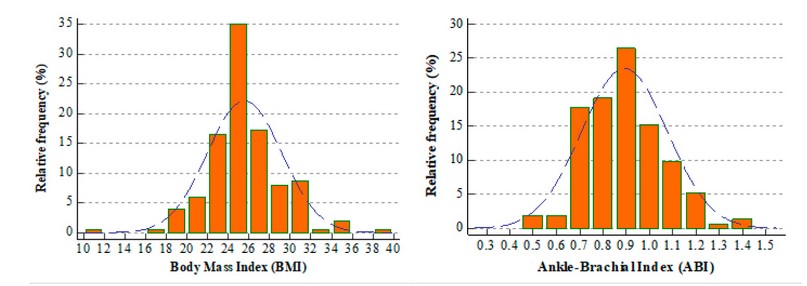
Figure 1. Histograms showing relative frequencies and values of BMI and ABI. The bell of the normal distribution is superposed as a guide.
The age values were compared with those of the ABI, for which a logarithmic transformation of the ABI data was necessary to normalize and correlate them correctly at the statistical level15. Pearson's correlation was used, where r=-0.0925 was obtained, indicating a very weak negative correlation, so the ABI values tend to decrease with age. Figure 2 shows the dispersion of age and ABI values throughout the sample (n=151), grouped by gender. 14 15
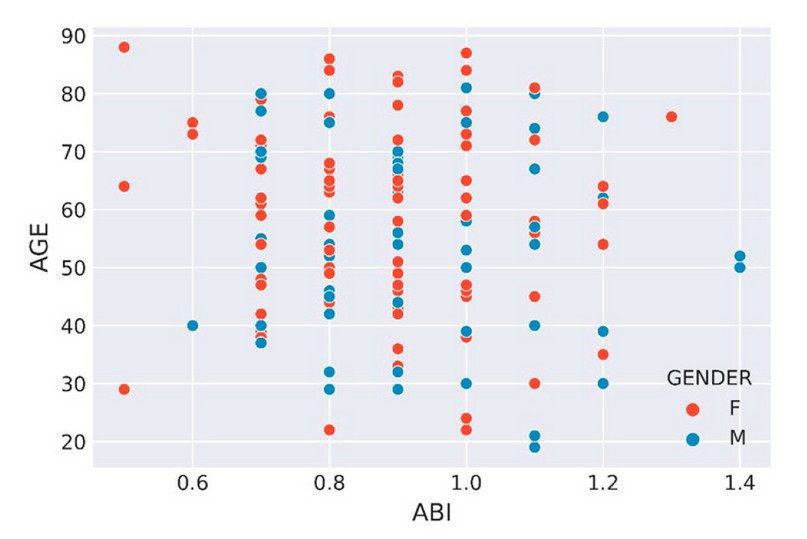
Figure 2. The scatter plot does not show a grouping trend of the ABI and AGE measurements; the distinction has been made in biological genera as an illustration.
At the beginning of this study, the hypothesis was maintained that there is a significant correlation between the ankle-brachial index (ABI) and the body mass index (BMI), suggesting that people with a higher BMI have a higher risk of developing alterations in ABI (with values less than 0.9). If so, this would confirm the relationship between obesity and peripheral vascular diseases and that this method would be helpful on its own to identify future health complications.
For the data of men who present concurrent altered values of BMI and ABI (n = 17), the Spearman correlation test between the BMI and ABI variable has been performed, which resulted in a correlation coefficient of r = -0.3321, indicating a moderate negative correlation between both variables. This means that as BMI increases, ABI tends to decrease. With a value of p = 0.1928, more significant than the significance level of p >0.05, the null hypothesis of no correlation between both variables cannot be rejected. However, the correlation coefficient is negative and significant at 95%, so it follows that there is a probable negative correlation between both variables. The above is shown in Figure 3.
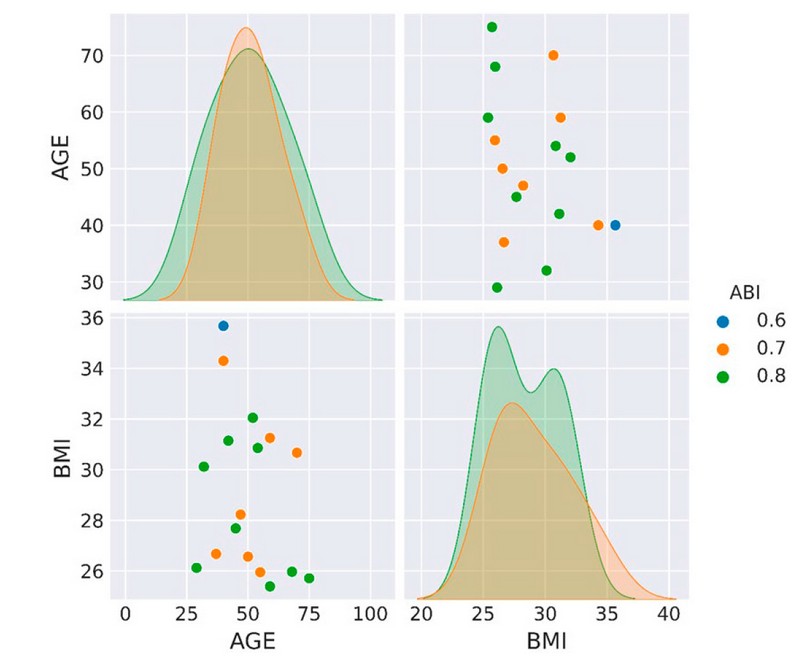
Figure 3. Pair diagram showing the distribution of the BMI and AGE variables data for men. The dots represent the discrete ABI values. Note that there is no apparent correlation.
For the data of women who present concurrent altered values of BMI and ABI (n = 20), the Spearman correlation test between the BMI and ABI variable has been performed and resulted in a correlation coefficient of r = -0.1584, which indicates a weak negative correlation between both variables. This means that as BMI increases, ABI tends to decrease slightly. With a value of p = 0.5047, which is higher than the significance level of p > 0.05, the null hypothesis that there is no correlation between both variables cannot be rejected. However, the correlation coefficient is negative and significant at 95%, so both variables probably have a slight negative correlation. There may be other variables that are affecting these measures. The above is shown in Figure 4.
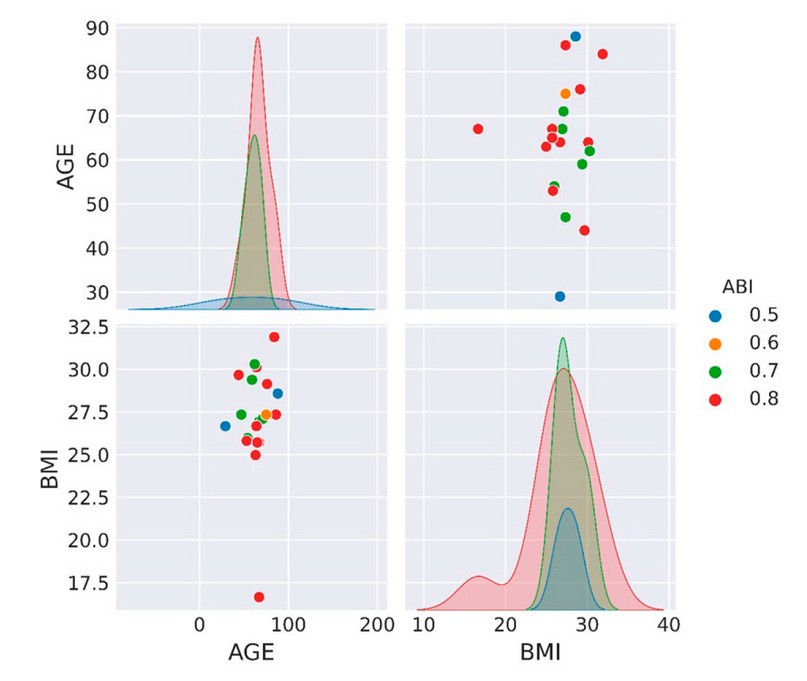
Figure 4. The pair diagram shows the BMI and AGE variables data distribution for women. The dots represent the discrete ABI values. Note that all BMI data are grouped into normal or elevated values.
DISCUSSION
From the initial sample of data for the male gender (n=62), they were divided into two groups: the first had a concurrent alteration of ABI and BMI (n=17). At the same time, the second was the rest (n=45), which had various alterations that complicated the analysis due to their variability. To compare the distribution of ABI and BMI values, the dispersions of both groups were plotted, as shown in Figure 5.
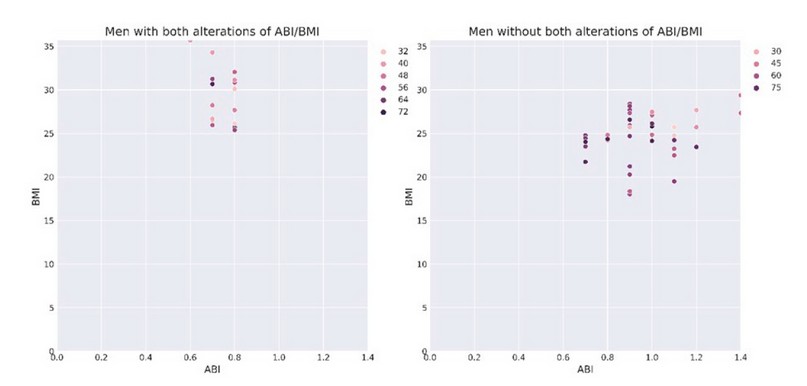
Figure 5. Dispersion of the data of men with concurrent altered BMI and ABI (left) and the data of the other elements of the sample (right).
When visually analyzing Figure 5, there is expected behavior in both groups, where it is observed that ABI alterations are not exclusive to people with abnormal BMI values. It is possible to have altered values of ABI by various variables and not exclusively because it is related to BMI.
For the female gender (n=89), they were equally divided into two groups; the first had a concurrent alteration of ABI and BMI (n=20). At the same time, the second was the rest (n=69) that had various alterations. When comparing the distribution of ABI and BMI values using a scatter plot where both groups will be shown, a different behavior was found than that observed in men. Figure 6 shows the distribution of data for women.
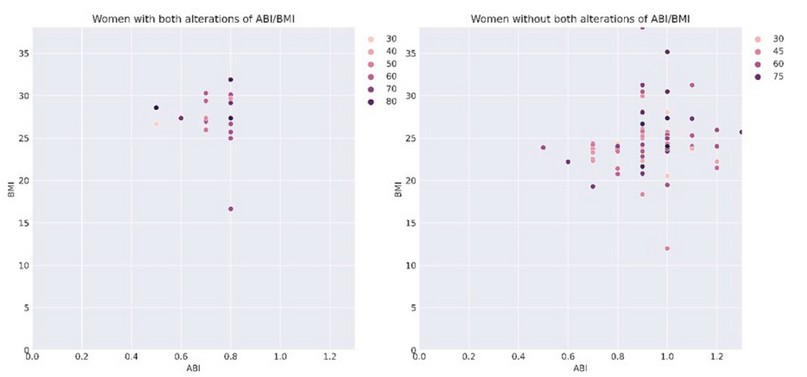
Figure 6. Dispersion of the data of women with concurrent altered BMI and ABI (right) and the data of the other elements of the sample.
This indicates that having a weak negative correlation value does not mean that BMI is a determinant in the altered values of ABI observed in the women participating in the study. There is evidence in the data that one can have an abnormal ABI even with average BMI values, confirming the weakness of the correlation mentioned above. Both groups have a behavior that is similar in the case of women. Thus, there may be social, economic, and health conditions that must be taken into account when studying women concerning ABI values.
The genetic group to which the participants belong likely influences the results since a study done in Ghana very similar to this one found a correlation between abdominal circumference and ABI alterations; according to this study, the participants had BMI alterations16. On the other hand, at least one study has been published in which contradictory correlations between BMI and ABI are mentioned. This conclusion is obtained when using a larger sample17. The data obtained when new to the geographical region represents the first measurement of the correlation of the study variables.
Regarding the correlation of age and ABI, the results obtained are consistent with a systematic study of ABI with more than 44590 participating subjects; it was found that if there are variations between gender and age, men have fewer alterations than women throughout life. It is mentioned in the same way as in this study that additional variables should be considered to understand the behavior of ABI values in patients18.
CONCLUSIONS
The results of the Spearman correlation test suggest a negative correlation between BMI and ABI, moderate for men and mild for women. It cannot be said with certainty that this correlation is causal since more studies would be needed to confirm it, and there are clinical suspicions that other variables may be affecting the measures. However, we must consider in future studies the conditions related to lifestyles, sedentary lifestyles, use of medications, pre-existing diseases, etc. It is important to note that correlation does not imply causation, and there may be at least a third variable that explains the relationship between BMI and ABI.
At a certain point in this study, age was considered an additional variable. However, this is not a preponderant condition for ABI values to tend to be lower in older people since these variables show a very weak negative correlation with age values. Therefore, age differences alone cannot be considered the sole cause of the alterations among patients in this study.
We found that the strength of correlations between ABI and BMI varies markedly between genders. The lifestyle of each gender likely caused the measurements to be very varied by unknown factors or not considered in this study. For the female gender, I present a lower correlation between ABI and BMI (r=-0.1584).
There is no single correlation for ABI as BMI does not have a strong correlation. It is necessary to consider using multiple measurements with different techniques to diagnose peripheral vascular disease to make a more accurate clinical decision. ABI alone, combined with BMI, does not yield conclusive data for health decisions; therefore, it should be combined with other diagnostic tools.
Supplementary Materials: The following are available online at www.revistabionatura.com/xxx/s1, Figure S1: title, Table S1: title, Video S1: title.
Supplementary Materials: They have not been provided.
Author Contributions: Conceptualization, Andrea Agurcia, Enoc Gonzalez, Kelyn Vasquez, and Robersy Medina; methodology, Carlos Santiago Pastelin, Yolly Molina Marcio Madrid; validation, Andrea Agurcia, Enoc Gonzalez, Kelyn Vasquez and Robersy Medina; formal analysis, Jorge Valle.; investigation, Yolly Molina and Salvador Diaz; data curation, Antonio Garcia Loureiro and Jose Isaac Zablah; writing—original draft preparation, Isaac Zablah and Carlos Agudelo; writing—review and editing, Carlos Agudelo and Salvador Diaz; supervision, Jorge Valle; All authors have read and agreed to the published version of the manuscript.
Funding: This research received no external funding.
Institutional Review Board Statement: Not applicable.
Informed Consent Statement: Not applicable.
Data Availability Statement: They have not been provided.
Acknowledgments: University School Hospital directorate and administration for their support of this study.
Conflicts of Interest: The authors declare no conflict of interest.
REFERENCES
1. Davies JH, Kenkre J, Williams EM. Current utility of the ankle-brachial index (ABI) in general practice: implications for its use in cardiovascular disease screening. BMC Fam Pract, 2014;15(1). DOI: 10.1186/1471-2296-15-69
2. Khan T, Farooqui F, Niazi K. Critical review of the ankle-brachial index. Curr Cardiol Rev, 2008;4(2):101–6. DOI: 10.2174/157340308784245810
3. Roth GA, Johnson C, Abajobir A, Abd-Allah F, Abera SF, Abyu G, et al. Global, regional, and national burden of cardiovascular diseases for 10 causes, 1990 to 2015. J Am Coll Cardiol, 2017;70(1):1–25. DOI: 10.1016/j.jacc.2017.04.052
4. Kassebaum NJ, Arora M, Barber RM, Bhutta ZA, Brown J, Carter A, et al. Global, regional, and national disability-adjusted life-years (DALYs) for 315 diseases and injuries and healthy life expectancy (HALE), 1990–2015: a systematic analysis for the Global Burden of Disease Study 2015. Lancet, 2016;388(10053):1603–58. DOI: 10.1016/s0140-6736(16)31460-x
5. Suominen V, Uurto I, Saarinen J, Venermo M, Salenius J. PAD as a risk factor for mortality among patients with elevated ABI – A clinical study. Eur J Vasc Endovasc Surg, 2010;39(3):316–22. DOI: 10.1016/j.ejvs.2009.12.003
6. Schorr EN, Treat-Jacobson D. Methods of symptom evaluation and their impact on peripheral artery disease (PAD) symptom prevalence: A review. Vasc Med, 2013;18(2):95–111. DOI: 10.1177/1358863x13480001
7. Sweeting HN. Measurement and Definitions of Obesity In Childhood and Adolescence: A field guide for the uninitiated. Nutr J, 2007;6(1). DOI: 10.1186/1475-2891-6-32
8. Hall DMB. What use is the BMI? Arch Dis Child, 2006;91(4):283–6. DOI: 10.1136/adc.2005.077339
9. Oliveros E, Somers VK, Sochor O, Goel K, Lopez-Jimenez F. The concept of normal weight obesity. Prog Cardiovasc Dis, 2014;56(4):426–33. DOI: 10.1016/j.pcad.2013.10.003
10. Nieto-García FJ, Bush TL, Keyl PM. Body mass definitions of obesity: sensitivity and specificity using self-reported weight and height. Epidemiology, 1990;1(2):146–52.
11. Python. Available online: https://www.python.org/ (accessed on 6 of September 2023)
12. Pip 23.2.1. Available online: https://pypi.org/project/pip/ (accessed on 6 of September 2023)
13. Schoonjans F. MedCalc statistical software. Available online http://medcalc.org (accessed on 13 of September 2023)
14. Yan F, Robert M, Li Y. Statistical methods and common problems in medical or biomedical science research. Int J Physiol Pathophysiol Pharmacol, 2017;9(5):157–63.
15. Dunn OJ, Clark VA. Basic Statistics: A Primer for the Biomedical Sciences. Wiley; 2009.
16. Yeboah K, Puplampu P, Yorke E, Antwi DA, Gyan B, Amoah AGB. Body composition and ankle-brachial index in Ghanaians with asymptomatic peripheral arterial disease in a tertiary hospital. BMC Obes, 2016;3(1). DOI: 10.1186/s40608-016-0107-3
17. Wang Y, Wang H, Zhou J, Wang J, Wu H, Wu J. Interaction between body mass index and blood pressure on the risk of vascular stiffness: A community-based cross-sectional study and implications for nursing. Int J Nurs Sci, 2023;10(3):325–31. DOI: 10.1016/j.ijnss.2023.06.008
18. Heald CL, Fowkes FGR, Murray GD, Price JF. Risk of mortality and cardiovascular disease associated with the ankle-brachial index: Systematic review. Atherosclerosis, 2006;189(1):61–9. DOI: 10.1016/j.atherosclerosis.2006.03.011
Received: 25 June 2023/ Accepted: 26 August 2023 / Published:15 September 2023
Citation: Agurcia A, Gonzalez E, Vasquez K, Medina R , Madrid M, Santiago Pastelin C, Zablah J I, Garcia Loureiro A, Molina Y, Diaz S, Agudelo C A. and Valle-Reconco J. Correlation between the Ankle-Brachial Index and Body Mass Index in adult inpatients in the Internal Medicine ward of the University School Hospital of Honduras from May to July 2023. Revis Bionatura 2023;8 (3) 81. http://dx.doi.org/10.21931/RB/2023.08.03.81