2023.08.01.24
Files > Volume 8 > Vol 8 No 1 2023
Genetic diversity of varieties of barley Hordum Vulgare Implanted using RAPD

Shaymaa khaleel alhialy 1* , Raed Salem Al-Saffar2, Safa Aldeen Abd. Sulyman 3,
1,2 Department of Biology/College of Science/University of Mosul
3 College of Basic Education/Univ. of Mosul
* Correspondence: [email protected],
Available from: http://dx.doi.org/10.21931/RB/2023.08.01.24
ABSTRACT
In the study, a technique of PCR was used, which is the RAPD indicator using nine varieties of the Iraqi barley plant, where the genetic indicators of the implicit sequence were used to determine the level of genetic similarity for the studied varieties and to find the genetic fingerprint for some types. The bundle of varying sizes was 121 in number. The highest number of binding sites was recorded in the R4 primer with 58 bundles, the lowest number of binding sites was given by the R5 initiator with 11 bundles, the highest molecular weight in the binding sites was provided by the R9 initiator 1300pb, and the same initiator gave the lowest molecular weight 125 pb, and from the genetic similarity matrix, the lowest genetic distance was between classes 3 and 4 with a value of 0.8545, while the highest genetic distance was between classes 6 and 7 with a value of 0.4545.
The RAPD technique found unique and distinct DNA bundles capable of distinguishing between the studied wheat varieties, meaning that these bundles were found in a particular type and absent in other varieties. It can be used as a distinctive genetic fingerprint to preserve plant breeders' rights. This study showed the efficiency of the RAPD technique in distinguishing between the studied cotton varieties and in determining the degree of genetic proximity and distance between them, which contributed to revealing the genetic diversity among some of the cotton varieties cultivated in Iraq.
Keywords Genetic diversity, RAPD, barly Hordum Vulgare
INTRODUCTION
To raise productivity and enhance food security and nutrition, various methods are used to reach the total of diverse and complementary crops and their improved varieties. Among the methods used to improve yields and increase productivity are genetic indicators. Several technologies based on DNA indicators have been developed that are used to detect genetic variations and study genetics. Genetic linkage between species or genetic phenotypes and genetic linkage mapping helped in developing breeding programs and raising their efficiency1, and it is used effectively in genetic improvement programs, whether in developing breeding programs through Through early detection of the presence of the desired trait in the genetic source, in addition to verifying the degree of mixing or genetic authenticity, identification of varieties and testing their purity is one of the essential processes in the field of the seed industry and biotechnologies based on genetic indicators used to improve yield and shorten the period RAPD Randomly Amplified Polymorphic DNA-PCR2
Grain varieties more to biotic and abiotic stresses are now being grown in farmers' fields. The rapid multiplication of high-quality seeds3 should match the development of more productive grain and feeding regimes
Future scenarios indicate that the pressure to reduce cereal production will disproportionately affect those most at risk, namely, the third world countries and the agriculturally dependent countries, who constitute a large part of the farmers, and the billions of low-income people depend daily on cereals for their survival. Alive4
With climate change, heat and drought tolerance will become important in cereals, especially in the tropics60. Current research is directed at developing the drought-tolerant wheat project using genetic modification, led by the International Center for Maize and Wheat Improvement, to produce different varieties, including hybrids, that excel. The yield over commercial varieties increased by 25 percent under specific drought conditions. Some are also heat tolerant and produce 27 percent more output than commercial varieties. A heat-tolerant wheat variety based on the genotype maintained by the International Center for Maize and Wheat Improvement and the International Center for Agricultural Research in the Dry Areas (ICARDA center of agriculture) has been released in several countries5
Recent years have witnessed a remarkable development in the use of molecular indicators in determining the genetic variation of cultivated plants because of their many advantages. Molecular indicators are of paramount importance in plant breeding, in addition to being helpful indicators in accelerating the selection and breeding processes and reducing material costs. Molecular indicators have been used to determine the genetic variations within plant populations and the genetic relationships between varieties and plant species. Studies have proven that molecular indicators are valuable clues in describing and evaluating genetic diversity within species. deterioration6
Among the common and recent indicators are Polymorphic Random Amplified DNA (RAPD) indicators, which are simple, fast, do not require a large amount and can be applied to large genetic populations, in addition to the possibility of using random primers. Thus RAPD indicators have applications in the Extensive study of the relationship between clans of the same species or species close to each other. It was also used to determine the genetic identity and to investigate hybrids. It can also help in drawing genetic maps and using them to know the genetic relationship between plants of one species using the same technique. In addition to its use in the field of diagnosis and finding genetic fingerprints, it had applications on various organisms such as humans, animals and bacteria, and the varieties belonging to many plant species were classified7
Many researchers used different types of DNA indicators to study genetic variation and molecular characterization of wheat plants in other parts of the world; the study aimed to use RAPD indicators in analyzing genetic variations between some varieties of wheat tri in Iraq to distinguish between all studied sorts, which are the identity of For the variety8
MATERIALS AND METHODS
The genealogies of the genotypes and their numbers used in the study(
island / Ibaa center / Iraq, Euphrates Abaa Center/Syria, Pool Ebaa Center / Iraq, Rum Ibaa Center / Jordan, Forest Parent Center / Australia, Benedict Parents Center / Sweden. Arafat Parents Center / America, Rayan Parents Center / Syrian,
Samir Parents Center / Iraqi.
The amount of rain falling during the growing season was (812.5 mm). Random samples were taken of five spikes of each variety, placed in clean nylon bags, and transferred to the College of Science, Department of Life Sciences - Molecular Biology Laboratory to conduct the laboratory study.
Extraction of DNA from the seeds of wheat under study
The Genomic DNA mini kit supplied by Geneaid Company was used. It included the following (Weigh 0.2 g of wheat seeds, add liquid nitrogen to a ceramic mortar and grind the mixture for 3 seconds until it becomes a homogeneous powder, Transfer the powder to a 1.5 mL tube and add 400 μl of GP1 and 5 μl of RNase and mix using a mixer (Vortex). The tube is incubated at 60°C for 10 minutes. During that time, the tube is turned every 3 minutes, add 100 μl of GP2 Buffer solution mix with Vortex and incubated on ice for 3 minutes, The mixture is transferred to a Filter Column tube, and centrifugation is carried out for 1 minute at a speed of 1000 g, then the filter tube is neglected. The filter is transferred to a 1.5 ml tube, Add 1.5 kg of GP3 solution and mix immediately for 5 seconds. Transfer 700 μl of the key to a GD Column tube and centrifuge for 2 minutes at maximum speed. The filtrate is discarded, and the GD Column is reinstalled into the collection tube. Add 400 μl of solution W1 and centrifuge for 30 seconds at maximum speed. The filtrate is discarded, and the GD Column is reinstalled into the collection tube. Add 600 μl of Wash Buffer solution and centrifuge for 30 seconds at maximum speed, remove the filtrate, and then centrifuge for 3 minutes at full speed. The GD column is fixed in a 1.5 ml tube, and 100 μl of Elution solution is added and left for 3 minutes to allow it to bind with DNA.Centrifuge for 30 seconds at maximum speed. Remove the GD column and store the precipitate at -20°C until use.
Preparation of agarose gel and DNA electrophoresis
For DNA transfer and detection, 1% agarose gel is prepared. To obtain this concentration, 0.5 g of agarose powder is dissolved in (50) ml of X1 TBE, and 3 microliters of safe red dye are added using a heat source with continuous stirring until boiling and left to cool. To a temperature of (60-50) ˚C, Then the gel solution is poured into the basin of the Tray of the relay device after the special comb is fixed to form the Wells at the edges of the gel, taking into account that the pouring is quite to avoid the formation of bubbles. If they are created, they are removed using the pipette, then leave the gel solidifies. The Tray is then placed in an electric relay tank containing an appropriate amount of X1 TBE solution, after which the comb is gently lifted. Migration samples are prepared by mixing (5) μL of the DNA sample with (3) μL of the loading solution. After that, the relay is operated by passing the electric current with a voltage of (5) volts/cm, and the process takes (2-1.5) hours. After that, the gel is photographed under ultraviolet rays using a gel documentation device to see the DNA bundles and the product of the PCR reaction. As shown in the following table (1), ten random starters were used to determine the differences between the wheat cultivars.
Table 1. Determine the differences between the different wheat cultivars.
PCR reactions
The DNA concentration in all study samples was adjusted by dilution by TE buffer solution to obtain the required concentration for PCR reactions, and it was (25) ng/microliter for each sample. The master reaction mixture was prepared for each PCR reaction by mixing the DNA sample and the special primer for each gene with the components of the Pre-mix inside a 0.2 ml Alpendorf tube supplied by the English company Biolabs. The reaction volume was fixed to 20 μl with distilled water, and the mixture was discarded. In the Microfuge device, for a period between (5-3) seconds, to ensure the mixing of the reaction components, the reaction tubes were inserted into the
Thermocycler to conduct the multiplication reaction using the particular program for each response. Adding the volumetric guide DNA Ladder prepared by Biolaps company into one of the holes, the samples are migrated by running the Electrophoresis device for a period ranging from (70-60) minutes, after which the gel is imaged using the Gel Documentation device (Fig. 1).
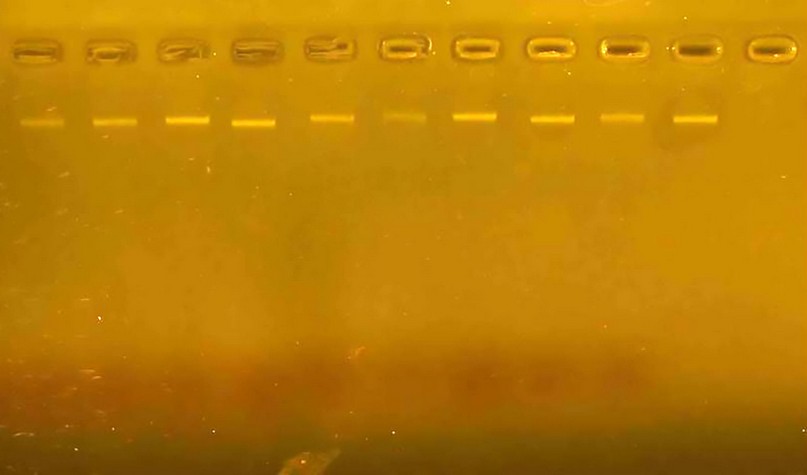
Figure 1. Shows the genome extracted from wheat seed samples and carried over in 2% agarose gel.
Statistical analysis
The results of the RAPD prefixes were taken based on the comparison of the presence or absence of a piece of DNA for the studied varieties, which symbolizes the presence of the DNA piece (Band) by (1) and its absence with the number (0), where it was recorded for the company of the DNA band) by the number 1 and for its lack (Band) by the number zero; this table has calculated the number (Band) shown by each prefix in the RAPD and the total number of bundles of genetic varieties of wheat studied, identifying monomorphic and polymorphic bundles, and calculating the degree of variation in the outputs of gene dimension coefficient as well as the similarity coefficient between the analyzed samples using Nei's coefficient 729 then he conducted cluster analysis and plotted the genetic dimension using the (UPGMA) method10
Statistical analyzes were carried out by computer using the program:
Taxonomy and Multivariate Analysis (NTSYS-pc) Numerical System11. The conclusion of the results of this program was based on the9 to detect genetic similarity by forming a sequential table that includes all the results of the prefixes (for each indicator separately) with all the models studied according to the equation: Ni) + GD=1{2x(Nij/Ni)
Nij: The number of packets shared between the two models i,j
Ni: the number of packages in the i .model Nj: the number of packets in the j. model
RESULTS AND DISCUSSION
Polymorphism results from using the RAPD technique for the studied items.
The RAPD technique is one of the old and relatively simple molecular methods, but it is still widely used due to its ease of application. Diagnosing taxa at the DNA level using this technique means finding the genetic fingerprint for each of the taxa, which is how the replicated pieces of the studied taxa are distributed using a specific initiator, i.e., The number of those bundles and their molecular sizes, which are distinctive for that variety without the rest of the types, and that finding a genetic fingerprint for the array is considered an identity for that variety that can be used12. The RAPD technique was applied using ten random primers Table (2) to distinguish nine types of wheat Table (1). The method of analyzing the results of the genetic relationship study depended on the presence or absence of bundles resulting from the duplication of certain pieces of the wheat genome used and on the molecular weights of those bundles that depend on The number and complementary locations of primer sequences on the template DNA strand, the lack of results with some of the primers used is one of the most important foundations that are considered the basis of the differences between taxa13
primer R1, The number of multiplied pieces of wheat varieties using this starter was 32 bundles whose molecular weights ranged between (300pb-1100pb). Figure (2) The number of multiplicative pieces for cultivars went from 5 to 3; the bundle with a molecular weight of 300 pb appeared in category one to distinguish it. This cultivar used the 1R primer, which represents a genetic indicator for the variety and a guide to facilitate the differentiation task, which was the percentage of the variance between the cultivars using this primer 8, 71.
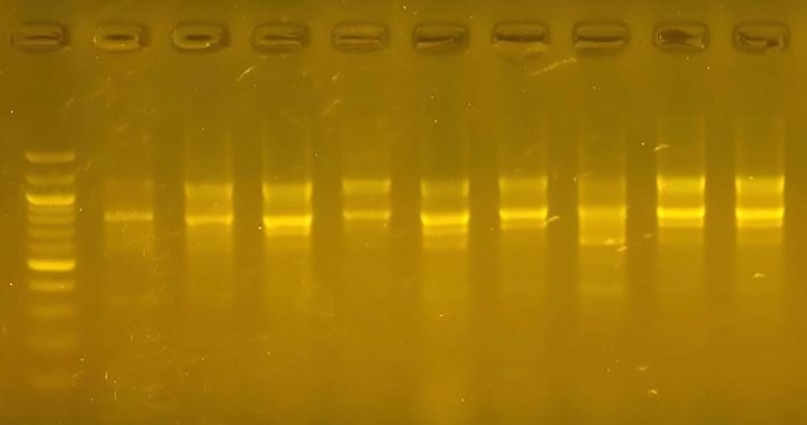
Figure 2. The product of a DNA random amplification reaction using the 1 R . primer
The R2 primer showed the results of DNA doubling for the cultivars under study using the R2 initiator. Twenty-nine bundles whose molecular weight ranged from 200 pb - 900 pb. The 500 and 900 pb bundles appeared in all varieties. This initiator variety seven was distinguished by the presence of the 700 pb initiator and can be used as a distinctive genetic fingerprint. The variety has a variance ratio of 62.2.
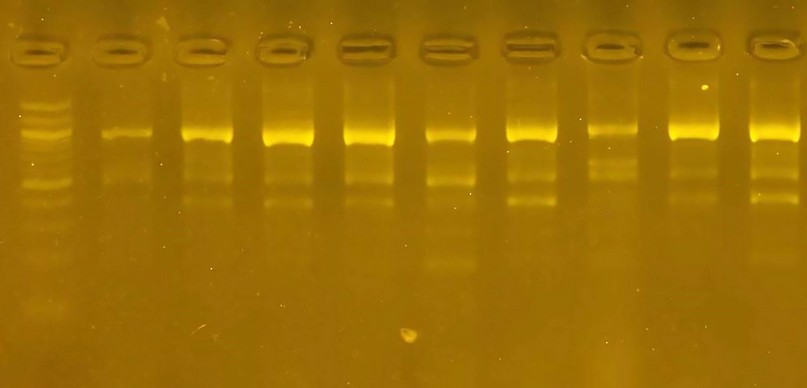
Figure 3 The product of a DNA random amplification reaction using the initiator R2
Initiator R3: The number of the resulting bundles reached 28, of which 19 differed between the varieties. The percentage of bundles differed at 67.87; the initiator R3 gave a 200 pb molecular weight that band found in class 5 and not in the rest of the varieties. This confirms the importance of this technique in molecular characterization and genetic fingerprinting.
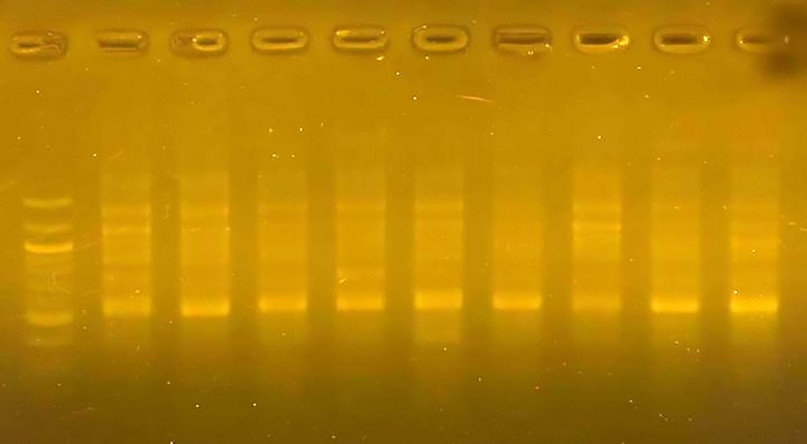
Figure 4. The product of a DNA random amplification reaction using the initiator R3
R4 initiator: The number of bundles using this initiator was 58, of which 40 were different bundles, and the variance ratio between the varieties was 68.97. This initiator did not distinguish a particular variety; the molecular weight of the bundles ranged from 200pb to 1200pb.
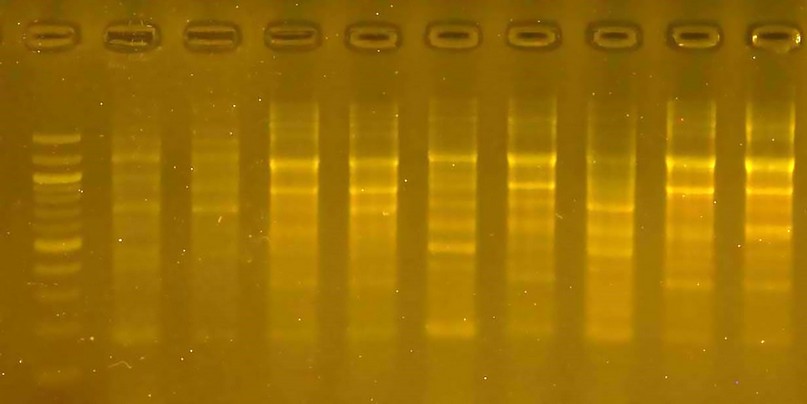
Figure 5. The product of a DNA random amplification reaction using the initiator R4
Initiator R5: This initiator gave the least number of bundles, 11 bundles only, did not distinguish any variety, and is considered the least efficient primer. The percentage of variation reached 100, and the molecular weight of the bundles ranged from 600pb to 1200pb.

Figure 6. The product of a DNA random amplification reaction using the initiator R5
Starter R6: The number of bundles resulting from using the R6 starter was 34 bundles, and the percentage of the discrepancy between the varieties was 100 because no similar bundles appeared between the varieties. Variety 7 was distinguished by the absence of a bundle with a molecular weight of 400 pb, while it was present in the rest of the varieties. The size of the pieces ranged from 250 pb to 900 pb.
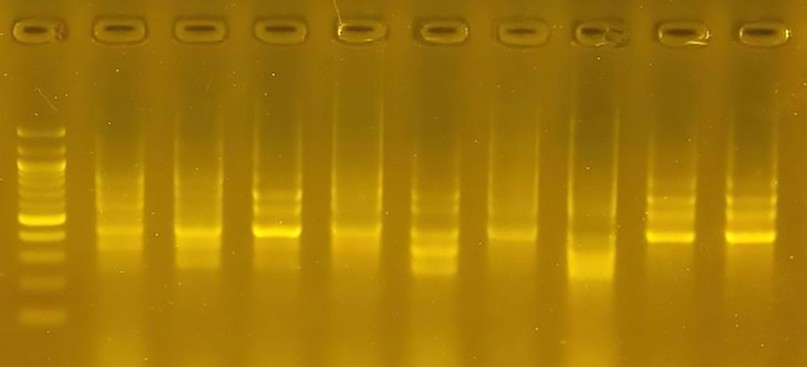
Figure 7. The product of a DNA random amplification reaction using the initiator R6
The primer R7, in conjunction with the complementary sites of the DNA sequences, gave 38 bundles with molecular weights ranging from 500 pb to 1100 pb. No cultivar was distinguished by using this initiator because a unique bundle did not appear for a particular cultivar; the percentage of variance using this primer was 0 zero.
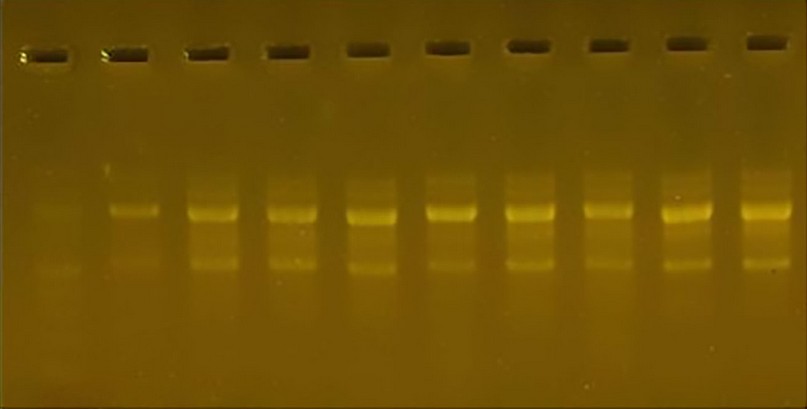
Figure 8. The product of the DNA random amplification reaction using the initiator R7
Starter R8: 36 packets produced by this initiator bar interconnected with the complementary sites of DNA, of which 9 bundles are similar. The percentage of the variance between species using this initiator was 75.0. The size of the packets ranged from 400pb to 1200pb
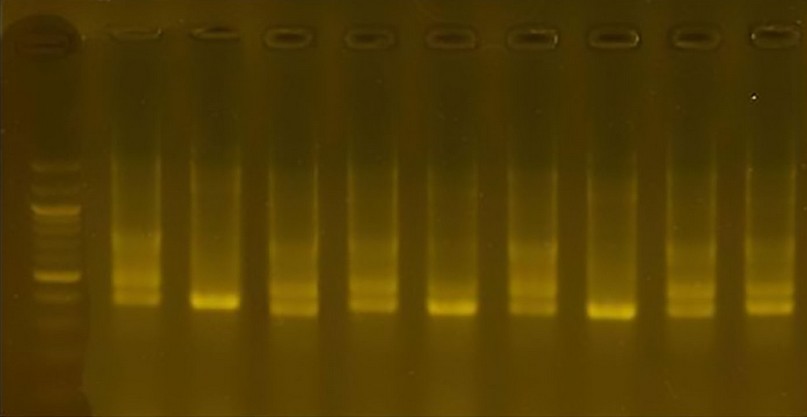
Figure 9. The product of a DNA random amplification reaction using the initiator R8
Initiator R9: The number of bundles reached 46 bundles, and their size ranged from 125pb to 1300pb. Class 5 was distinguished by a unique bundle with a molecular weight of 175 pb. The initiator gave a variation ratio of 77.8
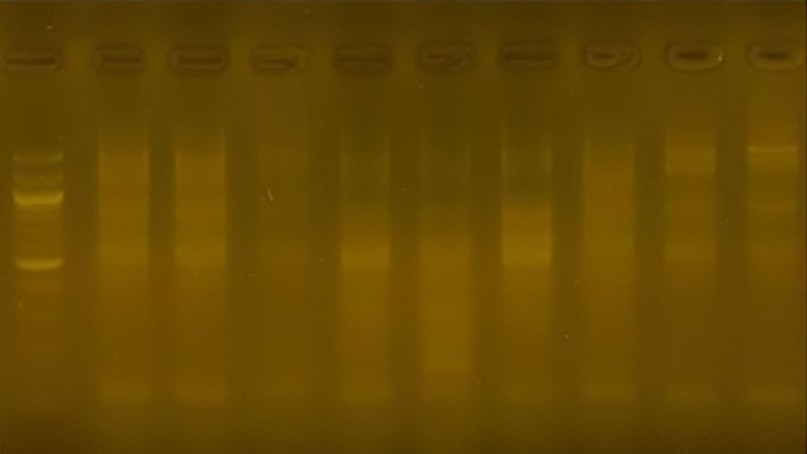
Figure10. The product of the DNA random amplification reaction using the initiator R9
Primer 0 1R: The number of bundles produced 48 bundles; their weight ranged from 300pb to 1100pb. One cultivar was distinguished from the rest of the cultivars by the absence of the bundle. The molecular weight was 300pb, considered a genetic fingerprint for this cultivar. The variance ratio for this cultivar was 25.0.
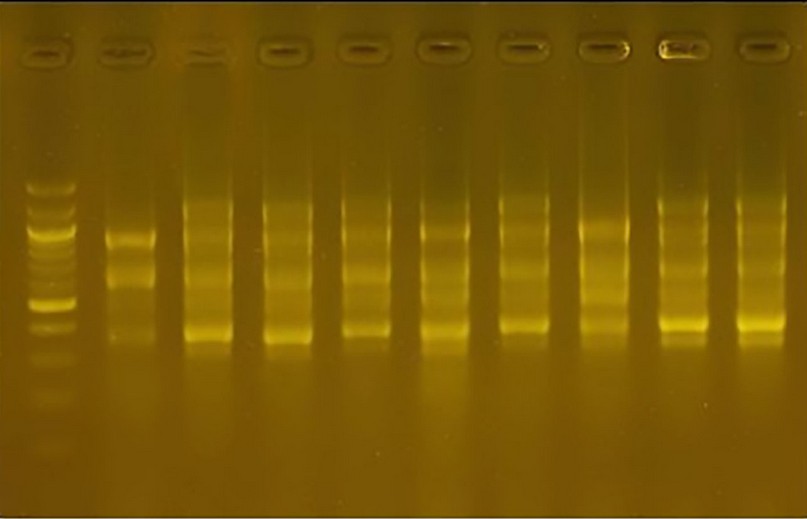
Figure 11. The product of the DNA random amplification reaction using the initiator R10
The relationship genetic tree (Fig. 12) was drawn based on the genetic dimension among the nine varieties.
With a molecular weight of 300 pb, it appeared in cultivar 1, so this cultivar can be distinguished using the 1R primer, which represents a genetic marker for the cultivar and a guide to facilitate the task of differentiation.
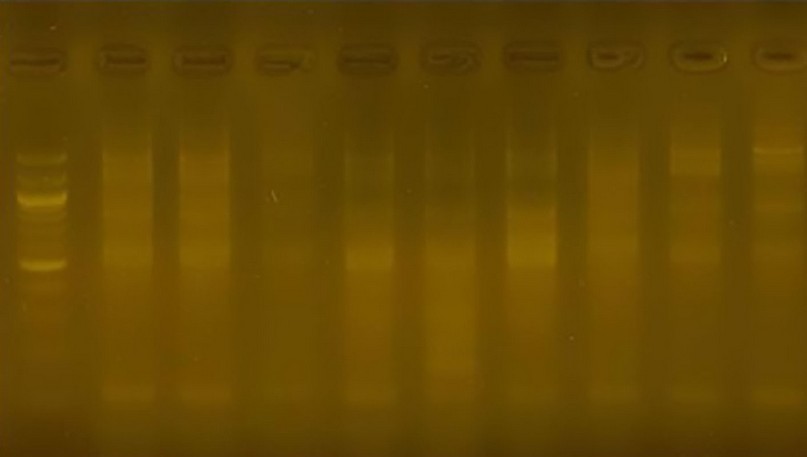
Figure 12. The product of the DNA random amplification reaction using the initiator R9
Primer 0 1R: The number of bundles produced 48 bundles; their weight ranged from 300pb to 1100pb. One cultivar was distinguished from the rest of the cultivars by the absence of the bundle. The molecular weight was 300pb, which was considered a genetic fingerprint for this cultivar. The variance ratio for this cultivar was 25.0.
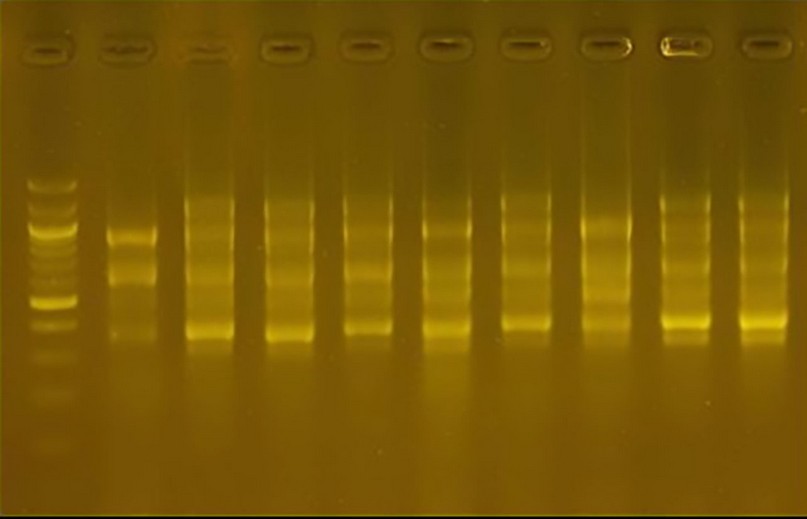
Figure 13. The product of the DNA random amplification reaction using the initiator R10
Figure 14 shows the values of genetic dimensions for nine cultivars of wheat, where the values ranged between (0.8727 - 0.4545). Suppose the genetic material is identical between any two cultivars. In that case, the genetic dimension between the two cultivars must be zero. The similarity ratio must be 100%14, the most significant percentage of similarity appeared between classes 8 and 9 and based on the values of the primers used in the RAPD variants, which means the most similar rate of genetic material between the two classes compared to other varieties, and the reason may be due to their closeness in proportions, while the lowest similarity percentage was between classes 7 and 6 compared to types. This indicates that there are significant differences in the genetic material between them.
The relationship genetic tree (Fig. 12) was drawn based on the genetic dimension among the nine varieties.
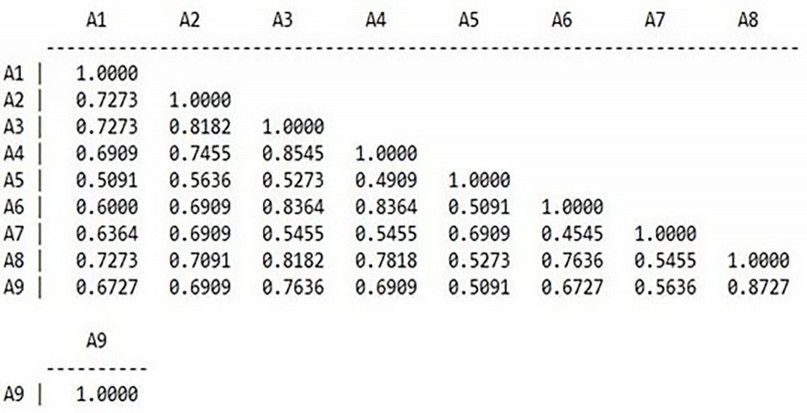
Figure 14. Similarity matrix computed with Nie coefficient
Relationship genetic tree
Cluster analysis to build a genetic relationship tree using the UPGMA method depends on the genetic dimension coefficient and allelic frequency. This study drew a genetic relationship tree for nine wheat cultivars using RAPD indicators and ten primers. The aggregate analysis results showed two main groups (Main Cluster). The distance between one group and the other groups indicates their relationship. Groups close to each other are placed in close branches within the group, which includes two main groups. The first leading group included two cultivars, class 5 and class 7. The second major group was divided into two minor branches. The first secondary branch included only class 1. The second secondary branch was where the genetic varieties were distributed into two sub-secondary groups. The first sub-secondary branch had two classes, class 8 and class 9. The sub-secondary branch is divided into two groups. The first group was unique to this group by the presence of one category, category 2. The second group was divided into two groups. The first group included classes 3 and 4. In the second group, only category six is included. The importance of determining the genetic relationship by using cluster analysis is due to the possibility of organizing the genetic assets, selecting the parents involved in breeding programs, predicting the best hybrids, and knowing the least possible number of genetic structures that contain the largest possible number of genetic classifications in breeding and improvement programs the plant.
The presence of genetic similarity between varieties of different fathers in the same site may be the reason for their genetic adaptation to the environmental conditions prevailing in that site, so the genetic material is somewhat similar, which led to its reflection in the number of bundles shared between them, or it may have a joint genetic base, and therefore Genes may flow between different geographic distributions, or the similarity may be due to the common origin of the species 3
CONCLUSION
Despite the narrow genetic base among the six species used here, RAPD analysis was quite effective in determining the genetic variation among Barley species. It can be used to generate DNA fingerprints for variety identification.
Funding: self-funding
Acknowledgments: In this section, we acknowledge any person who supports us in completing this project.
Conflicts of Interest: there is no conflict
REFERENCE
1- Behera, T. K ., A. B. Gaikward, A. K. Singh and J. E Staub,. Relative efficiency of DNA markers (RAPD,ISSR and AFLP) in detecting genetic diversity of bitter gourd (Momordica charantia L.) . Short Communication . J Sci Food Agric.2008؛ 88:733–737
2- Dje`,Y, C.G. Tahi, A.I. Zoro Bi, J.-P. Baudoin, and P. Bertin . Use of ISSR markers to assess genetic diversity of African edible seeded Citrullus lanatus landraces . Scientia Horticulturae.2010؛ 124 : 159–164.
3- Ashter, S.Evaluation of some genotyps of the Syrian wheat (hexagonal and quaternary) using biochemical and molecular markers are different. Ph.D. Diss. Agronomy Department. Faculty of Agriculture. University of Tthishreen. Syria.2009؛P:192.
4- Solh, M., Braun, H-J. & Tadesse, W. Save and Grow: Wheat. Paper preparedfor the FAO Technical Consultation on Save and Grow: Maize, Rice and Wheat, Rome, 15–17 December 2014. Rabat,ICARDA. (mimeo).
5- Edmeades, G.O. Maize – Improved varieties. Paper prepared for FAO for Save and Grow: Maize, Rice and Wheat. Rome.(mimeo)2015.
6- JEONG, Jun Seop, et al. Rapid identification of monospecific monoclonal antibodies using a human proteome microarray. Molecular & Cellular Proteomics, 2012, 11.6.
7- MOHAMMED, Bushra MA; KHERAVII, Sarbast KQ. Evaluation of genotoxic potential of Hypericum triquetrifolium extract in somatic and germ cells of male albino mice. Research Opinions in Animal & Veterinary Sciences, 2011.
8- Aydogan, E. and Yagdi, K. Study of genetic diversity in wheat (Triticum aestivum L.) varieties using random amplified polymorphic DNA (RAPD) analysis . Turkish J. Field Crops .,2012؛ 17 : 91-95 .
9- Nei, M. and W.H. Liز Mathematical model for studying genetic variation in terms of restriction endonucleases". Pro. Natl. Acad. Sci. USA.,1976: 74: 5267-527.
10- Sneath P.H.A. and Sokal. Numerical taxonomy-the principals and practice of numerica classification. W.H. Freeman and Co., San Francisco.1973.
11- Rohlf F.J.,. NTSYS-pc: Numerical Taxonomy System. Ver. 2.21.Exeter Software, Setauket, NY, USA.2000: pp. 29-34
12- Tidke, S. D. and Ranawade, P. S. .Genetic Analysis and RAPD Polymorphism in Wheat (Triticum aestivum L.) Genotypes. International Journal of Current Microbiology and Applied Sciences, 2017:6(3): 239-246.
13- Nwangburuka, C.C.; Kehinde, O.B.; Ojo, D.K.; Popoola, A.R.; Oduwaye, O.; Denton, O.A. and Adekoya, M.. Molecular characterization of Twenty-nine Okra Accessions using the random amplified polymorphic DNA (RAPD) molecular marker J.2011 of L. and Ph. 14.
14- Mona, H. A. ; Elrabey, R. M. ; Khalaf, M. H. and Elhalafawi, K. Cytological and Molecular characterization of some Wheat ( Triticum aestivum L.) cultivars. Egypt. j.Genet. Cytol.2009:38:235 – 250.
Received: October 23, 2022 / Accepted: January 15, 2023 / Published:15 February 2023
Citation: khaleel alhialy S, Salem Al-Saffar R, Abd. SulymanSA. Genetic diversity of varieties of barley Hordum Vulgare Implanted using RAPD. Revis Bionatura 2023;8 (1)24. http://dx.doi.org/10.21931/RB/2023.08.01.24