2023.08.04.84
Files > Volume 8 > Vol 8 no 4 2023
Association of serum level and gene expression of IL-25 in a sample of Iraqi asthmatic patients

Basima Q. Hasan ALSaadi1,* ; Mayada Hussain Ali2
1 Institute of Genetic Engineering and Biotechnology for postgraduate studies / University of Baghdad, Iraq
2 Institute of Genetic Engineering and Biotechnology for postgraduate studies / University of Baghdad, Iraq
* Correspondence: Email: [email protected] Available from. http://dx.doi.org/10.21931/RB/2023.08.04.84
ABSTRACT
Asthma is an increasingly common disease characterized by allergic airway inflammation, hyperresponsiveness, mucus overproduction, and peribronchial fibrosis. The epithelial cytokines IL25 have been implicated in asthma pathogenesis because they promote Th2-type cytokine synthesis. The current study aimed to assess IL-25 expression and measure the serum level of this cytokine in asthmatic Iraqi patients. The study was conducted on sixty (60) asthmatic patients (32 female and28 male) and thirty as apparently healthy subjects (control) (16 female and 14 male) with ages ranging from 15-60 years recruited Alzahra’a Center for Asthma and Allergy in Baghdad during the period between November /2021 to March /2022. Written informed consent was obtained from all patients and a healthy control group.
Moreover, the study design was approved by the Institute of Genetic Engineering and Biotechnology for Postgraduate Studies/ University of Baghdad. All patients were diagnosed according to clinical examination by a chest physician and selected according to the global initiative of asthma criteria. The healthy control group are non-smoking subjects with no history of obstructive lung disease or atopy. The RNA was extracted from the whole blood of asthma patients and healthy control without Trizol subjects using the protocol in Easy Pure t® blood RNA Kit (ER-401). The acceptable purity of asthmatic patients and control healthy group RNA ranges between 1.84 and 1.99. IL-25 gene expression showed the Ct of asthma patient group (25.179) and control group (27.393), and the2-ΔΔCt of asthma patient group (288.81) and control group (58.48) and the fold of gene expression was statistically significantly (P≤0.01) the calculation of the gene expression it was significant in the patient group than control group4.938 times with ratio (4.938:1) . ELISA estimated IL-25concentration, the results were statistically significant (P≤0.001), the level of IL-25 in asthma patient group (29.30± 5.107317pg/ml) while the level of IL-23 in Control group (15.16±0.085248pg/ml).
Moreover, the study design was approved by the Institute of Genetic Engineering and Biotechnology for Postgraduate Studies/ University of Baghdad. All patients were diagnosed according to clinical examination by a chest physician and selected according to the global initiative of asthma criteria. The healthy control group are non-smoking subjects with no history of obstructive lung disease or atopy. The RNA was extracted from the whole blood of asthma patients and healthy control without Trizol subjects using the protocol in Easy Pure t® blood RNA Kit (ER-401). The acceptable purity of asthmatic patients and control healthy group RNA ranges between 1.84 and 1.99. IL-25 gene expression showed the Ct of asthma patient group (25.179) and control group (27.393), and the2-ΔΔCt of asthma patient group (288.81) and control group (58.48) and the fold of gene expression was statistically significantly (P≤0.01) the calculation of the gene expression it was significant in the patient group than control group4.938 times with ratio (4.938:1) . ELISA estimated IL-25concentration, the results were statistically significant (P≤0.001), the level of IL-25 in asthma patient group (29.30± 5.107317pg/ml) while the level of IL-23 in Control group (15.16±0.085248pg/ml).
Keywords: IL-25, gene expression, Elisa, Asthma
INTRODUCTION
Asthma is a non-communicable chronic disease in adults characterized by recurrent coughing, wheezing, shortness of breath and chest tightness. Sever and chronic inflammation of the airway and recurrent symptoms limitation may occur a few times a day or a few times per week1. Asthma symptoms may worsen at night or with exercise and result from complex gene–environment interactions, with heterogeneity in clinical presentation and intensity of airway inflammation and remodeling. Asthma affected approximately 262 million people and caused about 461,000 deaths in 2019 2. Moreover, death mainly occurs in the developing world. Around 300 million people have asthma worldwide, and a further 100 million may likely be affected by 2025 3, 4
Interleukin-25 (IL-25) is a pro-inflammatory cytokine belonging to the Interleukin-17 family, also known as Interleukin-17E (IL-17E). It has a molecular weight of 16.7 kDa and 161 amino acid residues. IL-25 is predominantly responsible for propagating Th2 cytokine-driven allergic responses and the pathophysiology of eosinophilic asthma5. It is produced mainly by epithelial cells responding to allergen proteases, pollutants, and viral respiratory infections, such as rhinovirus and respiratory syncytial virus. It is also produced by Th2 cells, the earliest recognized source of IL-25, and also from innate Lymphoid Cells Group 2 (ILC2), Eosinophils, Basophiles, and mast cells. It is essential in activating eosinophils by activating adhesion molecule ICAM-1. It promotes recruitment of Th2 cells, ILC2, B cells, eosinophils and mast cells to the site of allergic inflammation in the lung 6. This produces Immunoglobulin E (IgE) production by B cells, airway eosinophilia, airway hyperresponsiveness, and remodeling 7. Furthermore, IL-25 stimulates several immune cells, such as Th2 cells, ILC2, eosinophils, mast cells, and structural cells, including endothelial cells, epithelial cells, and fibroblasts to produce and secrete pro-inflammatory cytokines (IL-4, IL-5, IL-6, IL-8, Il9, and IL-13), and chemokines, namely CXCL8, and macrophage inflammatory protein-1 8. 6 Found that the elevated IL-25 mRNA expression and protein concentration was associated with a lower eosinophil and higher neutrophil percentage in asthmatic airways and a lower IL-25 mRNA expression in sputum cells was observed in severe asthma compared to controls, another study by 9 . revealed that Epithelial expression of IL-25 was increased in subject with asthma However, the pathophysiological mechanisms of the “alarmin” cytokines IL-25 in the pathogenesis of different phenotypes of asthma are incompletely understood.
To our knowledge, this is the first study about the genetic aspect of asthma to determine the gene expression of Il- 25 in Iraqi patients by using quantitative real-time PCR and to determine serum levels of IL-23 by the ELISA technique.
MATERIALS AND METHODS
Subjects and sampling
Sixty patients (32 female and28 male) and thirty as apparently healthy subjects (control) (16 female and 14 male ) with ages ranging from 15-60 years were enrolled in the current study, and questionnaire form information including age, season, gender, family history, sensitivity, incidence intensity, onset of disease, other diseases were also included, the samples were admitting Alzahra'a Center for Asthma and Allergy in Baghdad during the period between November /2021 to March /2022. Written informed consent was obtained from all patients and a healthy control group. Moreover, the study design was approved by the Institute of Genetic Engineering and Biotechnology for Postgraduate Studies/ University of Baghdad. All patients were diagnosed according to clinical examination by a chest physician and selected according to the global initiative for asthma criteria. The healthy control group are non-smoking subjects with no history of obstructive lung disease or atopy.
Extraction of genomic RNA and determination of serum level of IL-25
Five ml of peripheral blood samples were collected from the asthma and healthy control group patients. Two ml of blood were kept in EDTA anticoagulant tubes, conserved in 0.25 ml of EDTA blood Eppendorf tubes, and stored at -20 °C for later RNA extraction. The RNA was extracted from the whole blood of asthma patients and healthy control without Trizol subjects using the protocol in Easy Pure t® blood RNA Kit (ER-401). Nanodrop measured RNA concentration and purity. The acceptable purity of asthmatic patients and control healthy group RNA ranges between 1.84-1.99. The serum level of IL-25 was determined in asthma patients, and an IL-25 ELISA kit from SunLong company (China) was used in this study.
Real-time –PCR for IL-25 gene
One-step gDNA removal and cDNA Synthesis
The cDNA synthesis was subjected by using the Easy Script® protocol, a two-step gDNA removal and cDNA synthesis Super Mix( Li,2017). According to the manufacturer's instructions, the procedure was performed in a reaction volume of 20 μl. The total RNA volume was (20μl)
Primer sequence for IL-25
Primers used in the study were designed according to their reference sequence in the National Center for Biotechnology Information (NCBI) database and shown in Table (1).
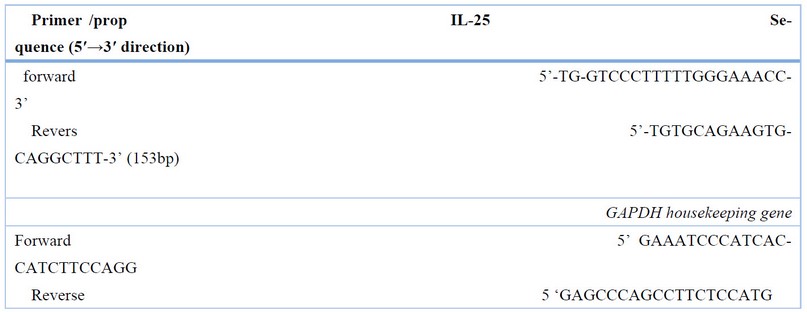
Table 1. Show the primer sequence used in this study.
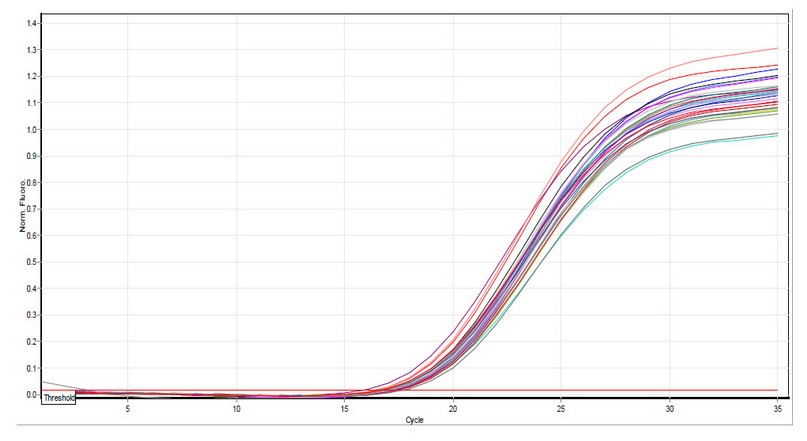
Figure 1. GAPDH amplification plots by qPCR Samples included all study groups. Cycle threshold values ranged from 17 to 20. The photograph was taken directly from the Qiagen rotor Gene qPCR system.
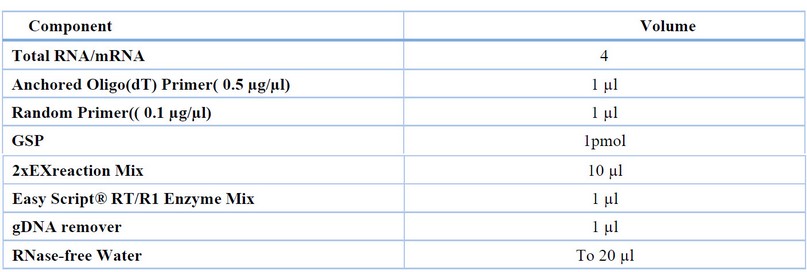
Table 2. The reaction components and volume needed
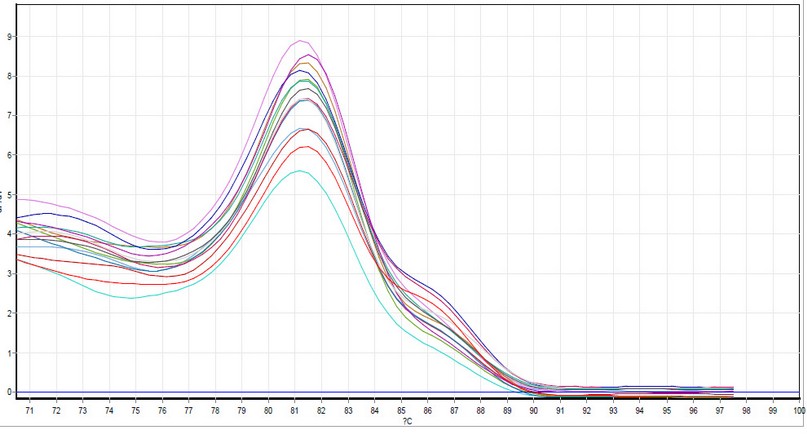
Figure 2. GAPDH dissociation curves by qPCR Samples included all the study groups. The photograph was taken directly from the Qiagen Rotor-Gene qPCR system.
The time and temperature needed are shown in table (3 )
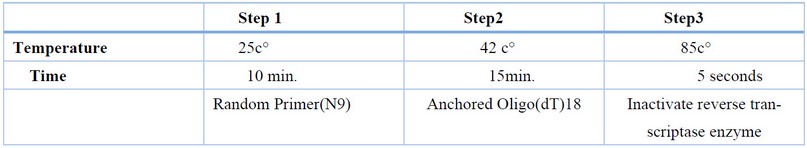
Table 3. Thermal Cycler steps.
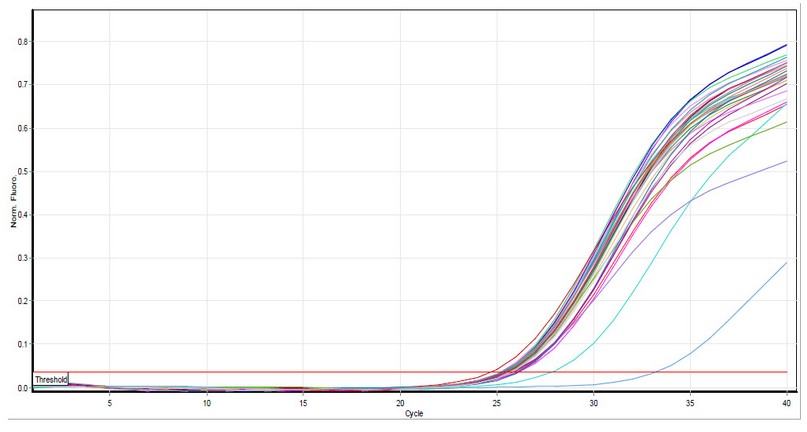
Figure 3. IL-25 amplification plots by qPCR. Samples included those taken from the healthy study group. Cycle threshold values ranged from 21.97 to 23.75. The photograph was taken directly from the Qiagen Rotor-Gene qPCR system.
Trans Start® Probe q PCR Super Mix for RT-PCR
This procedure was carried out in a reaction volume of 25 µl according to the manufacturers` instruction: the master Mix Syper Green was allowed to thaw at room temperature25c° then the volume of components needed to prepare the required number of reaction were calculated according to the Table (4 ) then all the tubes were briefly centrifuged to spin down the contents and to eliminate any air bubbles, the tube was set inside the qRT-PCR well, and the program was run. The optimal annealing temperature of the qPCR reaction was found after several tries to 64˚C. The reaction components are described in table (5).
This procedure was carried out in a reaction volume of 25 µl according to the manufacturers` instruction: the master Mix Syper Green was allowed to thaw at room temperature25c° then the volume of components needed to prepare the required number of reaction were calculated according to the Table (4 ) then all the tubes were briefly centrifuged to spin down the contents and to eliminate any air bubbles, the tube was set inside the qRT-PCR well, and the program was run. The optimal annealing temperature of the qPCR reaction was found after several tries to 64˚C. The reaction components are described in table (5).
The qRT-PCR program conditions were designed as shown in Table (4 )
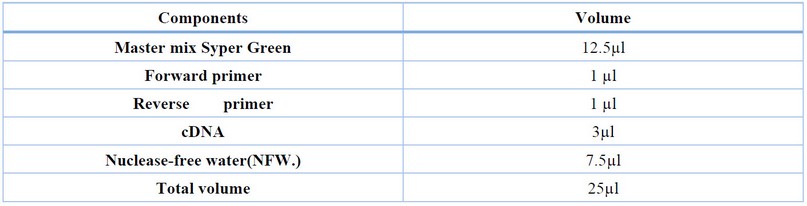
Table 4. Reaction Components and volume for gene expression.
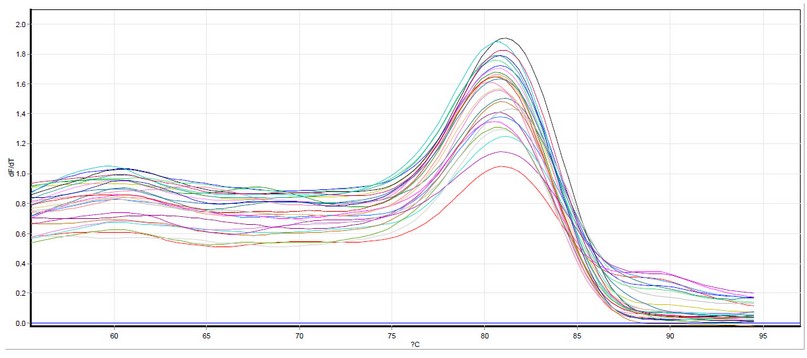
Figure 4. IL-25 dissociation curves by qPCR Samples included a healthy study group. Melting temperature ranged from 85.0°C to 88.0°C. The photograph was taken directly from the Qiagen Rotor gene qPCR machine.
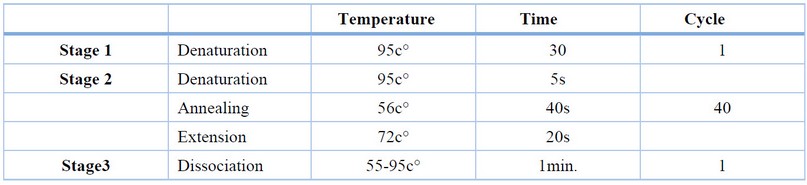
Table 5. Stages and temperature of qRT-PCR
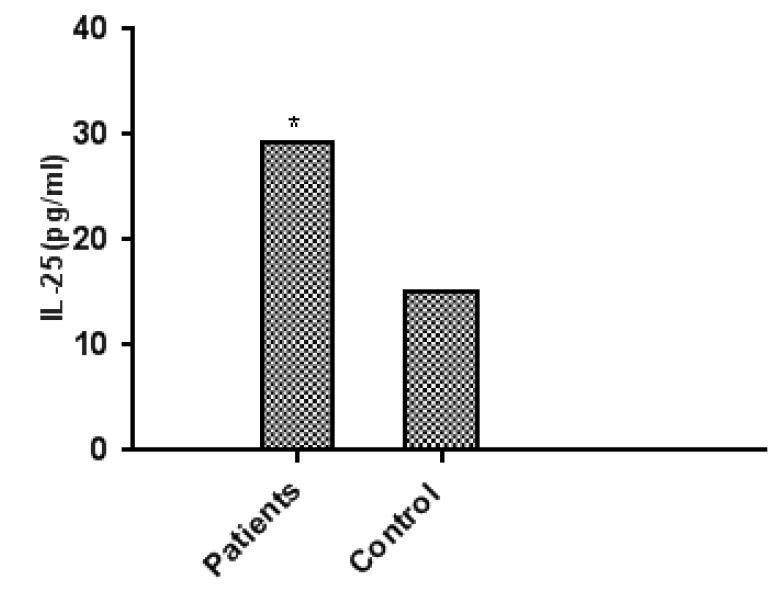
Figure 5. Represent serum level of IL-25 in asthmatic patients and control groups
RT-PCR analysis of IL25 gene expression
DCT: The expression ratio was calculated according to the following equation: DCT (test) = CT gene of interest (target, test) – CT internal control( housekeeping gene ). Finally, the expression ratio was calculated using the formula 2 -DCt = Normalized expression ratio 10.
DD CT: To compare the transcript levels between different samples, the 2-DDCt method was used 10.
The CT of the gene of interest was normalized to that of the internal control gene. The difference in the cycle threshold (Ct) values of the GAPDH gene (interest gene) was calculated using the following formula.
DCT (test) = CT gene of interest (target) – CT internal control DCT (calibrator) = CT gene of interest (target, calibrator) – CT internal control. The DCT of the test samples was normalized to the DCT of the calibrator: DD CT was calculated according to the following equation: DD CT=DCT (test)- DCT (calibrator). Finally, the expression ratio was calculated according to the formula. 2 -DDCt= Normalized expression ratio 10
Detection of IL-25 by ELISA
Determination of serum level of IL-25 using EnzymeLinked Immunosorbent Assay kit (Sunlong Biotech. / China) Using manual instructions. The kits were based on the principles of sandwich-ELISA
Statistical Analysis:
The Statistical Analysis System- SAS (2012) program was used to detect the effect of different factors on study parameters. A T-test was used to compare the means in this study significantly.
RESULTS
Quantitative Real-time PCR of IL-25 Expression
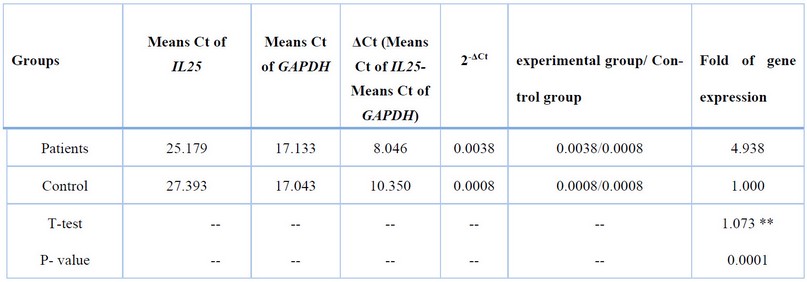
The mean Ct value of IL-25cDNA amplification was (25.179) in the patient's group. On the other hand, the mean Ct value in the Healthy group was (27.393), Table (6). There was a significant difference in the mean Ct values between the two study groups (P≤0.01).
** (P≤0.01).
Table 6. Fold of IL25 expression Depending on 2-ΔCtMethod.
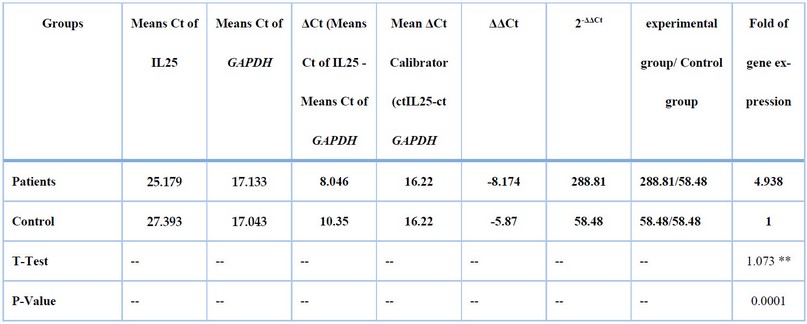
Table (6 ) shows the calibration that was used, and it was one of the control samples with high expression of IL-25. Data in Table (7) represent mean values of 2-ΔΔCt of the patient group with asthma (288.81), while the mean value for the control nonasthmatic group was (58.48). There was a significant difference between the two groups regarding the mean2-ΔΔCt, (p≤0.01)
** (P≤0.01).
Table 7. Fold of IL25 expression Depending on the 2-ΔΔCt method.
As shown in Table (7), the calculation of the gene expression was more significant in the patient group than in the control group4.938 times. The mean Ct values in the healthy nonasthmatic group were higher than those of the asthmatic patient group. This is important in reflecting the original mRNAs present in the samples. It is evident from these results that the patient group is associated with the highest copy number of mRNAs, reflecting its higher expression. In this study, the mRNA expression of IL-25 was analyzed using qRT-PCR assay, and the results were compared between the healthy controls and asthmatic patients group. The relative expression of the IL-25 gene in all study groups was calculated using the2-ΔΔCt method. The mean of 2-ΔΔCt values of the healthy group was 58.48, while in asthma patients, it was 288.81, as shown in Table (7 ). There was a significant difference between these two groups (P=0.0001).
The quantification PCR reaction was run in triplicate for each sample. Samples from the healthy and asthma groups were used in each run. Plots of each run (i.e., amplification plots and dissociation curves) were also recorded. Figures 1, 2, 3, and 4 present the amplification plots and dissociation curves for GAPDH and IL-25, respectively
Measurement of serum level of IL-25
Table (8) and Figure (5) show Concentrations of IL-25 in the blood serum of asthmatic patients and control group. That represents the significance between asthmatic patients and the control group (P≤0.01). The Mean ± SE of asthma Patients(29.30± 5.107317 pg./ml) and mean ± SE of the control group (15.16±0.085248 pg./ml). IL-25 plays an essential role in bronchial asthma because the release of this interleukin is increased in the damaged bronchial epithelium.
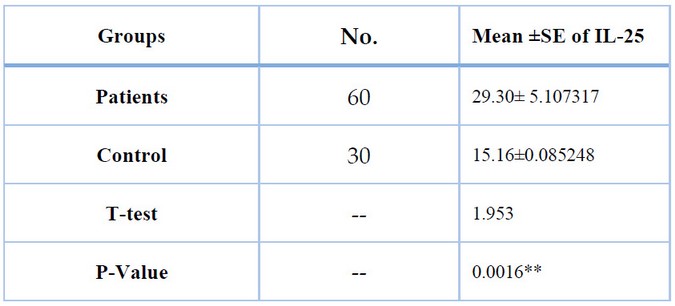
** (P≤0.01).
Table 8. Comparison between patients and control groups in IL-25 level.
DISCUSSION
The current study aimed to evaluate the potential effect of IL-25 expression on asthma risk. These results are consistent with those reported in previously published studies 11.
The results agreed with 9, 11, as IL-25 levels were higher in severe asthmatics than in the control group. Thus, it is used as a suitable marker of allergic asthma. However, This result is incompatible with the study of 12, who found in their studies on assays of Il25 in the serum of asthmatic patients that IL-25 in patients with severe asthma is no higher than that of nonasthmatic individuals and claims that any significant role for IL-25 in severe asthma is likely to be localized to the lungs and bronchial tissues 12. at the same time, 13 on their study on pediatric asthma shows that the serum level of IL-25 has a highly significant (P= 0.000) association with susceptibility to asthma. The epithelial cytokines IL-25 have been implicated in asthma pathogenesis because they promote Th2-type cytokine synthesis. This study shows the role of interleukin 25 in the airway inflammation. Also, Our study agrees with a study conducted by 6, who reported the association between high serum concentration of IL-25 and asthmatic patients.
CONCLUSIONS
The study revealed the association between increased IL-25 mRNA expressions and serum IL-25 concentrations in patients with severe asthma compared to the healthy control group. However, the current study concluded that Il-25 is upregulated in severe asthma patients with increased concentration in blood serum.
REFERENCES
1. Syabbalo,N. The Role of Alarmin Cytokines in the Pathogenesis and Treatment of Severe Uncontrolled Asthma. Ann .Clin. Med .Res. 2021; 2(1): 1022
2. Global strategy for Asthma management and prevention ,(2020) WHO
3. Stern, J.; Pier, J.and Litonjua, AA editors. Asthma epidemiology and risk factors. Seminars in immunopathology; 2020: Springer
4. Du,L.; Xu ,C.; Zeng,Z.; Chen,F. ; Tang,K.; Liang,Y.; and Guo,Y. Exploration of induced sputum BIRC3 levels and clinical implications in asthma. BMC Pulmonary Medicine ,22:86. 2022.
5. Reynauld, J.C. New insight into the role of cytokines in asthma. J. Clin. Pathol. 2001; 54(8):577-89
6. Thabit S S, Awad M M, Abdulateef S M. Effects of In-Ovo Injection of sialic acid on Chick's embryonic development and physiological traits. Revis Bionatura 2023;8 (2) 49. http://dx.doi.org/10.21931/RB/2023.08.02.49
7. Noaman A I, Khalaf R M, Emad GH, Al-Abbasy, Mohammed Th. T. Effect of flaxseed oil dosing on fertility, growth characteristics and some physical, biochemical, and hormonal blood parameters during the early pregnancy of Awassi ewes. Revis Bionatura. 2022;7(4) 5. http://dx.doi.org/10.21931/RB/2022.07.04.5.
8. Kouzaki, H., Tojima, I.; Kita, H.; and Shimizu, T. Transcription of interleukin-25 and extracellular release of the protein is regulated by allergen proteases in airway epithelial cells. Am. J. Respir. Cell Mol. Biol. 2013 ,49(5):741-50.
9. Cheng, D.; Xue, Z.; Yi,L. ; Shi,H.; Zhang,K. ; Huo,Z. ; BonserR.A.; Zhao,J. , Xu,Y.; Erle , D.J.and Zhen,G. Epithelial Interleukin-25 Is a Key Mediator in Th2-High, Corticosteroid-Responsive Asthma. Am. J. Respir. Crit. Care. Med. 2014, Vol 190 (6) : pp 639–648,
10. Schmittgen, T.D. and Livak, K.J. Analyzing real-time PCR data by the comparative CT method. Nat. Protoc. 2008; 3(6):1101-8
11. YAO,X.; SUN,Y.; WANG,W; AND SUN3Y. Interleukin (IL)-25: Pleiotropic roles in asthma,Review. Respirology. 2016 .21, 638–647
12. Khairi, I. R. .; Salman, M. A. . Effect Of Plant Growth Regulators On In Vitro And Ex Vitro Conditions On Propagation Of Dianthus Caryophllus L. JLSAR 2021, 2, 54–60.
13. AL-Hasnawi ,A.T.N. and AL-Hasnawi ,S.M.J. Role of interleukin 25 and interleukin 33 as immunological markers in pediatric asthma . Eurasia J. Biosci. 2020; 14, 4625-4630
14. Cary N. Statistical analysis system, User's guide. Statistical. Version 9. SAS Inst Inc USA. 2012.
15. Li ,P.; Du, J.; Goodier, J.L.; Hou, J.; Kang, J. ; Kazazian, H.H., et al. Aicardi–Goutières syndrome protein TREX1 suppresses L1 and maintains genome integrity through exonuclease-independent ORF1p depletion. Nucleic Acids Res. 2017;45(8):4619-31
Received: 26 September 2023 / Accepted: 15 April 2023 / Published: 15 December 2023
Citation: ALSaadi,B.Q.H.; Ali, M.H. Association of serum level and gene expression of IL-25 in a sample of Iraqi asthmatic patients. Revis Bionatura 2023;8 (4) 84. http://dx.doi.org/10.21931/RB/2023.08.04.84
Publisher’s Note: Bionatura stays neutral with regard to jurisdictional claims in published maps and institutional affiliations.
Copyright: © 2022 by the authors. Submitted for possible open-access publication under the terms and conditions of the Creative Commons Attribution (CC BY) license (https://creativecommons.org/licenses/by/4.0/).