2023.08.03.33
Files > Volume 8 > Vol 8 No 3 2023
Suitability of Flours and Gels From Crops Affected by Climate Change in Honduras: Crystallinity, Thermal, Dynamic Rheological and Textural Behavior

Caleb S. Calix-Rivera 1,2* , Felicidad Ronda1
1 Department of Agriculture and Forestry Engineering, Food Technology, College of Agricultural and Forestry Engineering, University of Valladolid, Palencia, Spain.
2 Department of Agroindustrial Engineering, Pacific Littoral Regional University Center, National Autonomous University of Honduras (UNAH), Choluteca, Honduras.
* Correspondence: [email protected]
Available from: http://dx.doi.org/10.21931/RB/2023.08.03.33
ABSTRACT
In Honduras, various tubers, roots, and cereals are cultivated as starchy crops. The current climatic crisis affects these crops' productivity, leading to an increase in agricultural residue, resulting in food insecurity. Agricultural residues from these crops have the potential to be processed, marketed, and contribute to the regular diets of consumers. In addition to serving as an essential source of carbohydrates, these crops provide several nutrients and health benefits. This study aimed to characterize the flours and gels of Colocasia esculenta (taro), Manihot esculenta (cassava), and Zea mays (maize) in terms of crystallinity and thermal parameters for flours and dynamic rheological, firmness, and color behavior of gels. The relative crystallinity of the selected crop samples is reported. There were considerable variations in the thermal parameters among the three cultivars. All flour suspensions at different concentrations led to gels with solid-like behavior (G′ > G″) at 25 °C, with the highest consistency for maize gels at the same concentration. The Avrami mathematical model was effectively applied to analyze the firmness kinetics of taro, cassava, and maize gels stored at 4 °C. All properties characterized suggest that flours from these crops affected by climate change would be suitable ingredients in different food formulations.
Keywords: Food security; Climate change; Crystallinity; Thermal properties; Gel rheology.
INTRODUCTION
Food security (FS) is determined by 1) the availability of enough quality food within the community/country at all times; 2) adequate economic and physical access at the household and individual level; 3) the utilization of this food within the family, as well as access to clean water and good sanitation conditions allowing the safe preparation of food1. The importance of global food security, food loss and waste has increased over the last few decades and was included in the 2015 United Nations Sustainable Development Goals (SDGs)2. The United Nations' Agenda 2030 emphasizes food security, good health and human well-being in achieving sustainable development3. Therefore, the international agenda has dedicated certain SDGs to achieve global food security and, as a side effect, the mitigation of climate change (SDGs: 2 (Zero Hunger), 3 (Good Health and Well-being), 12 (Responsible Consumption and Production) and 13 (Climate Action)). In recent years, multiple overlapping challenges have emerged to global food security, including climate change, conflicts, and the COVID-19 pandemic, with inequitable impacts in low- and middle-income countries (LMICs)4. The effects of climate change in the tropics are expected to produce significant environmental changes, impacting the environment, health, well-being, and economic development of half of the planet's population by 20505. According to the IPCC (Intergovernmental Panel on Climate Change), society and natural systems in the Mesoamerican region are highly vulnerable to extreme climate events. This is due to a combination of two geographical reasons (confluence of various ocean currents, effects of periodic climate oscillations such as El Niño/La Niña) and economic and social factors (low social development, inequity in the distribution of wealth, low adaptive capacity)6.
Honduras, one of the poorest countries in the Western Hemisphere, falls in Central America's 'Dry Corridor' area. The country is 'highly exposed' to major climate-change-related events, such as hurricanes, storms, and drought; moreover, its population is more than 50 % rural and thus highly dependent on the crops and natural resources that can be decimated by extreme weather events7. The agricultural sector in Honduras employs 35% of the country’s economically active population. It generates almost 13% of the Gross Domestic Product (GDP)8, Major food crops (maize, beans, rice, sorghum) are rainfed, making agricultural livelihoods and food security highly dependent on stable climatic conditions9. Rising atmospheric temperatures, varying rainfall patterns, and increasing incidence of extreme events characterize climate change. All these will directly and indirectly affect the productivity and sustainability of the agricultural sector and have implications for technology development and transfer10, potentially threatening the sustainability of agriculture in Honduras. Changes in crop production cycles, yield losses, increased incidence of pests and diseases, failure of rainfed crops and increased need for irrigation, reduced soil productivity from water stress, runoff, nutrient leaching and erosion, loss of crop suitability at lower altitudes and increased food prices, food insecurity and migration flows, are some of the climate risks to agriculture projected for Honduras9. The effect of climate change on crop production cycles in various areas of Honduras leads to the loss of crops, aggravating the food and nutritional security of each region and causing a large amount of waste or discarded products (with no market value) that causes innumerable economic losses to producers and the country. The production of flour suitable for human consumption from these crop wastes and sub-products is an idea that could significantly impact improving food security, adaptation and mitigation of climate change, and the sustainable management of natural resources in these regions. Three crops suffering from the effects of the climatic crisis in Honduras are taro or "malanga" (Colocasia esculenta), cassava or “yuca” (Manihot esculenta) and maize (Zea mays), which are considered starchy crops by botanical nature. These food crops affected by climate change have become underutilized, possibly due to the lack of knowledge on processability. Starchy foods contain different functional compounds that can promote a healthy lifestyle for consumers. Starch plays a major role in the processing of food products as a raw material or additive, which acts as a thickening agent, stabilizer and texture improver11. Therefore, this study aimed to study the crystalline and thermal properties of taro, cassava and maize flours and evaluate the gels' rheological, firmness and color characteristics. Thus, expanding the knowledge of these properties of the different crops may result in introducing novel applications for the food industry, the development of new foods such as gel-like products, applications in fermented beverages, confectionery and bakery industries, and the non-food industry.
MATERIALS AND METHODS
Materials
Various producers of the SAN R11 Bureau in El Paraíso, Honduras, provided agricultural residues from the crops (taro, cassava and maize). Flour samples evaluated were obtained from crops ruined and affected by climate change and did not meet the quality requirements for commercialization. Taro and cassava were washed, peeled, and cut into slices with an approximate thickness between 0.1 - 0.3 cm. Samples were dried at 60 °C for 7 by a dehydrator (Agropec, Honduras). The dried samples were ground using a lab-scale grinder and subsequently sieved using a 600 µm mesh size. In the case of maize, grains were previously crushed into smaller fragments using a manual hammer mill (Corona, Colombia) before being dried and then subjected to the same procedure as the other samples. The resulting flours (< 600 µm) were stored in plastic packets at 4 °C for further assays. The moisture content determined using method 44-10 of AACC12 of the taro, cassava and maize flours were 7.58%, 11.2% and 11.67%, respectively. Ash content, measured with method 08-01 of AACC12, was 3.39%, 1.39% and 0.53%. Fat content was determined according to the official AOAC method 923.05–1923 (AOAC., 1996) of the taro, cassava and maize flours were 1.1%, 2.6% and 4.4%, respectively. Protein content was calculated from total nitrogen (N) evaluated by an automatic combustion method using a Leco CNS 928 microanalyzer (Leco Corporation, St. Joseph, MI. USA). They used the conversion factor 6.25 (N × 6.25), obtaining 4.16%, 2.24% and 7.35%. Total starch and amylose content was determined with the optional rapid method for total starch described by Englyst et al. (2000)13 using an amylose/amylopectin assay kit (Megazyme, Wicklow, Ireland), obtaining total starch contents of 78 ± 3, 89 ± 13 and 87 ± 9 g/100 g dry matter basis and amylose content of 13 ± 1, 18.4 ± 0.5 and 23 ± 1 g/100 g starch for taro, cassava and maize, respectively. All the assays were conducted in duplicate.
XDR Patterns of Flours
X-ray diffractograms were obtained using a Bruker-D8- Discover-A25 diffractometer (Bruker AXS, Rheinfelden, Germany), furnished with a copper tube operating at a voltage of 40 kV and a current of 40 mA. The instrument employed Cu-Kα radiation (λ = 0.154 nm). Before measurement, all samples were equilibrated to 15% humidity using a saturated humidity ICP260 incubator (Memmert GmbH, Germany) at 15 °C. Equilibrated samples were scanned from 5◦ to 40◦ at 2θ diffraction angle, with a step size of 0.02◦, at a rate of 1.2 ◦/min, divergence slit width of 1◦ and a scatter slit width of 2.92◦. Crystallinity degree was determined from diffractograms as the ratio between the reduced peak area assigned to the crystalline part and the total area using peak-fitting software DifracEVA with PDF2-2004 and Crystallography Open Database.
Thermal properties
Differential scanning calorimetry (DSC) measurements of the flour samples were performed with DSC3 equipment (Mettler Toledo, Barcelona, Spain). Approximately 6 mg of flour samples were carefully measured and placed into aluminum pans with a volume of 40 μL. Subsequently, distilled water was added to achieve a ratio of 30 parts flour to 70 parts water, after which the pans were sealed. The sealed pans were equilibrated for 30 minutes at room temperature (25 °C), after which they were subjected to scanning from 0 to 110 °C at a rate of 5 °C/min. Indium and zinc were used for calibration, while an empty sealed pan was the reference. The obtained thermograms were analyzed using STARe evaluation software (Mettler Toledo, Barcelona, Spain). The enthalpy change (∆H, J/g dry basis) and the gelatinization temperatures [onset (TO), peak (TP), and endset (TE)] were recorded. Endothermic transitions of the retrograded starches were determined with a second scan after 7 days of sample storage at 4 °C, following the same procedure described for the gelatinization evaluation. Thermal tests were carried out in duplicate.
Dynamic Rheological Characteristics
The dynamic oscillatory assays were performed using a Kinexus Pro+ rheometer (Malvern Instruments Ltd, UK) with serrated parallel plate geometry (40 mm diameter) and a working gap of 1 mm. Dispersions of flour in water at five concentration levels were applied. Amounts of flour between 2.0 and 4.0 g (14% moisture basis) were weighed and mixed with 25 g of distilled water; suspenions were used to prepare the gels by a Rapid Visco Analyser (RVA 4500, Perten Instruments, PerkinElmer, Sydney, Australia). The final concentration (w/w) values of suspensions are given in Table 1. The suspensions were stirred at 160 revolutions per minute (rpm). The process involved heating from 50 to 95 °C at a rate of 12.2 °C/min, with a held period at 95 °C for 2.5 minutes. After this, cooling ensued, lowering the temperature to 50 °C at 11.8 °C/min and maintaining it at 50 °C for 2 minutes (RVA, Standard 1). The resultant hot pastes from the RVA were quickly moved onto the parallel plates. The excess suspension was removed, and a thin layer of vaseline oil was applied to cover the exposed sample surfaces and prevent moisture loss due to evaporation during the assays14. Before the measurement, the suspension was rested for 5 min to allow relaxation. The temperature was stabilized at 25 °C using a Peltier plate controller. Strain sweeps were conducted from a 0.1 to 1000% strain, maintaining a consistent frequency of 1 Hz. Through these sweeps, the maximum stress (τmax) was determined, representing the point at which the gel structure was broken (corresponding to the linear viscoelastic zone, LVR) and the stress at the crossover point (G′ = G″) was established. Frequency sweeps were performed, scanning from 10 to 1 Hz while applying a consistent strain of 1%. This strain value fell within the linear viscoelastic region (LVR). Data obtained from frequency sweeps were fitted to the power law model described by Abebe & Ronda (2014)15. The coefficients G1′, G1″, and (tan δ)1 (G1″/ G1′) represent the elastic and viscous moduli and the loss tangent at 1 Hz, respectively. These values were derived by fitting the power law to the frequency sweep data ranging from 10 to 1 Hz. Moreover, the values a, b, and c (b-a) correspond to the exponents within the respective potential equations and quantify the dependence of the dynamic moduli on the oscillation frequency. All tests were completed in duplicate.
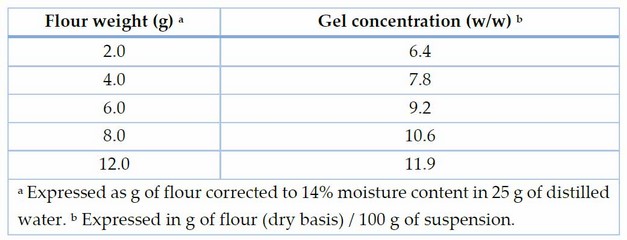
Table 1. Relationship between weighed flour masses and their corresponding concentrations.
Firmness behavior of fresh and aged gels
A TA-XT2 Texture Analyser (Stable Microsystems, Surrey, UK) was used to evaluate the firmness of flour gels; texture plots were analyzed by Texture Expert software. Gels were made from a 20% (w/w) suspension for taro and cassava flours and 12% (w/w) for maize flour (28.5 g total weight) by using the RVA. The suspensions were stirred with a rotating paddle at 960 revolutions per minute (rpm) for 10 seconds and kept at 160 rpm during the entire assay. The temperature was gradually increased from 50 to 95 °C at a rate of 6 °C/min and maintained at 95 °C for 15 min. This was succeeded by swift cooling through cold running water for 1 min. Subsequently, the canisters underwent additional cooling within a water bath maintained at 4 °C for 2 h. Following this cooling period, samples were stored in the same canisters (hermetically closed to prevent moisture loss) at (4 ± 2) °C for 0, 24, 72 and 168 h, and the evolution of gel firmness kinetics with time was evaluated. Gels were left at room temperature (20 ± 2 °C) for 30 min before the texture analysis. Measurements were done on gel cylinders of 2.2 cm diameter and 2 cm height. A double compression assay, known as "Texture Profile Analysis" (TPA), was conducted employing a 75 mm diameter aluminum device (SMSP/75). This device was utilized to compress to a depth of 50% at a testing speed of 1 mm/s. A 30-second interval was introduced between successive compressions. Firmness (N) was calculated from the TPA graphs, and data was fitted to the Avrami model (Equation 1) (Biliaderis (2009)16):

A∞ is the leveling-off value of firmness at infinite time, A0 is the firmness at initial time, At is the firmness at any time t, k is a velocity constant, and n is the Avrami exponent. k and n constants values were used to evaluate the value of half-life, t1/2 (Equation 2), this is described as the time needed to attain 50% of the plateau level of firmness (Ronda et al. (2015)17):

Half-life time gives an idea of the rate of the gel firmness change from its initial value, A0, to the leveling-off point, A∞. Each experimental sample was measured in duplicate.
Gels color
Gel color was measured at 0, 24, 72 and 168 h storages at 4 °C using the remaining samples that were utilized for evaluating the textural properties of the gel, described in Section 2.5 using a PCE-CSM5 (PCE Instruments, Meschede, Germany) and CQCS software. Results were derived using the CIE L*a*b* color space, employing the D65 standard illuminant and the 10ᵒ standard observer. From these coordinates, the chroma (C*) and hue (h) were computed using the following equations: C* = [(a*)2 + (b*)2]1/2 and h = tan-1 (b*/a*). The L* component ranges between 0 (representing black) to 100 (indicating white). The hue scale spans from 0 ᵒ (for red), 90 ᵒ (for yellow), 180 ᵒ (for green) to 270 ᵒ (for blue). The chroma value offers insights into color purity, where a C* value near to zero corresponds to a color of low purity, appearing close to grey. Conversely, high C* values indicate colors of greater purity, approaching the hues of pure spectral colors15. Results are the average of five measurements carried out on the gels of each flour.
Statistical analysis
Statistical analyses and fitting of the Avrami equation were conducted using the Statgraphics Centurion XIX software (Statgraphics Technologies, Inc., Virginia, U.S.A.). The analysis of the variance (ANOVA) by the Fisher least significant difference (LSD) test at p-value < 0.05 was performed.
RESULTS
X-ray diffraction analysis
The X-ray diffraction patterns of taro, cassava and maize samples are shown in Fig. 1. The most commonly used method to determine the type and degree of crystallinity in flours and starches is XRD18. This method determines the starch long-range crystalline order related to the packing of amylopectin double helices19. Generally, starch displays three types of patterns, namely, A (cereal starches) , B (tuber, amylomaize, and retrograded starch) and C (root and seed starches, pea and bean)20. All samples presented a diffraction pattern type A, characteristic of cereals, with peaks in 15, 17, 18, 23 and 26◦, and the reflection at 20◦, generally associated with V-crystallinity21,22. Taro and cassava presented X-ray pattern type A, exceptions to most of the tubers and roots that exhibit the typical X-ray pattern type B 18. This diffraction pattern agreed with that reported by Jane et al. (1992)23 for taro and Oyeyinka et al. (2019)24 for cassava. Higher crystallinity was observed in the cassava flour (55.4%) and maize (52.3%), whereas taro exhibited lower crystallinity (51.2%). It was indicated that cassava flour contained more ordered double helical structures25. The crystallinity of starch is mainly associated with amylopectin and not with amylose, which, although linear, has a conformation that makes its regular association with other chains difficult26; this is in agreement with the results obtained in the compositional analysis (Section 2.1); where taro presented the highest values of amylose content and therefore lower amylopectin content, showing a lower crystallinity. The crystallinity of taro and cassava samples was more elevated than Hoover (2001) reported 18 (taro 45% and cassava 38%). The difference was attributed to the different genotypes from various botanical origins.

Figure 1. X-ray diffraction patterns of taro (black), cassava (blue) and maize (green) (all samples were equilibrated in a saturated humidity chamber until 15 ± 0.5 % MC). Crystalline peaks and percentage relative crystallinity of individual samples are shown. Data have been offset for clarity.
Thermal characteristics
The gelatinization, retrogradation, and amylose-lipid complex data of taro, cassava and maize flours were determined by DSC. Thermal properties and DSC thermograms of studied flours are shown in Table 2 and Fig 2. Gelatinization characteristics could determine the purity or impurity of starch in the industry27 and provide new insights into the nature of gelatinization and granule structure16. Taro flour reported a single peak at (74.4 ± 0.1) °C with a transition enthalpy of (12.1 ± 0.1) J/g of flour dry basis, lacking the characteristic rise of the lipid amylose complex; these results are in agreement with findings by Aboubakar et al. (2008)28 and Himeda et al. (2014)29. Cassava flour showed two differentiated peaks at (74.1 ± 0.1) °C and (99.3 ± 0.1) °C with transition enthalpies of (13.7 ± 0.2) J/g of flour dry basis and (0.44 ± 0.05) J/g of flour dry basis respectively, lower values such as observed here had earlier been reported in cassava starch by Oyeyinka et al. (2019)24 due to the presence of non-starch components (mucilage) in cassava flour23. In contrast, Ayetigbo et al. (2018)27 reported similar TO, TP and ∆H values in cassava flours of Indonesian origin compared to this study. Maize flour had the first peak at the lowest temperature, (71.8 ± 0.1) °C, and a transition enthalpy of (9.3 ± 0.2) J/g of flour dry basis, and the second peak at a lower temperature to the cassava flour (96.9 ± 0.6) °C, with a higher transition enthalpy of (1.02 ± 0.03) J/g of flour dry basis. The starch gelatinization property manifests an irreversible dissociation of amylopectin molecular order involving the melt of crystallite and double helical orders30,31. The different flour samples showed significant differences in gelatinization enthalpy (∆Hgel); cassava and taro samples presented the highest values (13.7 and 12.1 J/g of solids, respectively), while maize presented the lowest (9.3 J/g of solids).

Table 2. Thermal properties of flours studied
Higher values of ∆Hgel are indicative of a better-packed starch structure requiring more energy to fully gelatinize32, and the lower value of gelatinization enthalpy is related to the small granule size of starch that decreases the length of amylopectin double helices, causing them to disorganize with minimum energy33. The differences observed in enthalpy gelatinization may be attributed to differences in several aspects such as starch botanical source, size, shape and distribution of starch granules in the flours, amylose/amylopectin ratio, the internal organization of starch fractions within granules, variations in protein fractions, presence of electrolytes and the interaction between starch, protein and lipids34,35. The gelatinization transition temperatures (TO (onset), TP (mid-point), TE (endset)) and showed significant differences. The differences observed could also be explained by the degree of interaction between starch crystallites and the interactions between crystalline and amorphous components27. Taro presented the highest value of onset temperature (TO) (68.6 °C), followed by cassava (66.9 °C) and, lastly, maize (65.5 °C). Peak temperature (TP), where the endothermic transition reaches a maximum, presented the highest value in taro flour (74.4 °C), while the lowest values were recorded in maize flour (71.8 °C). The higher values of TP indicate the requirement of more thermal energy to start gelatinization33. Lower TO, TP and TE values reflect the presence of abundant short amylopectin chains36 and higher amylose content, which means more amorphous region and less crystalline region37. This is consistent with the values of amylose content in the analyzed samples presented in section 2.1. The differences in transition temperatures between the different flours may be attributed to the differences in the degree of crystallinity. High transition temperatures have been reported to result from a high degree of crystallinity, which provides structural stability and makes the granule more resistant to gelatinization37. The width of the gelatinization temperature range (∆T = TE-TO) was the highest in cassava (14.7 °C), followed by maize (12.1 °C), a sample statistically equal to that of taro flour (11.4 °C). Lower values of the gelatinization peak width indicate higher starch crystallite homogeneity and a better organized granular structure, requiring a shorter temperature range to hydrate 32 fully. Gelatinization temperatures of samples may be influenced by the cultivation season, location of the cultivar, environmental factors and gene-associated factors.

Figure 2. Thermograms of the samples analyzed. Black lines represent taro, blue lines represent cassava, and green lines represent maize. A) First scan (gelatinization) and B) Second scan after 7 days at 4 °C (retrogradation).
When discussing the gelatinization temperature as an aspect of food processing, the starches or flours have lower gelatinization temperatures more preferable in foods containing heat-sensitive ingredients, and it could reduce the time-consuming and energy expenditure during processing11. The Enthalpy determined for the second peak obtained in the first scan (ΔHam-lip) corresponds to the amylose-lipid complex dissociation38. The amylose-lipid complex is described as a helical inclusion complex with amylose forming a helix around the hydrophobic chain of the ligand 38,39. The Taro sample did not show an amylose-lipid complex transition, probably due to the low lipid content16. At the same time, maize flour presented a higher amylose-lipid complex Enthalpy than the cassava sample. The differences observed may be attributed to the presence of internal monoacyl lipids. In the case of rice starch, these lipids tend to create complexes with amylose during heating. This exothermic reaction reduces the apparent Enthalpy associated with gelatinizing the starch crystallites40. The retrogradation properties of samples were investigated by re-scanning the samples after 7 days of storage at 4 °C (Table 2.). Retrogradation is related to the rapid gelation of amylose and recrystallization of amylopectin fractions41 and is a major factor in the staling of bread and other bakery products16. In thermograms (second run (Fig. 2B)), taro flour did not present a peak, cassava flour showed a single peak and maize flour reported two peaks. For cassava and maize, the first peak appeared at around 38 °C, corresponding to the melting of recrystallized amylopectin (∆Hret). In the case of the maize sample, the second peak corresponded to the reversible amylose–lipid complex dissociation peak (∆Ham-lip-ret)42. Higher ∆Hret values (p < 0.05) were shown in maize flour than in cassava flour, indicating that maize flour had a higher ability of amylopectin to reassociate after gelatinization. The retrogradation behavior of the taro sample indicates that this flour is suitable for preparing low-intensity taro flour products with a low retrogradation in the food industry. ∆Ham-lip in maize sample presented higher values in the second scan (retrogradation) than those determined in the first one (gelatinization), which may be attributed to the better conditions for complex formation after first heating following amylose leaking from starch granules that can occur at temperatures above the gelatinization temperature range32,39,42.
Dynamic rheological behavior
The viscoelastic behavior of pastes formed from taro, cassava and maize flour dispersions with different concentrations (Table 1) measured at 25 °C are depicted in Table 3. Viscoelastic properties were analyzed by dynamic oscillatory assays (frequency and strain sweeps). Table 3 shows the coefficients G1′, G1″, and (tan δ)1 (G1″/ G1′) and the exponents a, b, and c (b - a), obtained from frequency sweeps and the maximum stress (τmax) within the linear viscoelastic region (LVR) and the stress at the crossover point (G1′ = G1″, tan δ = 1) obtained from the strain sweeps42. The LVR varied notably (p < 0.05) depending on the concentration and the type of flour. The maximum stress (τmax) applicable within LVR, beyond which the gel structure was broken, increased with the gel concentration; similar trends were reported by Acevedo et al. (2013)34 for different legume flour gels and Deriu et al. 202232 for different cereal flour gels. In general, maize gels presented higher τmax values than cassava and taro flours in all concentrations. This means higher stability against shear, as they need higher stress to destroy their structure and achieve a predominantly viscous behavior. The strain sweep assays also provided the stress at which the gels passed from a solid-like to a liquid-like behavior (crossover point), which presented a similar trend at τmax varying in parallel. The coefficients G1′, G1″, and (tan δ)1 and the exponents a, b, and c were obtained by fitting the power law model to experimental data obtained from frequency sweeps data ranging between 1 and 10 Hz. The R2 values (0.953 - 0.999) demonstrate how well the model was adjusted to the system studied (data not shown). The storage modulus (G′) reflects the solid (elastic) characteristics and shows the amount of energy retained during the deformation of the samples. In contrast, loss modulus (G′′) measures the viscous property during shear and reveals the viscous nature of the samples43. Taro gels showed elastic and viscous moduli markedly lower than cassava and maize gels, denoting a weaker consistency of the former. Both moduli increased significantly (p < 0.05) when the flour concentration increased in all samples. However, the rate of increase varied depending on the type of flour. In the case of taro flour gels, the increase in elastic moduli was not so marked at the higher concentrations. The marked differences in gel rheological properties of the different flours could be attributed to differences in protein, starch, lipid, and non-starch polysaccharide types and their contents15. For all dispersions, G1′ > G1″, therefore (tan δ)1 <1, which suggests a solid elastic-like behavior. Similar trends were reported by Kapri & Bhattacharya (2008), Acevedo et al. (2013), Abebe & Ronda (2014), and Deriu et al. (2022)15,32,34,44 in gels from different sources. The effect of concentration and the type of flour were statistically significant (p < 0.05) (Table 3). In all samples, the value of (tan δ)1 or loss tangent decreased with increasing flour concentration. This performance reveals a strengthening of their structure with concentration 32 and a stronger gel behavior. The lowest values of the a and b exponents were shown for maize gels, decreased with increasing flour concentration in pastes, reaching reduction percentages from the lowest to the highest concentration studied (6.4 - 11.9 w/w) of 66% and 23% for exponents a and b respectively. This means that the G1 and G1″ were not dependent on the frequency for this sample, indicating the gels' structural stability of the gels15,34. In contrast, the increase of the exponent, mainly observed at the highest concentrations, implies a higher dependency of the storage modulus on the frequency of taro gel flours. Furthermore, the greater values of the b exponent in taro samples indicate a higher dependency of the loss modulus on the frequency. The value of the exponent c decreased as the gel concentration increased. This indicates that G1″ (loss modulus) and G1′ (storage modulus) exhibited a reduced frequency dependence at higher gel concentrations34. The high dependence of elastic and viscous modulus on concentration can offer insights into the gelation effectiveness and the underlying particle network structure of the gel15. This behavior can be adjusted to the power law model (As seen in Fig 3). Power-law functions between concentration and G1′ and G1″ were obtained for the dispersions: G1′ = m*Cn and G1″ = p*Cq, where m and p represent the G1′ and G1″ moduli values at a gel concentration of 1% and a frequency of 1 Hz, and n and q, the exponents, quantify the dependence degree of the viscoelastic moduli to the concentration and reflect the nature of the association behavior in the gel and its network structure32. Experimental data fitted the potential model well with R2 ranging between 0.900 – 0.999 (See Table 4). Several studies have reported the power law function between G′ and concentration; (Renkema & Vliet (2004))45 (Soybean protein isolates); (Avanza et al. (2005))46 (amaranth protein isolates); (Abebe & Ronda (2014))15 (tef); (Acevedo et al. (2013))34 (pigeon pea, dolichos bean and jack bean); (Deriu et al. (2022))32 (fonio). In the case of maize, the evolution of the elastic modulus with concentration would also be compatible with a linear model (G1′ = a*C + b) with R2 = 0.983 (Data not shown). Similar to the linear correlations between G′ and concentration for potato, wheat, corn and rice starch gels reported by Biliaderis & Juliano (1993)14. However, the potential equation was chosen to allow comparison among the samples analyzed to model the evolution of all flour gels' viscoelastic moduli versus concentration. The different variations of G1′ with the concentration among the gels of the flour samples could be mainly attributed to the relative differences in starches and proteins present within these flours15. Taro and cassava gels presented n values of 2.4 ± 0.1 and 2.65 ± 0.01, respectively. Lower values than maize flour gels (3.1 ± 0.1) reflect the formation of a less ordered gel matrix. This denotes a higher increase in maize gels’ viscoelastic moduli with flour concentration and a higher modulation capacity of the gel’s viscoelasticity by varying its concentration than taro and cassava gels. Furthermore, their viscoelastic moduli at low concentrations (obtained by the m and p coefficients) for maize samples were higher than those obtained for taro and cassava.

Table 3. Rheological properties of samples analyzed at different concentrations.

Table 4. Parameters obtained from fitting to the power-law model the experimental G' and G" data in function of the flour concentration in the gels (G1' = m · Cn; G1" = p · Cq).
In general the combination of a high consistency at low concentrations (compared to tef (Abebe & Ronda (2014)15) and pigeon pea, dolichos bean and jack bean (Acevedo et al. (2013)34)) and a high increase in consistency with increasing concentration (compared to rice (Abebe & Ronda (2014); Deriu et al. (2022)15,32)) makes at taro, cassava and maize exciting ingredients for the production of different products of gel-like nature.

Figure 3. Evolution of the elastic modulus (A) and viscous modulus (B) of gels made from taro (○), cassava () and maize (◊) flours versus gel concentration. The error bars represent the standard deviation.
Gel Firmness kinetics
The firmness, the force necessary to attain a given deformation, was obtained from the peak force value corresponding to the first two successive compressions 47. The evolution of the firmness of the gels from taro, cassava and maize flours stored at 4 °C between 0 h and 168 h (7 days) is depicted in Fig. 4. The retrogradation of flour gels mainly causes the flour gel firmness. This process is linked to the release of water and the crystallization of amylopectin, resulting in gels characterized by increased firmness48. The presence of protein, lipids, and fiber can also impact this phenomenon. The Avrami model is a mathematical model for studying the crystallization kinetics of starch49. The modeling of the firmness kinetics was effectively accomplished by applying the Avrami equation to the gathered data, as depicted by the continuous lines in Fig. 4. The high R2 values (ranging from 0.999 to 1) obtained demonstrate the excellent adjustment of the gels studied to this mathematic model. The values of the Avrami equation parameters (A∞, A0, k, n) were (3.98 ± 0.30) N, (2.74 ± 0.29) N, (0.006 ± 0.008) h-n, 1.06 ± 0.11 for taro gels, (5.64 ± 0.31) N, (3.88 ± 0.31) N, (0.06 ± 0.08) h-n, 0.65 ± 0.4 for cassava gels and (4.75 ± 0.28) N, (3.14 ± 0.30) N, (0.007 ± 0.009) h-n, 1.04 ± 0.09 for maize gels.

Figure 4. Firmness kinetics of gels stored at 4 C. The continuous lines resulted from fitting the experimental values to the Avrami equation. (○) taro, () cassava, (◊) maize.
Cassava gels showed A0 (initial firmness) values markedly higher than maize and taro gels. In addition, the firmness kinetics at refrigeration temperature (4 °C) was faster for the cassava gels than for the taro and maize; this can be concluded from the Avrami constant, k, which was ten times higher for cassava than taro and maize. A∞ (gel leveling-off firmness), presented the following order: taro < maize < cassava. This behavior was probably due to faster and more extensive amylopectin recrystallization in cassava than in maize and taro gels34,46. Half-life time (t1/2) values were 40, 88 and 90 h for cassava, maize and taro. This means cassava gel took much less time to reach 50% of the leveling-off firmness than the maize and taro. This indicates that the firmness of gel products from cassava could stabilize faster than taro and maize flour gels at the concentrations analyzed. The taro and cassava gels were made at 20% w/w to be compared with the maize gels (12%); at lower concentrations, these gels were fragile and collapsed when removed from the canisters.
Evolution of color in gels
Color is an essential organoleptic quality attribute that typically relates to the acceptability, marketability and wholesomeness of foods50, and is the first attribute that affects the consumer's decision to purchase or consume any food products47. The Commission Internationale de l’Eclairage (CIE) L*, a*, b* color system was utilized to assess the tri-stimulus surface color of gels from taro, cassava and maize flours. The L*, a* and b* values indicate the degree of lightness, redness-greenness and yellowness-blueness, respectively, exhibited by the surface color of a material27. The chromatic coordinates (a* - b*) of the taro, cassava and maize flour gels and their evolution with storage time at 4 °C are shown in Fig. 5. There were significant differences (p < 0.05) in the color of gels depending on the type of flour. The Luminosity (L*) values of the fresh gels are presented in the following order: taro (44.2) < cassava (62.9) < maize (74.3). Taro sample had a significantly lower value than cassava and maize. The darkness of taro gel could be due to non-enzymatic browning reactions induced by drying the taro slices during the processing of taro tubers into flour 51,52. The a* and b* color parameters between the three flours differed significantly (p < 0.05). As can be seen in Fig. 5. Taro gel had the highest positive a* (redness) value, the lowest negative b* (blueness) value and the highest hue angle value (357.7◦), presenting purple hues. In contrast, the maize gel flour showed the lowest negative a* (greenness) value, the highest positive b* (yellowness) and a hue angle value of 103.9◦. The difference in color between gel samples could be due to the intrinsic physicochemical characteristics of the cultivars (presence of flavonoids, anthocyanins and tannin).
Furthermore, genetic factors and conditions such as geographical location, environmental conditions, climate variations, cultivation practices like weeding and fertilizing, and the amount of precipitation could also contribute to these color discrepancies. Hence, in formulating foods where taro, cassava and maize could be taken as ingredients and brighter color is mandatory, maize could be the best preference among the three cultivars studied. Concerning the chroma (C*) of the gels studied, maize (14.5) had a significantly higher value (the most vivid color) than cassava (7.9) and taro (7.5) (the paler colors), which did not have significantly different C* value (p < 0.05). Wrolstad & Smith (2010)53 stated that the C* value of a food increases with increment of pigment concentration and decreases remarkably as the samples go darker, according to the results obtained in our study. The storage time had a significant effect (p < 0.05) on the color of the gels, mainly in the L* and C* values. In general, C* values decreased with the storage, while L* values depended on the type of flour. In taro gels, L* increased with the storage time, similar to what was reported by Abebe & Ronda15 in tef gels, and this parameter decreased for cassava and maize samples. Despite the statistical differences with storage time, the color difference [ΔE = ((ΔL*)2+(Δa*)2+(Δb*)2)1/2] was <5 for all samples, indicating that the color differences between fresh and stored samples (168h) were not perceptible to the human eye54,55. Results suggest that taro, cassava and corn gels show good color stability in short storage periods (7 days). This study opens the field for complementary studies to quantify the evolution of the pigments of the flours chemically analyzed and to evaluate the changes in longer storage periods.
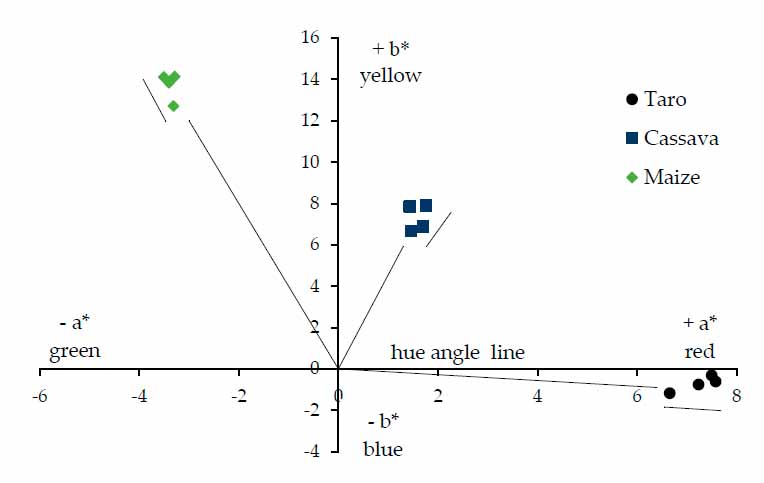
Figure 5. Plot of chromatic coordinates (a*-b*) of taro, cassava and maize flour gels stored at 4 °C for seven days. Each point represents the mean of five replicates. The arrows indicate the evolutions with storage time.
CONCLUSIONS
This study provides essential information on the crystalline and thermal characteristics of flours and the color, rheological and textural properties of gels from crops affected by climate change in Honduras. Taro, cassava and maize flours are mainly made of carbohydrates and particularly starch; this confers them specific characteristics for their potential use as food ingredients. All flours showed high crystallinity values and A-type diffraction patterns. Taro presented a single gelatinization peak, while cassava and maize showed two peaks. The gelatinization enthalpies are systematically higher for cassava flours than taro and maize flours. Gels obtained at different flour concentrations exhibited a solid elastic-like behavior in all flours. According to the power law, the storage and loss moduli of the gels formed from the suspensions significantly increased (p < 0.05) with increasing flour concentration. At the same concentration levels, gels from maize consistently showed a higher consistency. All flours could form self-supporting gels and be applied to form gel-like foods. However, taro and cassava flours required higher concentrations for this purpose. The Avrami model was successfully used to analyze the firmness kinetics of taro, cassava, and maize gels stored at 4 °C. Cassava flour had the highest initial firmness among the different flour gels tested. However, the evolution of the firmness of the taro gels varied notably during storage, taking a longer time to level off. Hence, obtaining a stabilized gel product from taro flour will take longer. This could be considered a drawback of taro flour gels.
The crops analyzed in this study have demonstrated their potential as suitable food ingredients for developing gel-like foods. Depending on the chosen concentration and botanical origin, a wide range of consistencies, texture properties, and colors can be achieved. This versatility allows for the formulation various gel-like food products with distinct characteristics and sensory attributes. Overall, the data highlight the potential role of these crops available in Honduras as sources of flours and starches with peculiar physicochemical and functional characteristics that may be used for various applications in the food industry. This would improve the Honduran population's quality of life and food security. Furthermore, this opens up the possibility of investigating possible non-food uses for applications such as bioplastics, adhesives, pharmaceutical excipients, etc., which would benefit the producers economically.
Author Contributions: Caleb S. Calix-Rivera: Writing – original draft, Writing – review & editing, Formal analysis, conceptualization, methodology, conceived and designed the experiments; Analyzed and interpreted the data; Contributed analysis tools or data; Wrote the paper, performed the experiments. Felicidad Ronda: Funding acquisition, Resources, Investigation, Visualization, Supervision, Writing – review & and editing, Project administration, Formal analysis, conceived and designed the experiments; Contributed reagents, materials
Funding: The authors thank the financial support of the Ministerio de Ciencia e Innovación (PID2019-110809RBI00/AEI/10.1303/501100011033) and the Junta de Castilla y León/FEDER (VA195P20).
Informed Consent Statement: Not applicable
Acknowledgments: Authors thank the project Bioplástico EUROSAN / UNAH-TEC Danlí (Grant contract external actions of the European Union No. LA/2019/406-056). Professor Octavio Rivera-Flores and laboratory technicians Karla Martinez and Genesis Nohal Limas for their help in processing the flours analyzed. Caleb S. Calix-Rivera thanks the University of Valladolid for the doctorate grant.
Conflicts of Interest: The authors declare no conflict of interest.
REFERENCES
1. Kumar, S., Christakis, N. A. & Pérez-Escamilla, R. Household food insecurity and health in a high-migration area in rural Honduras. SSM - Popul. Heal. 2021, 15.
2. Amicarelli, V. & Bux, C. Food waste measurement toward a fair, healthy and environmental-friendly food system: a critical review. Br. Food J. 2021, 123, 2907–2935.
3. United Nations. Transforming our world: The 2030 agenda for sustainable development. United Nations General Assembly (2015).
4. Lara-Arévalo, J., Escobar-Burgos, L., Moore, E. R. H., Neff, R. & Spiker, M. L. COVID-19, Climate Change, and Conflict in Honduras: A food system disruption analysis. Global Food Security 2023, 37, 100693.
5. Mardero, S. et al. Traditional knowledge for climate change adaptation in Mesoamerica : A systematic review. Soc. Sci. Humanit. Open 2023, 7, 100473.
6. Jara, M. C. ABC del cambio climático en Mesoamérica. (2010).
7. Palacios, H. V., Sexsmith, K., Matheu, M. & Gonzalez, A. R. Gendered adaptations to climate change in the Honduran coffee sector. Womens. Stud. Int. Forum 2023, 98, 102720.
8. Derlangen, C., De Salvo, C. P., Egas Yerovi, J. J. & Pierre, G. Análisis de políticas agropecuarias en honduras. www.iadb.org/agrimonitor (2019) doi:https://doi.org/ 10.18235/0002274.
9. USAID. Climate change risk profile: Honduras. USAID 1–5 https://www.climatelinks.org/sites/default/files/asset/document/2017_USAID ATLAS_Climate Change Risk Profile_Honduras.pdf (2017).
10. Rao, C. A. R. et al. Impact of climate change on the productivity of food crops : a sub-national level assessment for India Impact of climate change on the productivity of food crops : a sub-national level assessment for India. Environ. Res. Commun. 2022, 4, 095001.
11. Chiranthika, N. N. G., Chandrasekara, A. & Gunathilake, K. D. P. P. Physicochemical characterization of flours and starches derived from selected underutilized roots and tuber crops grown in Sri Lanka. Food Hydrocoll. 2022, 124, 107272.
12. AACC. Approved Methods of the American Association of Cereal Chemists. (AACC, 2000).
13. Englyst, O. N., Hudson, G. J. & Englyst, H. N. Starch analysis in food. in Encyclopedia of Analytical Chemistry (ed. R.A. Meyers (Ed.)) vol. 6 pp 4246–4262 (John Wiley & Sons Ltd, 2000).
14. Biliaderis, C. G. & Juliano, B. O. Thermal and mechanical properties of concentrated rice starch gels of varying composition. Food Chem. 1993, 48, 243–250.
15. Abebe, W. & Ronda, F. Rheological and textural properties of tef [Eragrostis tef (Zucc.) Trotter] grain flour gels. J. Cereal Sci. 2014, 60, 122–130.
16. Biliaderis, C. G. Structural Transitions and Related Physical Properties of Starch. in Starch (Third Edition) (ed. James BeMiller, R. W.) 293–372 (Academic Press, 2009). doi:10.1016/B978-0-12-746275-2.00008-2.
17. Ronda, F., Abebe, W., Pérez-Quirce, S. & Collar, C. Suitability of tef varieties in mixed wheat flour bread matrices: A physico-chemical and nutritional approach. J. Cereal Sci. 2015, 64, 139–146.
18. Hoover, R. Composition, molecular structure, and physicochemical properties of tuber and root starches: A review. Carbohydr. Polym. 2001, 45, 253–267.
19. Solaesa, Á. G., Villanueva, M., Vela, A. J. & Ronda, F. Impact of microwave radiation on in vitro starch digestibility, structural and thermal properties of rice flour. From dry to wet treatments. Int. J. Biol. Macromol. 2022, 222, 1768–1777.
20. Kumar, P. S., Saravanan, A., Sheeba, N. & Uma, S. Structural, functional characterization and physicochemical properties of green banana flour from dessert and plantain bananas (Musa spp.). LWT 2019, 116, 108524.
21. Vela, A. J., Villanueva, M., Solaesa, Á. G. & Ronda, F. Impact of high-intensity ultrasound waves on structural, functional, thermal and rheological properties of rice flour and its biopolymers structural features. Food Hydrocoll. 2021, 113.
22. Vela, A. J., Villanueva, M. & Ronda, F. Low-frequency ultrasonication modulates the impact of annealing on physicochemical and functional properties of rice flour. Food Hydrocoll. 2021, 120, 106933.
23. Jane, J. Shen, L. Chen, J. Lim, S. Kasemsuwan, T. Nip, W K. Physical and Chemical Studies of Taro Starches and Flours. Cereal Chem. 1992, 69, 528–535.
24. Oyeyinka, S. A., Adeloye, A. A., Smith, S. A., Adesina, B. O. & Akinwande, F. F. Physicochemical properties of flour and starch from two cassava varieties. Agrosearch 2019, 19, 28.
25. Wang, M. Liu, G. Li, J. Wang, W. Hu, A. Zheng, J. Structural and physicochemical properties of resistant starch under combined treatments of ultrasound, microwave, and enzyme. Int. J. Biol. Macromol. 2023, 232.
26. Cavallini, O. F. Caracterização físico-química do amido e da farinha da fruta-pão (Artocarpus altilis) e aplicação em pão de forma. (Universidade Federal do Espírito Santo, 2015).
27. Ayetigbo, O., Latif, S., Abass, A. & Müller, J. Comparing characteristics of root, flour and starch of biofortified yellow-flesh and white-flesh cassava variants, and sustainability considerations: A review. Sustainability (Switzerland) 2018, 10, 3089.
28. Aboubakar, Njintang, Y. N., Scher, J. & Mbofung, C. M. F. Physicochemical, thermal properties and microstructure of six varieties of taro (Colocasia esculenta L. Schott) flours and starches. J. Food Eng. 2008, 86, 294–305.
29. Himeda, M. Njintang, Y.N. Gaiani, C. Nguimbou, R.M. Scher, J. Facho, B. Mbofung, C.M.F. Physicochemical and thermal properties of taro (Colocasia esculenta sp) powders as affected by state of maturity and drying method. J. Food Sci. Technol. 2014, 51, 1857–1865.
30. Bultosa, G. & Taylor, J. R. N. Chemical and physical characterization of grain tef [Eragrostis tef (Zucc.) Trotter] starch granule composition. Starch/Staerke 2003, 55, 304–312.
31. Dong, J. Huang, L. Chen, W. Zhu, Y. Dun, B. Shen, R. Effect of Heat-Moisture Treatments on Digestibility and Physicochemical Property of Whole Quinoa Flour. Foods 2021, 10, 342.
32. Deriu, A. G., Vela, A. J. & Ronda, F. Techno‐Functional and Gelling Properties of Acha (Fonio) (Digitaria exilis stapf) Flour: A Study of Its Potential as a New Gluten‐Free Starch Source in Industrial Applications. Foods 2022, 11, 183.
33. Nagar, C. K., Dash, S. K., Rayaguru, K., Pal, U. S. & Nedunchezhiyan, M. Isolation, characterization, modification and uses of taro starch: A review. Int. J. Biol. Macromol. 2021, 192, 574–589.
34. Acevedo, B. A., Avanza, M. V., Cháves, M. G. & Ronda, F. Gelation, thermal and pasting properties of pigeon pea (Cajanus cajan L.), Dolichos bean (Dolichos lablab L.) and jack bean (Canavalia ensiformis) flours. J. Food Eng. 2013, 119, 65–71.
35. Nwokocha, L. M. & Williams, P. A. Comparative study of physicochemical properties of breadfruit (Artocarpus altilis) and white yam starches. Carbohydr. Polym. 2011, 85, 294–302.
36. Hoover, R., Hughes, T., Chung, H. J. & Liu, Q. Composition, molecular structure, properties, and modification of pulse starches: A review. Food Res. Int. 2010, 43, 399–413.
37. Singh, N., Singh, J., Kaur, L., Singh Sodhi, N. & Singh Gill, B. Morphological, thermal and rheological properties of starches from different botanical sources. Food Chem. 2003, 81, 219–231.
38. Vela, A. J., Villanueva, M. & Ronda, F. Physical modification caused by acoustic cavitation improves rice flour bread-making performance. LWT 2023, 183, 114950.
39. Eliasson, A. C. Interactions between starch and lipids studied by DSC. Thermochim. Acta 1994, 246, 343–356.
40. Villanueva, M., Ronda, F., Moschakis, T., Lazaridou, A. & Biliaderis, C. G. Impact of acidification and protein fortification on thermal properties of rice, potato and tapioca starches and rheological behavior of their gels. Food Hydrocoll. 2018, 79, 20–29.
41. Sumnu, G. A review on microwave baking of foods. Int. J. Food Sci. Technol. 2001, 36, 117–127.
42. Calix-Rivera, C. S., Villanueva, M., Náthia-Neves, G. & Ronda, F. Changes on Techno-Functional, Thermal, Rheological, and Microstructural Properties of Tef Flours Induced by Microwave Radiation—Development of New Improved Gluten-Free Ingredients. Foods 2023, 12, 1345.
43. Barua, S. et al. Insights into the structural, thermal, crystalline and rheological behavior of various hydrothermally modified elephant foot yam (Amorphophallus paeoniifolius) starch. Food Hydrocoll. 2022, 129, 107672.
44. Kapri, A. & Bhattacharya, S. Gelling behavior of rice flour dispersions at different concentrations of solids and time of heating. J. Texture Stud. 2008, 39, 231–251.
45. Renkema, J. M. S. & Vliet, T. Van. Concentration dependence of dynamic moduli of heat-induced soy protein gels. Food Hydrocoll. 2004, 18, 483–487.
46. Avanza, M. V, Puppo, M. C. & An, M. C. Rheological characterization of amaranth protein gels. Food Hydrocoll. 2005, 19, 889–898.
47. Kaushal, P. & Sharma, H. K. Effect of incorporating taro (colocasia esculenta), rice (Oryza sativa), and pigeon pea (Cajanus cajan) flour blends on noodle properties. Int. J. Food Prop. 2014, 17, 765–781.
48. Pourmohammadi, K., Abedi, E., Hashemi, S. M. B. & Torri, L. Effects of sucrose, isomalt and maltodextrin on microstructural, thermal, pasting and textural properties of wheat and cassava starch gel. Int. J. Biol. Macromol. 2018, 120, 1935–1943.
49. Chang, Q., Zheng, B., Zhang, Y. & Zeng, H. A comprehensive review of the factors influencing the formation of retrograded starch. Int. J. Biol. Macromol. 2021, 186, 163–173.
50. Rafiq, S. I., Singh, S. & Saxena, D. C. Physical, physicochemical and anti-nutritional properties of Horse Chestnut (Aesculus indica) seed. J. Food Meas. Charact. 2016, 10, 302–310.
51. Rodríguez-Miranda, J. et al. Development of extruded snacks using taro (Colocasia esculenta) and nixtamalized maize (Zea mays) flour blends. Lwt 2011, 44, 673–680.
52. Njintang, Y. N. & Mbofung, C. M. F. Development of taro (Colocasia esculenta (L.) Schott) flour as an ingredient for food processing: Effect of gelatinization and drying temperature on the dehydration kinetics and color of flour. J. Food Eng. 2023, 58, 259–265.
53. Wrolstad, R. E. & Smith, D. E. Color Analysis. in Food Analysis (ed. Nielsen, S. S.) 573–586 (Springer New York Dordrecht Heidelberg London, 2010). doi: 10.1007/978-1-4419-1478-1_32.
54. García-Viguera, C. & Zafrilla, P. Changes in Anthocyanins during Food Processing : Influence on Color. in ACS Symposium Series 2001, 56–65. doi:10.1021/bk-2001-0775.ch004.
55. Solaesa, Á. G., Villanueva, M., Muñoz, J. M. & Ronda, F. Dry-heat treatment vs. heat-moisture treatment assisted by microwave radiation: Techno-functional and rheological modifications of rice flour. Lwt 2021, 141.
Received: 20 June 2023/ Accepted: 25 August 2023 / Published:15 September 2023