2022.07.02.43
Files > Volume 7 > Vol 7 No 2 2022

Esther Ivanova Matamoros1, Isidro R. Amaro2, Jonnathan Fabricio Salinas1
1. School of Biology Science and Engineering, Yachay Tech University of Technology and Research, Ecuador
2. School of Mathematical and Computational Sciences, Yachay Tech University, Ecuador
Corresponding author: Esther Ivanova Matamoros Alcivar E-mail: [email protected]
Available from: http://dx.doi.org/10.21931/RB/2022.07.02.43
ABSTRACT
An unhealthy diet is a risk factor for non-communicable diseases (NCDs). Data on the average protein supply and meat products between 1990-2017 consumed by the Ecuadorian population are collected. The HJ-Biplot method is used to identify clusters with MultBiplot software to obtain a two-dimensional representation of the data in the plane along with the quality of representation of the variables and the total variance explained.
This work aims to determine how much the source of protein, animal or vegetal, influences the amount of death caused by non-communicable diseases such as Cardiovascular diseases and Diabetes Mellitus. Finally, a Hierarchical Cluster Analysis is carried out with the food supply related to those diseases. It can be concluded that NCD mortality is primarily explained by the average protein supply of animal and meat products in Ecuador.
Keywords: Ecuador, Non-Communicable Diseases, Cardiovascular disease, Diabetes, HJ-Biplot, food, proteins.]
INTRODUCTION
By 2030, the UN Sustainable Development Goals aim to reduce premature mortality from non-communicable diseases (NCDs) by a third1. The most common is cardiovascular disease (CVD) which is responsible for an estimated 17.8 million deaths in 2017, and more than three quarters were in low-income and middle-income countries2,3. While, Diabetes mellitus (DM) has become one of the most pressing and prevalent diseases in the last few decades and now is the seventh leading cause of death worldwide, with 5.2 million deaths globally and a mortality rate of 82.4 per 100,0004.
Furthermore, tobacco, harmful alcohol use, unhealthy diet, and physical inactivity are the four behavioral risk or lifestyle factors that drive CVD epidemic3,5,6. An unhealthy diet is a modifiable risk factor for CVD, as well as DM, overweight, and obesity, are essential risk factors7.
There are strategies to reduce the high mortality rate, including accelerated tobacco control, salt reduction, healthy diets and physical activity, reduction of harmful alcohol consumption, and access to essential drugs and technologies 8,9. These strategies aim to reduce the number of premature deaths associated with chronic non-communicable diseases by 25% 2,10. Consequently, CVD death rates have decreased over the past few decades due to the improved prevention and treatment in high-income countries, but in low- and middle-income countries, it has increased between 2007 and 201711.
In Ecuador, for instance, Ischemic Heart Disease (IHD) occupied first place among the principal causes of death for several years. So by 2016, IHDs were the first cause of mortality in men and women12,13. Similarly, DM caused 5064 deaths in 2015, ranking as the second cause of general mortality, the first cause of death in women, and the third in men13. Besides, cardiovascular deaths account for 44% of death in those with type 1 DM and 52% of deaths in type 2 DM4.
Moreover, related to diets, dietary protein is integral to human health. However, there are controversies around the cardiovascular health effects of consuming animal-based and plant-based protein-rich foods14. Besides, increasing dietary protein may benefit cardiovascular health by aiding in weight loss/maintenance, improving the lipid/lipoprotein profile, and reducing blood pressure. In addition, the health benefits of dietary protein should interpret with caution since increasing the consumption of protein/protein-rich food typically results in other changes in diet, such as energy, nutrients, or food intake, depending on the source of the protein. Therefore, the specific protein food source determines the effect of increased protein consumption14,15.
Plant-based intake pattern does not exclude all animal products; instead, the primary source of protein relies on plant foods like fruit and vegetables, plant proteins, oils, nuts and seeds, and wholegrain carbohydrates16,17. Plant-based diets can improve blood lipid profiles, blood pressure, and weight management16,18, which reduces the risk of developing CVD and diabetes7,11. However, on the intake outcomes comparison, studies do not specify the type of diet or food given to subjects, whether animal-based or plant-based protein. And the plant protein sources (grains, legumes, soy, nuts, or whether they are low or high quality) or meats (red or white meat) are not specified.
This study analyses different food supplies across the population from 1990 to 2017 with data published by United Nations Food and Agricultural Organization (FAO)19. In addition, provided by Amnesty International, the annual number of death by cause in Ecuador during that period is also analyzed as a variable through the years. To determine a relationship between the food supply of Ecuadorians and the mortality rate of NCDs such as DM and CVD, HJ-Biplot and hierarchical Cluster Analysis is used to analyze the years when the animal-protein or meat supply plant-based proteins affected the number of death by NCDs.
METHODOLOGY
Data Collection
For this study, the variables are described in Table 1. The average supply of protein from animal products (g/ capita/ day), the average supply of plant-based protein products (g/ capita/ day), and the average supply of meat (kg/ capita/ year) are from data published by the United Nations Food and Agricultural Organization (FAO)19 where food supply defines as food available for human consumption. In addition, at the country level, in this case, Ecuador, it is calculated as the food remaining for human use after deduction of all non-food utilization. However, such values do not include consumption-level waste and therefore overestimate the average amount of food consumed19.

Table 1. Variable Description
The annual number of deaths by cause is from data published by Amnesty International20 that consists of executions, death sentences, and commutations and exonerations, where there is reasonable confirmation20.
RStudio Software
The multivariate statistical analysis used RStudio, an Integrated Development Environment (IDE) for the R programming language. RStudio combines various components of R into one seamless and productive workbench21. In addition, the MultBiplot22 and the SparseBiplot R-packages23 performed the HJ-Biplot and Hierarchical Cluster analysis.
The 'MultBiplot' package offers Several Multivariate Techniques from a biplot perspective22. While the 'SparseBiplot' Package implements three new techniques and constructs in each case an 'HJ-Biplot'. Based on the regularization theories, it adapts restrictions to reduce weights and/or produce zero weight in the dimensions. In addition, it implements three methods of regularization: Ridge, LASSO, and Elastic Net23.
HJ-Biplot analysis
The HJ-Biplot originally proposed by Galindo-Villardon24 presents the
advantages of Correspondence Analysis and applies to any data matrix, not just frequencies. It is a technique for inspecting multivariate data matrices with fewer restrictions than Correspondence or Factor Analysis. It has been applied to many fields of science. For instance, Cárdenas & Galindo25 cite applications in medicine, economics, biology, or environmental technology.
In this study, HJ-Biplot analysis was done using the 'SparseBiplot' Package, with the years as labels for the rows shown in Figure 1. The HJ-Biplot command returns values such as an eigenvalues vector, a vector containing the proportion of variance explained by the first principal components obtained, a matrix with the coordinates of individuals, matrix with the coordinates of variables. While the HJ-Biplot command of MultBiplot returns more values such as inertia and column contributions.
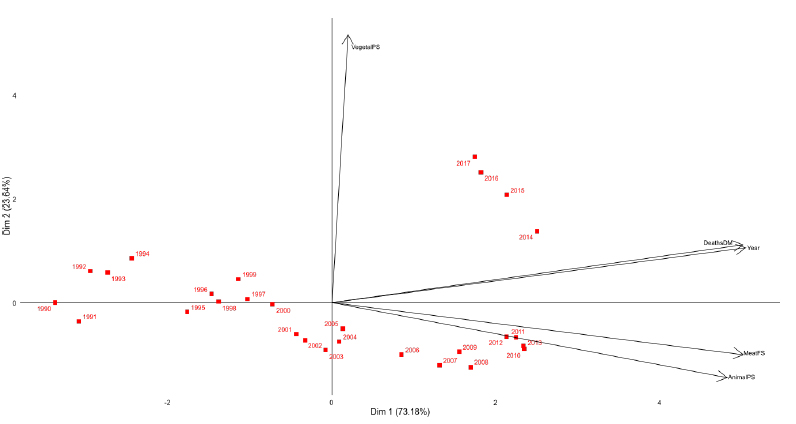
Figure 1. HJ-Biplot with SparseBiplot Package of Food supply and deaths by DM,1990-2017
Furthermore, the Biplot method, developed by Gabriel26, allows the representation of the data matrix (X(I*J)) in low dimensional space, facilitating interpretation. It uses vectors as markers i1, i2, …, ii for each row, and j1, j2, …, jj for each column, which are obtained from the usual singular value decomposition (SVD) of the data matrix27.
For this paper, the goal of the HJ-Biplot is to describe the relations between the row markers (years 1990-2017) and column markers (NCDs and food supplies, variables). The analysis of the HJ-Biplot is explained as follows: two variables separated by a minimal angle are strongly correlated; in addition, a group of years next to a variable indicates that the years have taken preponderant values for this variable27,28.
Cluster Analysis
The Hierarchical cluster analysis of n objects is a stepwise algorithm that merges two things with a high similarity at each step29,30. In this study, these differences between clusters of objects are defined by average linkage. The cluster analysis results are a binary tree, or dendrogram, with n–1 nodes31.
In this study, cluster analysis was performed using a hierarchical cluster using the HJ-Biplot (principal components) scores, Euclidean distances, and Ward's method. The linkage process used the MultBiplot Package as shown, for instance, in Figure 2.
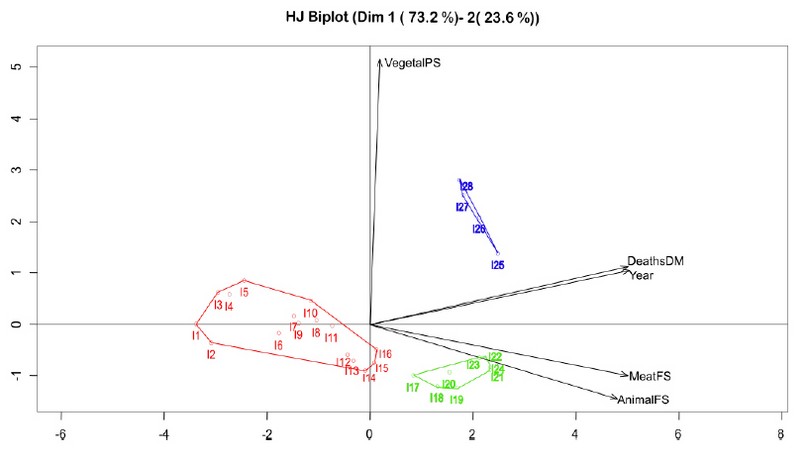
Figure 2. HJ-Biplot and Clusters formation with MultBiplot Package of Food supply and deaths by DM, 1990-2017
RESULTS AND DISCUSSION
Figure 1, the total absorption of information by the axes is 96.82%, and the vectors have similar vector lengths showing the same variability. Besides, the columns that contribute the most to dimension 1 (73.18%) are the average supply of protein from animal products, meat supply, and DM's deaths (see Table 2). Similarly, the years when the animal products have higher contributions to dimension 1 than the plant-based products. While the years (2003-2015,2017) dominated by plant-based products, contribute the most to dimension 2 (23.6%).
In figure 2, there are 3 groups, where the labels are from I1 to I28, which correspond to 1990 to 2017, respectively. In blue, the years 2014-2017 have similarities in the number of plant-based and animal protein products but higher deaths by DM. During these years, there were patterns of obesity and overweight because of the rapid economic and demographic changes that Ecuador, as a developing country, was facing13. These years are marked by an easy replacement of predominantly plant-based low-calorie diets with predominantly animal-based high-calorie diets high in fat, sugar, and refined grains32.
While in red (1900 – 2005), the supply of plant-based protein started to decrease as animal products and meat started to increase, and it was reported that between 1990 and 2000, DM's deaths rose from 8% to 18% for men; and for women rose from 11% to 22%32.

Table 2. Column Contributions for HJ-Biplot analysis of food supply and deaths by DM
Similarly, for the CVDs, the HJ-Biplot showed a total absorption of information by the axes of 94.7% (see Figure 3 and Figure 4). The animal products and meat supply contribute the most to dimension 1 (see Table 3). There are three clusters (figure 4), where the green cluster confirms a study done in 2018 about ischemic heart diseases (IHDs)13, which states that mortality from ischemic heart diseases increased in Ecuador from 2001 to 2016 (Figure 3). Researchers have found that a diet with high contents of red meat, mainly processed red meat, is primarily to heart disease and stroke33–35. Moreover, a diet with high contents of plant-based protein could have benefits like lower risk of cardiovascular disease because these are mostly unsaturated, which lowers LDL cholesterol—an established risk factor for heart disease16,36,37.

Table 3. Column Contributions for HJ-Biplot analysis of food supply and deaths by CVDs

Figure 3. HJ-Biplot with SparseBiplot Package of Food supply and deaths by CVDs,1990-2017

Figure 4. HJ-Biplot and Clusters formation with MultBiplot Package of Food supply and deaths by CVDs, 1990-2017
Moreover, countries and international agencies for the UN High-Level Meeting on NCDs have recommended aligning national policies on agriculture, trade, industry, and transport to promote improved diets and increase physical activity to reduce obesity, unhealthy diet, and physical inactivity as an intervention to tackle the NCDs crisis8. Also, mass-media campaigns, food taxes, subsidies, labeling, and marketing restrictions could raise awareness to maintain a good lifestyle38.
CONCLUSIONS
According to the HJ-Biplots analysis, the average amount of proteins from animal products and meat supply in the diet of Ecuadorians is highly and positively correlated with mortality by CVDs and Diabetes Mellitus.
From the Cluster Analysis, the years when the diet of Ecuadorians included more proteins from animal products and meat align with the years when the deaths by CVD and DM were high in numbers.
Since 2015, when the 2030 Agenda for Sustainable development2 started, the awareness of the death risk by NCDs rose. Nevertheless, Diabetes Mellitus has not decreased as CVDs have because DM cases and deaths keep rising at dangerous levels globally (including in Ecuador); it is crucial to raise awareness in public health about this disease using the recommended guidelines by the UN8.
Acknowledgments
[funding sources should not be included here or in the manuscript file, only during manuscript submission]
REFERENCES
1 World Health Organization (WHO). Global action plan for the prevention and control of non-communicable diseases 2013-2020. 2013.
2 Rosa W (ed.). Transforming Our World: The 2030 Agenda for Sustainable Development. In: A New Era in Global Health. Springer Publishing Company: New York, NY, 2017 doi:10.1891/9780826190123.ap02.
3 Mendis S. Global progress in prevention of cardiovascular disease. Cardiovasc Diagn Ther 2017; 67: S32--S38.
4 Fan W. Epidemiology in diabetes mellitus and cardiovascular disease. Cardiovasc Endocrinol 2017; 6: 8.
5 Lanas F, Serón P, Lanas A. Cardiovascular Disease in Latin America: The Growing Epidemic. Prog Cardiovasc Dis 2014; 57: 262–267.
6 Bennett JE, Stevens GA, Mathers CD, Bonita R, Rehm J, Kruk ME et al. NCD Countdown 2030: worldwide trends in non-communicable disease mortality and progress towards Sustainable Development Goal target 3.4. Lancet 2018; 392: 1072–1088.
7 Feskens EJM, Sluik D, van Woudenbergh GJ. Meat consumption, diabetes, and its complications. Curr Diab Rep 2013; 13: 298–306.
8 Beaglehole R, Bonita R, Horton R, Adams C, Alleyne G, Asaria P et al. Priority actions for the non-communicable disease crisis. Lancet 2011; 377: 1438–1447.
9 Frieden TR, Cobb LK, Leidig RC, Mehta S, Kass D. Reducing Premature Mortality from Cardiovascular and Other Non-Communicable Diseases by One Third: Achieving Sustainable Development Goal Indicator 3.4.1. Glob Heart 2020; 15: 1–10.
10 Núñez-González S, Aulestia-Ortiz S, Borja-Villacrés E, Simancas-Racine D. Mortalidad por enfermedades isquémicas del corazón en Ecuador, 2001-2016: estudio de tendencias. Rev Med Chil 2018; 146: 850–856.
11 Hemler EC. Plant-Based Diets for Cardiovascular Disease Prevention: All Plant Foods Are Not Created Equal. Curr Atheroscler Rep 2019; : 8.
12 Registro Estadístico de Nacidos vivos y Defunciones 2016. 2016https://www.ecuadorencifras.gob.ec/estadisticas-de-nacimientos-y-defunciones-2016/.
13 Núñez-González S, Delgado-Ron A, Simancas-Racines D. Tendencias y análisis espacio-temporal de la mortalidad por diabetes mellitus en Ecuador, 2001-2016. Rev Cuba Salud Pública 2020; 46: e1314.
14 Campbell WW. Animal-based and plant-based protein-rich foods and cardiovascular health: a complex conundrum. Am J Clin Nutr 2019; 110: 8–9.
15 Richter CK, Skulas-Ray AC, Champagne CM, Kris-Etherton PM. Plant Protein and Animal Proteins: Do They Differentially Affect Cardiovascular Disease Risk? Adv Nutr 2015; 6: 712–728.
16 Harland J, Garton L. An update of the evidence relating to plant-based diets and cardiovascular disease, type 2 diabetes and overweight. Nutr. Bull. 2016; 41: 323–338.
17 WCRF/AICR (World Cancer Research Fund/American Institute for Cancer Research). Food, Nutrition, and Physical Activity, and the Prevention of Cancer: A Global Perspective. Am Inst Cancer Res 2007.
18 Schmidt CV, Mouritsen OG. The Solution to Sustainable Eating Is Not a One-Way Street. Front Psychol 2020; 11: 1–4.
19 FAO. Daily protein supply from animal and plant-based foods. http://www.fao.org/faostat/en/#data/FBS (accessed 27 Mar2021).
20 Ritchie H, Roser M. Causes of Death. Our World in Data. 2018.
21 Allaire J. RStudio: integrated development environment for R. Boston, MA 2012; 770: 394.
22 Vicente-Villardón JL. MultBiplotR: Multivariate Analysis Using Biplots in R. R Packag. version 1.6.9. 2021.
23 Cubilla-Montilla MI, Torres-Cubilla CA, Galindo-Villardon P, Nieto-Librero AB. "HJ-Biplot" using Different Ways of Penalization Plotting with "ggplot2." 2021.
24 Galindo Villardón MP. Una alternativa de representacion simultanea: HJ-Biplot. Qüestiió Quad d’estadística i Investig Oper 1986; : 13–23.
25 Cárdenas O, Galindo P, Vicente-Villardón JL. Los métodos Biplot: evolución y aplicaciones. Rev Venez Análisis Coyunt 2007; 13: 279–303.
26 Gabriel KR. The biplot graphic display of matrices with application to principal component analysis. Biometrika 1971; 58: 453–467.
27 Carrasco G, Molina JL, Patino-Alonso MC, Castillo MDC, Vicente-Galindo MP, Galindo-Villardón MP. Water quality evaluation through a multivariate statistical HJ-Biplot approach. J Hydrol 2019; 577. doi:10.1016/j.jhydrol.2019.123993.
28 Tenesaca-Chillogallo F, Amaro IR. COVID-19 data analysis using HJ-Biplot method: A study case. Bionatura 2021. doi:http://dx.doi.org/10.21931/RB/2021.06.02.18.
29 Rencher A, Christensen W. Methods of Multivariate Analysis. In: Wiley Series in Probability and Statistics. Wiley: New Jersey, USA, 2012.
30 Omran MG, Engelbrecht AP, Salman A. An overview of clustering methods. Intell Data Anal 2007; 11: 583–605.
31 Granato D, Santos JS, Escher GB, Ferreira BL, Maggio RM. Use of principal component analysis (PCA) and hierarchical cluster analysis (HCA) for multivariate association between bioactive compounds and functional properties in foods: A critical perspective. Trends Food Sci Technol 2018; 72: 83–90.
32 Bernstein A. Emerging patterns in overweight and obesity in Ecuador. Rev Panam salud pública 2008; 24: 71–74.
33 Bernstein AM, Sun Q, Hu FB, Stampfer MJ, Manson JE, Willett WC. Major dietary protein sources and the risk of coronary heart disease in women. Circulation 2010; 122: 876.
34 Pan A, Sun Q, Bernstein AM, Schulze MB, Manson JE, Stampfer MJ et al. Red meat consumption and mortality: results from 2 prospective cohort studies. Arch Intern Med 2012; 172: 555–563.
35 Bernstein AM, Pan A, Rexrode KM, Stampfer M, Hu FB, Mozaffarian D et al. Dietary protein sources and the risk of stroke in men and women. Stroke 2012; 43: 637–644.
36 Patel H, Chandra S, Alexander S, Soble J, Williams KA. Plant-Based Nutrition: An Essential Component of Cardiovascular Disease Prevention and Management. Curr Cardiol Rep 2017; 19: 104.
37 Garton L, Harland J. The plant-based plan: 10 scientific reasons for more plant-based eating. Alpro Found 2016.
38 Cecchini M, Sassi F, Lauer JA, Lee YY, Guajardo-Barron V, Chisholm D. Tackling of unhealthy diets, physical inactivity, and obesity: Health effects and cost-effectiveness. Lancet 2010; 376: 1775–1784.
Received: 9 December 2021 / Accepted: 16 March 2022 / Published:15 May 2022
Citation: Ivanova Matamoros E ,. Amaro IR , Fabricio Salinas J. Statistical Analysis of Mortality by Non-Communicable Diseases (NCDs) and food supply in Ecuador, 1990-2017. Revis Bionatura 2022;7(2) 43. http://dx.doi.org/10.21931/RB/2022.07.02.43