2019.04.03.4
Files > Volume 4 > Vol 4 No 3 2019
INVESTIGATION / RESEARCH
Diet Composition and Feeding Strategy of Nemipterus japonicus Bloch, 1791 from Tha-baw-seik, Myanmar
Thet Htwe Aung1
Available from: http://dx.doi.org/10.21931/RB/2019.04.03.4
ABSTRACT
Food composition of Nemipterus japonicus was studied by analyzing about 600 specimens from Tha-baw-seik (Lat. 14° 05' and long. 98° 05' E), Myanmar during October 2016 to September 2017. Based on the stomach content analysis, the relative importance index (IRI value) was calculated, and the predator feeding strategies were conducted during the study period. This study showed that N. japonicus is a generally demersal carnivore, and its trophic spectrum was composed of 23 food items. Among them, algae had not been described as a food item for N. Japonicus in the other previous studies. Crustaceans were the most dominant diet in the guts in term of the IRI value. Also, fish items were commonly the most dominant food followed by prawn, crab, and Acetes spp in all length groups but sex variation had no significant food changes with their IRI value.
Keywords: Relative importance index, feeding strategies, Tha-baw-seik and Nemipterus japonicus.
INTRODUCTION
Nemipterid fishes are a demersal fish resource, found on mud or sand bottoms, usually in schools, feeds mainly on small fishes, crustaceans, mollusks (mainly cephalopods), polychaetes and echinoderms. Nemipterid fishes have a small mouth opening, villiform teeth only on the jaws, soft gill racker with bristles, small stomach and long intestine adapted for small preys. The adaptation is also significant in preventing the escape of the prey1.
The nemipterid fishes are one of the most important economic groups of marine fishes in Myanmar. From the commercial point of view, all species are treated as one group under the name ‘Threadfin’, locally known as ‘ShweNgar or Ngar Ni.’ It yields 3040.45 tonnes, and by percentage, it had 5.89% of the Myanmar marine fish landings in Yangon, the business city of Myanmar2.
The study of the feeding habits of fish and other animals based upon the analysis of stomach content has become a standard practice11. Stomach content analysis provides important insight into fish feeding patterns, and quantitative assessment of food habits is an important aspect of fisheries management. Moreover, food and feeding habit of fish are important biological factors for selecting a group of fish for culture in ponds to avoid competition for food among themselves and live in association and to utilize all the available food12.
It is virtually impossible to gather sufficient information about food and feeding habit of fish in their natural habitat without studying its gut contents. All knowledge on the food and feeding habit of fishes provide keys for the selection of species in culture and the importance of such information is necessary for successful fish farming. The food habit of different fish varies from month to month. This variation is due to changes in the composition of food organisms occurring at different seasons of the year.
The threadfin breams constitute an important group of commercial fishes in Tha-baw-seik, Myanmar. Tha-baw-seik is one of the large fishing landing areas in the southern part of Myanmar and it is located in Lat. 14° 05' and long. 98° 05' E. Some observations on the feeding habits of Nemipterids were made from different parts of the world; nevertheless the available information is rather meager and scantly.
In Myanmar, there was only one literature available about food and feeding habits of N. japonicus. Sabai Soe 20148 observed on gut contents of threadfin breams (genus- nemipterus) in myeik waters, Myanmar. In this study, seven species of Nemipterus were observed during the study period.
The objectives of the present study were to provide information on the diet composition and feeding strategy of N. japonicus in Tha-baw-seik landings mainly based on their general stomach content analysis.
MATERIALS AND METHODS
Sample collecting and laboratory procedures
Around 600 specimens of N. japonicus were collected during October 2016 to September 2017 from the fish landings at Tha-baw-seik (Lat. 14° 05' and long. 98° 05' E) (figure 1). The standard length of the samples was recorded and ranged 100-140 mm in length and 141-190 mm in length and 191-220 mm in length. The stomach of the fishes was dissected with the help of simple scissors. The stomach contents were taken into a Petri dish, and the food items were identified under the binocular microscope, and they were counted and weighted in an electronic balance.
The relative importance index (IRI)
Several methods employed for analyzing the food habits of fishes reviewed by Bowen3 to quantify the feeding preference of fishes were applied in the present study.
For the nemipterid fishes, the relative importance index was found most suitable and hence is adopted in the present study.
The methods used in the present study are:

From these three indices, the relative importance of prey items was calculated using the Index of Relative Importance (IRI)4. The IRI was calculated for each prey as:
Index of relative importance, IRI = (% Ni +% Wi) %Oi; Where, Ni, Wi, and Oi represent percentages of number, weight or volume and frequency of occurrence prey respectively.
Cluster analysis
Cluster analysis was done to find out the similarities between groups. The most commonly used clustering technique is the hierarchical agglomerative method. The results of this are represented by a tree diagram or dendrogram with the X-axis representing all predators and Y-axis defining the similarity level at which the predators are fused. Bray-Curtis coefficient14 was used to produce the dendrogram. The following formula calculated the coefficient:

Where Yij represents the entry with ith row and jth column of the data matrix, i.e. the %IRI for the ith prey in the jth predator. Yik is the %IRI for the ith prey in the kth predator; 'min' stands for, the minimum of two values and ∑ represents the overall rows in the matrix.
Besides, the significance of the difference between the IRI value of male and female was tested by One Way ANOVA13.
Predator feeding strategies
Prey- specific abundance is represented by the following equation:
Where Pi is prey- a specific abundance of prey type I, Si total stomach contents (number) comprised of prey I, and Sti is the total stomach content of only the fish with prey item i in their stomach5. According to Amundsen et al5, the interpretation of the feeding strategy diagram can be obtained by examining the distribution of points along the diagonals and axes of the graph. The diagonal from the lower left to the upper right corner provides a measure of prey importance, with dominant prey at the top, and rare or unimportant prey at the lower end. The vertical axis represents the feeding strategy of the predator in terms of specialization or generalization. Predators have specialized on prey positioned in the upper part of the graph, whereas preys positioned in the lower part have been eaten only occasionally (generalization). Prey points located at the upper left of the diagram would be indicative of specialization by individual predators, and those in the upper right would represent specialization of the predator population. Prey with high specific abundance and low occurrence (upper left) were consumed by a few individuals displaying specialization, whereas prey with a low abundance and a high occurrence (lower right) were eaten occasionally by most individuals.
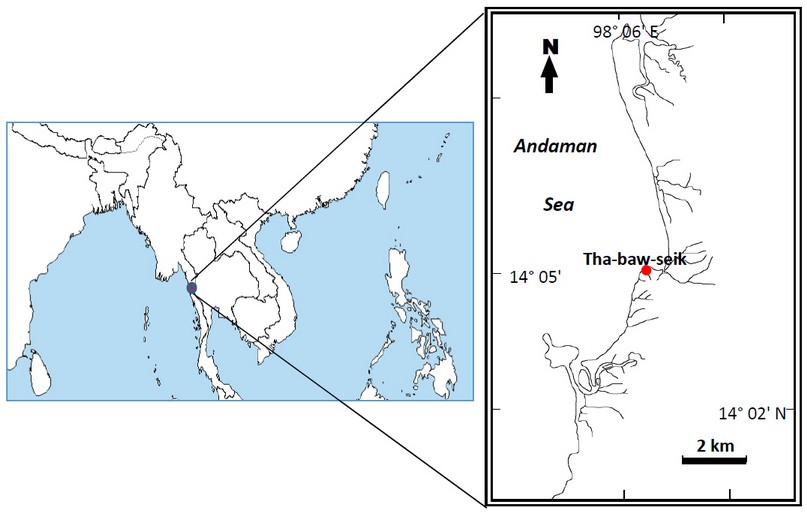
Figure 1: The map of Tha-baw-seik, myanmar.
RESULTS
Prey of N. japonicus in terms of frequency of occurrence (%FO), gravimetric (% W), numerical (%N), and index of relative importance (IRI).
The total 23 food items which are classified into eight general categories were included in the trophic spectrum of N. Japonicus. Among them, crustacean with % IRI 70.98 dominated over all other food categories and was comprised of Acetes spp with % IRI 25.06, crab with % IRI 13.69, prawn with % IRI 29.46, lobster with % IRI 0.038 and squilla with % IRI 2.74. The subsequently abundant food category was fish constituted chiefly by immature ones of Nemipterus spp with % IRI 0.148, Bregmaceros spp with % IRI 7.77, Secutor spp with % IRI 0.14, Sauridas spp with % IRI 0.115, Platycephalus spp with % IRI 0.332, Cynoglossus spp with % IRI 0.08, Stolephorus spp with % IRI 2.04, fish larvae with % IRI 0.38 and unidentified fishes with % IRI 3.53. The additional food items were cephalopod comprised of Loligo with % IRI 1.722 and Sepia with % IRI 0.855 and unidentified squids with % IRI 0.013, polychaetes with % IRI 0.54, nematodes with % IRI 0.892, the brittle star with % IRI 0.521, algae with % IRI 0.348 and miscellaneous items with % IRI 9.409.
In terms of frequency of occurrence, the prawn was observed 15.8% of the total stomach followed by Acetes spp with 14% and crab with 13%. Moreover, they were the most frequently. As for the weight, prawn with 17.17% and Acetes spp with 15.28% were mostly consumed by Nemipterus japonicus followed by Bregmaceros spp with 8.43% which is one item of the fish category. When considering the abundance, Acetes spp with 33.11% produced the largest part of the diet, followed by crab with 13.22% and prawn with 11.35% (table. 1 and fig.2).
In different length groups of N. Japonicus, the contribution of crabs ranged from 19.08% in the smallest group and 18.73% in the medium group to 9.81% in the largest group. Therefore, there was a sharp decrease in IRI value in the largest group. Prawn was one of the major diets for every length sizes of fishes which ranged from 16.14% in the smallest groups and 15.85% in the median length groups to 19.81% in the largest groups (table 2).
Of the three different length groups, Acetes spp was consumed by the smallest length group of fishes the most with 14.04% of IRI value and subsequently, IRI value of this item was 15.19% in the medium length group and 10.407% in the largest length group. Fish was the most dominant food, with 30.33% in the largest length groups of N. Japonicus followed by 18.29% in the median length groups and 17.39% in the small length groups. The lobster was absent in the smallest length group and largest length group, but they were found only in the median length group with the lowest IRI value, 3.703%. Presence of squilla was the highest 11.11% in the largest length groups and lowest 4.37% in the smallest length groups. Contribution of squids ranged 10.14% in the smallest length groups, 3.65% in the median length groups and 3.703% in the largest length groups. Polychaetes ranged from 2.89% in the smallest length group to 5.097% in the median length groups, but they were absent in the largest length groups. Nematodes were only present in the smallest length groups with 4.34%. The fragments of brittle star constituted 1.449% in the smallest length groups, 3.65% in the median length groups and 3.703% in the largest length groups. Algae were only present in the median length groups with 2.43%. Miscellaneous item was found in all the length groups, which ranged from 8.69%.in the smallest groups and 7.407% in the largest groups to 9.75%.in the medium groups (table 2).
Comparison of IRI value in different sexes indicated that prawn was the most favorite food item in both sexes with 18.33% in male and 18.64% in female. Fishes were the second abundant food in both sexes with 16.66% in male and 14.705% in female. The next abundant food item was a miscellaneous item with 17.5% in male and 17.64% in female. The lobster was present in males with 0.833%. The lowest IRI values of males were lobster, and brittle star with 0.833% and the lowest IRI values of males was algae, with 0.989% (table 3).
Similarity analysis between different length groups can be found in the figure. 4. The similarity between the smallest group and the largest group had 67.93 %. These groups shared diets such as Acetes spp., benthic crabs, and prawns. Moreover, the similarity between medium and largest groups was observed at 72.31%.
The significance of the difference between the IRI values of males and females was tested by analysis of variance. Since the null hypothesis H0: µA=µB and H0 is not rejected (p = ≥ 0.05), there is no significant difference in the relationship between males and females (table 4).
Predator feeding strategies
The feeding strategy of N. japonicus was found by plotting prey- specific abundance against the frequency of occurrence in figure 3. There were 23 different prey types represented by points. Based on the interpretation of Amundsen et al. 19965 were important food of N. japonicus, whereas some species of fishes, lobster and squilla were unimportant. Also, N. japonicus were specialized on fish larvae, polychaetes, unidentified fishes and algae, etc. but some species of fish, crab, prawn, Acetes spp., squilla, and lobster were eaten only occasionally. Although fish larvae, polychaetes, unidentified fishes and algae were consumed by a few individual predators, crab, prawn, Acetes sp., Bremaceros spp, etc. were eaten by most individual predators. Therefore, though the abundance of certain prey items like fish larvae and polychaetes was very high in the ecosystem, their occurrence was meager in the diet. The analysis showed that N. has a specialized feeding strategy focusing on crustaceans, especially Crab, Acetes spp, and Prawn, which they consumed in very large quantities. Bregmaceros spp and Misc. item was the next most often found prey items on which N. japonicus specialized. Therefore, they were consumed occasionally by most individuals. Though the abundance of certain prey items like fish larvae and polychaetes was very high in the ecosystem, their occurrence was meager in the diet.
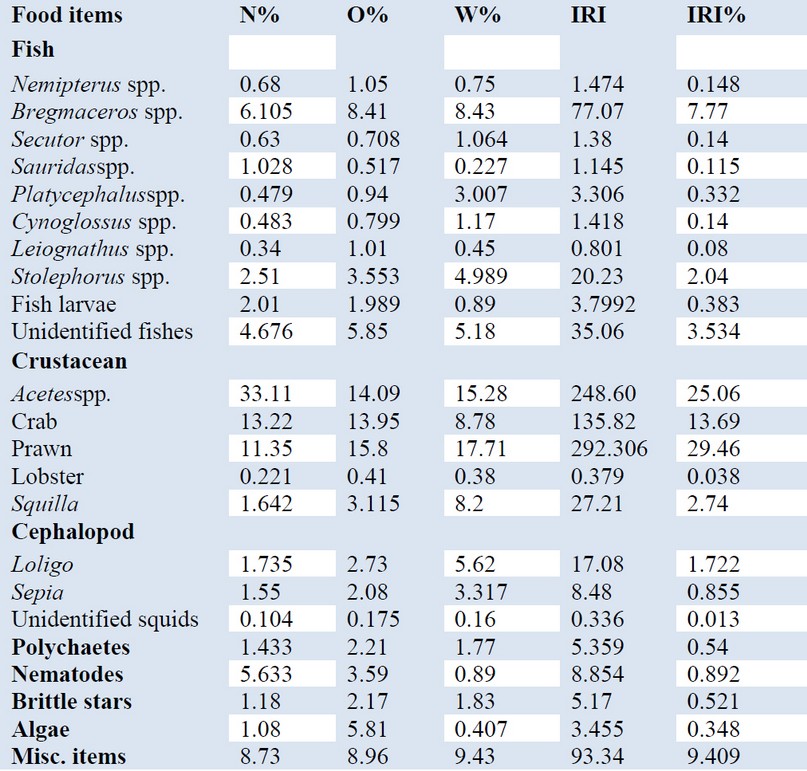
Table 1. Prey of N. japonicus collected from the Tha-baw-seik coastal areas in terms of frequency of occurrence (%FO), gravimetric (% W), numerical (%N), and index of relative importance (IRI).
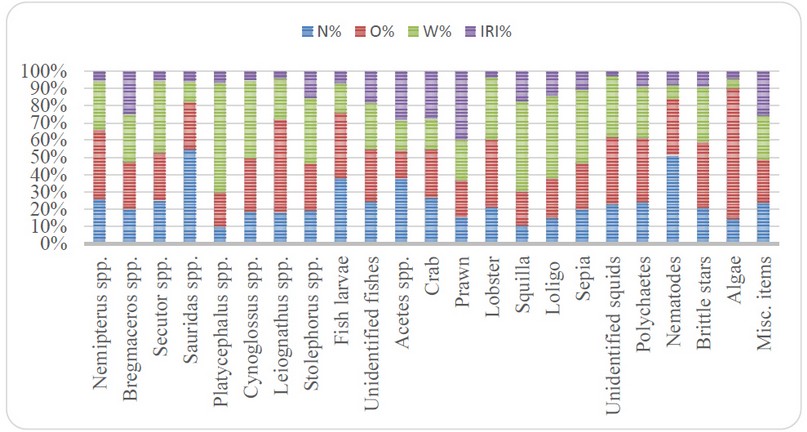
Figure 2. Prey of N. japonicus collected from the Tha-baw-seik coastal areas in terms of relative importance index (IRI).
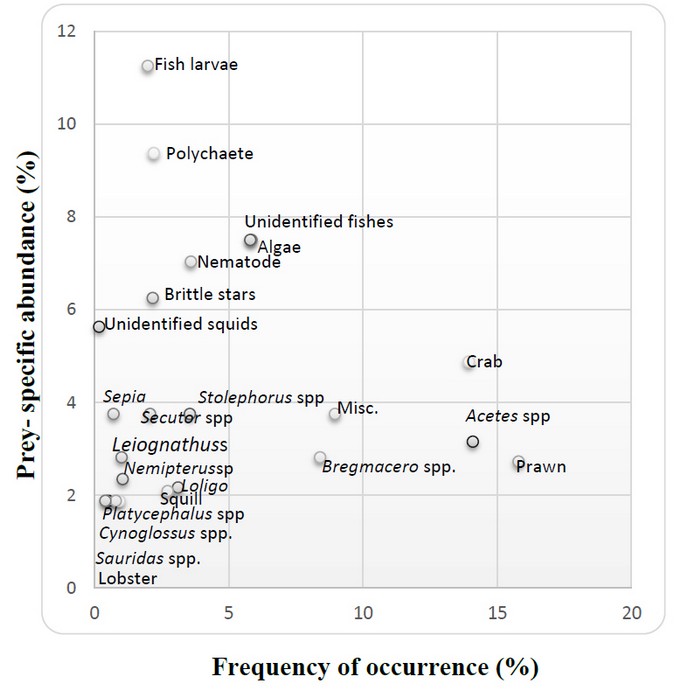
Figure 3. Feeding strategy diagram for N. japonicus. Prey- specific abundance (%) plotted against frequency of occurrence of food items in its diet.
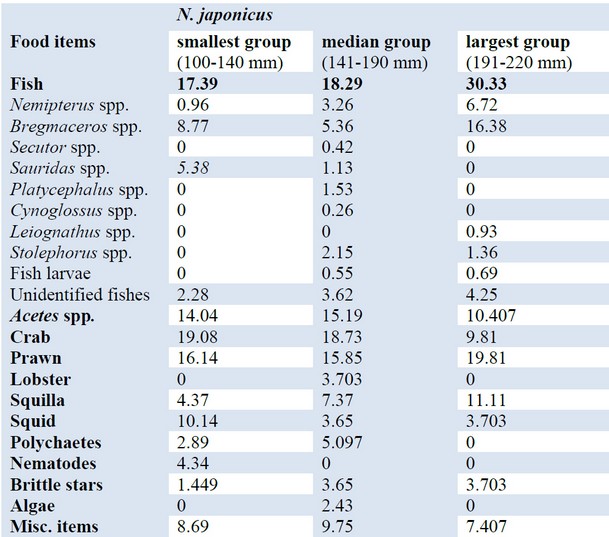
Table 2. Ontogenetic variation in %IRI of different prey of N. japonicus.
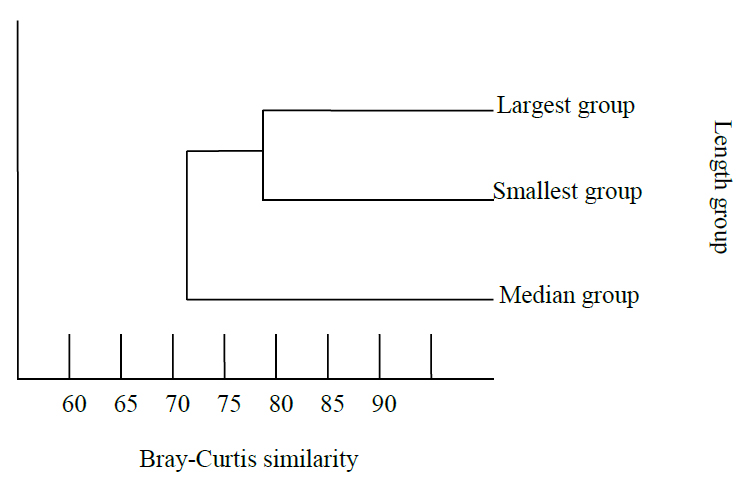
Figure 4. Dendrogram based on %IR: values of different length groups of N. japonicus using Bray-Curtis similarity.
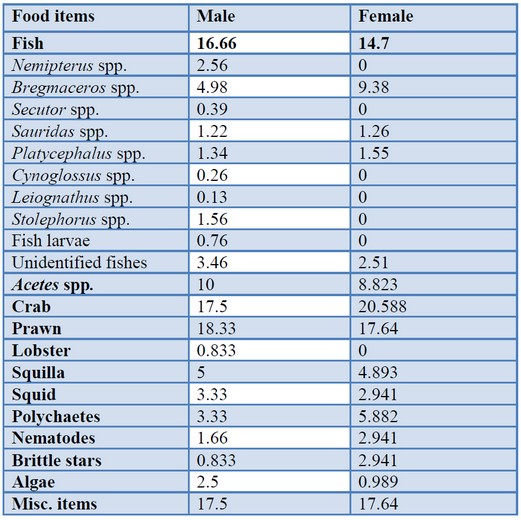
Table. 3. Sex variation in %IRI of different prey of N. japonicus
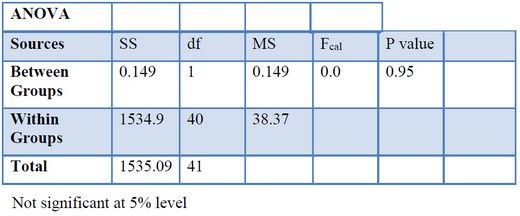
Table 4. Comparison of IRI value between male and female of N. japonicus from Tha-baw-seik, Myanmar.
DISCUSSIONS
The present study revealed that N. japonicus is a benthic carnivore that relies mainly on benthic crustaceans and fishes. Rao and Rao6 described food items as squilla, crabs, prawns, teleosts, cephalopods, amphipods, polychaetes and other miscellaneous items in that order of importance from the gut of N. japonicus. Krishnamurthy7 described N. japonicus is actively predacious and possibly a sight feeder, feeding on crustaceans, mollusks, annelids and echinoderms. Moreover, about the results by SabaiSoe8, the food composition of N. japonicus consist of Solenocera spp., Stolephorus spp., Squilla, Crabs and Miscellaneous. According to the results conducted in the present study, the following food items were observed in the guts of fishes: fish comprised with Nemipterus spp., Bregmaceros spp., Secutor spp., Sauridas spp., Platycephalus spp., Cynoglossus spp., Leiognathus spp., Stolephorus spp., fish larvae and unidentified fishes, crustacean comprised with Acetes spp., crab, prawn, lobster and Squilla, cephalopod comprised with Loligo, Sepia and unidentified squids, polychaetes, nematodes, brittle stars, algae and miscellaneous items. Therefore, the food items of the present study were almost the same as the previous studies of N. japonicus. Russel 19901 observed that cephalopods mainly squid and cuttlefish formed dominant food followed by finishes and other benthic crustaceans. In contrast, the present study was observed that benthic crustaceans were the most dominant food.
Of the crustacean items, Acetes pp, prawn and crab were the favorite food of N. japonicus with the highest IRI value, but Squilla and lobster were also found occasionally with the lowest IRI value. Fish ranked in the second dominant food category of N. japonicus. Among them, Bregmaceros spp was observed with the important quantities, and other species had the negligible quantities. The studies of Manojkumar9 and Abdu Rahiman10 made the fish prey items identify up to the species level but the present study could not be done because of their digestion.
Loligo and Sepia were considerably found but Loligo was more abundant than Sepia. The miscellaneous items comprised of debris, rubbish, unidentified bones, unidentified shells, unidentified hairs, and silts were found very often. However, polychaetes, nematodes, brittle stars, and algae were negligible food or minor food in some months.
As for predator feeding strategies, Abdu Rahiman10 showed that N. japonicus most often specialized on crustacean mainly S. choprai, benthic crabs, unidentified fishes, A. indicus and L. durance in his study whereas the present study found that crab, Acetes spp, prawn, Bregmaceros spp and Misc. items represented the specialization of the predator population.
In all length groups, fishes were commonly the most dominant food followed by prawn, crab and Acetes spp. According to the IRI values, N. Japonicus were generally increased with the increasing length of them in fishes, prawn, and squilla while the values were decreased with the decreasing length in Acetes spp, crab, squid and miscellaneous item. A large percentage of fishes, prawn, and squilla in the largest length groups indicate they alter in feeding towards fish, prawn and squilla items as length increases. On the pieces of evidence from the report of Rao and Rao 1991, squilla dominated for all length groups followed by crabs and prawns. A large proportion of prawns mainly S. choprai and A. indicus, L. duvauceli and fish, which are active mobile benthic organisms recorded in large length groups indicated predatory behavior of N. japonicus on benthic animals. Compared with the present study, it is proved that almost all food items observed in the guts were only the benthic organisms. Moreover, it was also found that the sex variation in IRI value of N. Japonicus had no significance with their different food items.
CONCLUSIONS
Acetes spp., Crab, Prawn and Squilla were the favorite food of N. japonicus. Regarding preyed fishes, it seems to eat Bregmaceros spp as its major food. It cannot be denied that N. japonicus is the kind of benthic fish because almost all food items were only the benthic organisms. Moreover, it can be concluded that their food items can be their associated animals. Therefore, the species found in their guts may be distributed along the Tha-baw-seik and its adjacent coastal waters.
ACKNOWLEDGMENTS
Firstly, I am deeply thankful to my dearest parents, U Kyin Aung and Daw Myint Myint San, for their kind moral and financial support to reach the goal of this work.
REFERENCES
1. Russell, B.C. Nemipterid fishes of the world. (Threadfn breams, whiptail breams, monocle breams, dwarf monocle breams, and coral breams) Family Nemipteridae. An annotated and illustrated catalogue of nemipterid species known to date. FAO Fish.Synops, 1990. 12(125): 1-149.
2. FAO Fisheries and Aquaculture Department. Fishery and Aquaculture Country profiles. The Republic of the Union of Myanmar. Food and Agriculture Organization of the United Nations. 2012. 20p.
3. Bowen, S. Quantitative description of the diet, In: B. R. Murphy and D. W, Willis, (Eds). Fisheries Techniques, American Fisheries Society, Bethesda, MD, 1996.513-532.
4. Pinkas, L.M., S. Oliphant and I.L.K. Iverson. Food habits of albacore, bluefin tuna and bonito in Californian waters. Calif. Fish Game, 52: 1971. 1-105.
5. Amundsen, P. A., H. M. Gabler& F. J. Staldvik. A new approach to graphical analysis of feeding strategy from stomach contents data - modification of the Costello (1990) method. Journal of Fish Biology, 1996. 48: 607-614
6. Rao, D.M and K.S. Rao. Food and feeding behaviour of Nemipterusjaponicus (Bloch) populations off Visakapatanam, South India. J. Mar. Biol. Ass. India., 1991. 33 (1&2): 335-345.
7. Krishnamurthy, B. Biology of the threndfin bream, Nemipterusjaponicus (Bloch). Indian J. Fish., 1971. 18(1&2): 1-21.
8. SabaiSoe. Obeservation on gut contents of threadfin breams (genus- nemipterus) in myeik waters. Unpublished Master of Science Thesis. Department of Marine Science. Myeik University. 2014.
9. Manojkumar, P.P., Pavithran, P.P and Ramachandran, N.P. Food and feeding habits of Nemipterusjaponicus (bloch) from Malabar coast, Kerala. Indian J. Fish. 2015. 62 (1): 64-69.
10. Abdu Rahiman, KP. Studies on food and feeding of marine demersal finfishes with special preference of trophic interactions. Unpublished Ph.D Dissertation. Under the faculty of Marine Science. Central marine fisheries research institute, Cochin. 2006.
11. Hyslop, E.J. Stomach contents analysis: a review of methods and their application. J. Fish. Biol., 17:411-429. 1980.
12. Dewan, S. and Shaha, S. N. Food and feeding habits of Tilapia nilotica (L.) (Perciformes: Cichlidae). II. Diel and seasonal patterns of feeding. Bangladesh J. Zool. 7(2): 75-80. 1979.
13. Snedecor, G.W. and Cochran, W.G. Statistical Methods. Oxford and IBH Publishing Company, New Delhi India. 593pp. 1967.
14. Bray, J.R. and J.T. Curtis. An ordination of the upland forest communities of Southern Wisconsin. Ecological Monographs, 27, 325-349. 1957.
Received: 11 May 2019
Aproved: 1 July 2019
Thet Htwe Aung1
Demonstrator, Marine Science, Mawlamyine university, Myanmar,
Corresponding author: [email protected]
