2021.06.02.13
Files > Volume 6 > Vol 6 No 4 2021 > Vol 6 No 2 2021
INVESTIGATION / RESEARCH
Identification of maize kernel resistance proteins against Aspergillus flavus by a statistical approach: A predictive model of resistance capacity.

Leandro Balzano, 1; Jesús Alezones, 2; Nardy Diez García 3.
Available from: http://dx.doi.org/10.21931/RB/2021.06.02.13
ABSTRACT
Although kernel infection by Aspergillus flavus and pre-harvest aflatoxin contamination of Zea mays grain is a significant crop production problem, not only in Venezuela but also around the world, little progress has been made in identifying proteins and metabolic pathways associated with this pathogen resistance. Usually, a protein with a two-fold expression between control and condition is considered a biomarker of some phenomena, but we think it is essential to evaluate its contribution to resistance. That is why we decided to determine the behavior's resistance capacity in terms of expression levels of an identified protein of maize kernels infected with A. flavus by using a multivariate approach. In this work, we identify 47 of 66 differentially expressed spots with a remarkable contribution to resistance against the fungus Aspergillus flavus. We finally test this approach to know if it can be used as a predictive resistance model and probe it by including theoretical and experimental protein expression profiles of other inoculated maize lines.
Keywords. Host resistance, resistance-associated proteins, Zea mays, Aspergillus flavus, comparative proteomics, resistance predictive model.
INTRODUCTION
The latest statistics released by the Food and Agriculture Organization of the United Nations (FAO), indicate that by the year 2011, maize was the second most produced and demanded vegetable item in the world, after sugar cane1. Fungi are the world's primary cause of maize crop loss because of their economic implications, which represents a substantial phytosanitary problem to be solved. In Venezuela, the major maize crop pathogen is Aspergillus flavus, with 35-45% of incidence. It is the cause of around 80% percent of kernel losses because it reduces not only the grain nutritional value, but also its presence usually causes the accumulation of highly toxic and carcinogenic secondary metabolites named aflatoxins2–6.
In general, plants can respond to invasion by pathogens through the activation of a variety of defense strategies, which are induced by complex interactions between biochemical pathways in a coordinated manner7,8. Defense responses generally include several cellular changes due to variations of protein expressions involved in cellular metabolism, as the production of structural carbohydrates, structural proteins, signal transcription and translation, transporters, intracellular traffic, and production of antimicrobial compounds, among other processes9,10. However, there is not much research focused on the response mechanisms of maize against fungal infection. Despite being a long-term method, recurrent selection can decrease or even eliminate fungicide dependent cultures. Besides, it is a low cost method, so it is widely used in developing countries11,12.
Resistant plant selection is made a long time ago and tries to relate phenotypical characteristics with genotypical ones. Kernel screening (KSA) assay is a resistance-evaluation method that consists of maize grain exposition to a pathogen concentration to determine its capacity to inhibit pathogen proliferation13. In this work, we modified this method to increase the A. flavus spores concentration to 4x10⁶ spores/mL of A. flavus. We evaluated the kernel differential-expression proteins between high-production A. flavus-infection-susceptible and A. flavus-infection-resistant maize lines to determine plant resistance mechanisms. We extracted maize grain proteins using two different pH buffers, quantified them, and verified their integrity. Then we obtained two-dimensional patterns and compared them, detecting multiple protein-expression variations.
All the information obtained allowed the generation of similarity matrices that were used to study the relationships among maize genotypes investigated using different techniques of classification/ordination such as principal components analysis14,15, Neighbor-joining clustering algorithm16,17 and principal coordinates analysis18. The combination of these techniques allows two crucial facts: 1.- determining the proteins differential pattern expression that majorly contributes with resistance capacity by the interpretation of the variables responsible for the classification or ordination, which were identified by MALDI-TOF mass spectrometry, to construct a resistance response model of a maize-grain cell against A. flavus and 2.- developing a methodological strategy of data processing that is capable of predict the resistance level of other maize lines.
MATERIALS AND METHODS
Maize lines and fungal selection.
We pre-selected eleven high-production maize lines developed initially by the International Maize and Wheat Improvement Center (CIMMYT) and adapted to Venezuelan lands, based on two characteristics, 1.- its high productivity and 2.- its resistance capacity against A. flavus determined by modified KSA assay13. After that, we selected four lines based on the grain color, two highly resistant (one white grain and one yellow grain) and two highly susceptible (one white grain and one yellow grain). We inoculated the seeds with 4x10⁶ spores/mL of A. flavus and incubated each grain line for 7 days, at 30ºC and 90-100% humidity resistance-capacity evaluation (figure 1), and 20 h for protein-expression profile evaluations.
A. flavus Ospino 1-B was the fungal strain used due to its high colonization power. It was grown on agar plates at 30 °C until the mycelium had covered all the plates, and the spores were collected by shaking the plate in sterile water. The spores were then counted in a Neubauer chamber to inoculate maize grains with the mentioned spore quantity.
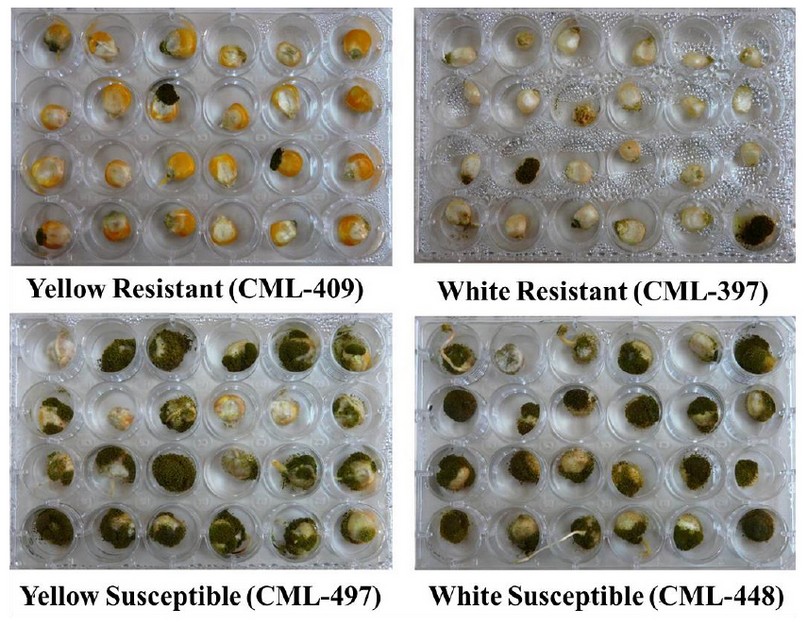
Figure 1. Characteristics of the chosen high-production maize lines in terms of their resistance or susceptibility to A. flavus. Kernel screening assay of the selected maize lines showing its resistance or susceptibility against A. flavus 4x10⁶ spores /mL defined by fungus proliferation ratio in 7 days of infection.
Protein extraction.
For protein extraction, each plant's whole grain was pulverized with liquid nitrogen, and aliquots of 100 mg were homogenized in 1 mL of extraction buffer mixed with 1X protease inhibitor mix (GE healthcare). Two different protein extraction buffers (pH=2.8 or pH=7.5) were used according to the protocol described by Campo et al.19. These aliquots were incubated for 1h with continuous slow stirring and then were centrifuged at 16.000 g for 5 min at 4°C. The supernatants' proteins were incubated at -20°C overnight, with two volumes of methanol, so the final alcohol concentration in the mixture was 70%. Then, all tubes were centrifuged at 16.000g for 5 min at 4°C, the supernatants were discarded and the pellets were washed twice with 70% ethanol at 4°C, after which, the tubes were centrifuged again, the supernatants were discarded, and all the precipitates were saved at -70°C until use. The protein pools were resuspended in 50 µL DeStreak buffer (GE Healthcare), quantified by the Bradford QuickStart® method (Bio-Rad), and SDS-PAGE verified their integrity. We carried out three independent infection experiments, with three protein extractions of the pulverized plant material, in order to explore the protein level variations associated with the biological material and the experimental techniques.
Two-dimensional gel electrophoresis.
Nonlinear pH 3-10 isoelectric focusing dry strip gels (GE Healthcare) were rehydrated overnight in 250 µL rehydration solution (8M urea, 1% CHAPS, 20mM DTT, and 0.2% of 3-10 non/linear carrier ampholytes), along with 30 µg (analytical) or 100 µg (preparative) of proteins. Isoelectric focusing was performed at 20°C in an Ettam IPGphor (GE Healthcare), following the standard protocol recommended by the fabricant: gradual increase until 200V for 20 min, gradual increase until 450V for 15 min, gradual increase until 750V for 15 min, gradual increase until 2000V for 30 min, all gradual increases were performed being careful not to overcome 25 milliamperes. After isoelectric focusing, gel strips were equilibrated for 15 min in a buffer containing 50 mM Tris-HCl (pH 8.8), 6 M urea, 30% glycerol, 2% SDS containing 10 mg/mL DTT, followed for 15 min with the same buffer but containing 5 mg/mL iodoacetamide instead of DTT. For the second dimension, strips were loaded onto SDS polyacrylamide gels (12% acrylamide separating gel, 8x7x0.1 cm, width x height x thickness), then the top of the gel was sealed with 1% agarose solution, and finally, we ran two-dimentional gel electrophoresis at 200V for about 35 min, until the front run was about to go out of the gel. All gels were silver-stained with PlusOne Silver staining kit (GE Healthcare) which is compatible with mass espectrometry. Gel were digitized with an HP scanner and analyzed with the Phoretix 2D v-2004 (nonlinear Dynamics Ltd.) program.
Comparative analysis of protein expression profiles.
The protein expression profiles obtained from all maize lines were compared in two different analyses, white lines, and yellow ones, between each other. We decided to compare just the profiles obtained from A. flavus-inoculated susceptible maize grain lines with those obtained from A. flavus-inoculated resistant maize grain lines. The two-fold differential-expression proteins detected by the Phoretix 2D program (Nonlinear Dynamics Ltd.) were selected for peptide sequencing.
Protein identification and database search.
Proteins were identified by peptide mass fingerprinting using MALDI-TOF mass spectrometry (MS) performed with a PrOTOF 2000 (Perkin-Elmer Inc.) instrument, previously calibrated with trypsin-digested bovine serum albumin. For the analysis, 1µL of tryptic peptides were mixed with 1 µL of the matrix (α-cyano-4-hydroxycinnamic acid, 5mg/mL) and loaded on a stainless steel MALDI plate. Protein identification was carried out using MASCOT (Matrix Science Ltd.) or Protein Prospector software (v5.10.1, UCSF Mass Spectrometry Facility, University of California). Nonredundant NCBI (National Center for Biotechnology Information), MSDB, and SwissProt (European Bioinformatics Institute Heidelberg, Germany) databases20,21 were used for the search. The search parameters applied were described by Lee et al.22; they are a mass tolerance of 50 ppm with one incomplete cleavage allowed; alkylation of cysteine by carbamidomethylation was the only fixed modification; the variable modifications considered were acetylation of the N-terminus, oxidation of methionine, and the pyroGlu formation of N-terminal Gln.
Resistance response models.
With all the available information and the additional one gathered in this work, we propose a whole maize cell resistance response model after 20 h of infection by A. flavus. This model was accomplished using bioinformatics interphases indexed in http://www.bioprofiling.de/index.html, which employs the information stored in NCBI and SwissProt databases20,21. These tools can be applied in just one plant, Arabidopsis thaliana, so the only way to use it was, placing this plant's accession number of homolog proteins instead of maize-identified proteins.
Statistical analysis for biomarkers determination and resistance prediction-method generation.
The data of the 2D gels spots areas were used to determine the proteome-differences under the same conditions of infection, useful information to determine the differential-expression proteins more closely associated with maize-grain resistance cells against the fungus. We applied principal coordinates analysis (PCoA) to the binomial-transformed and mathematically size-adjusted by generalized Procrustes data matrices and projected on the principal coordinate plane to determine levels of resistance of the lines under study, given by its plane location. Cluster analysis was performed to evaluate the relationship between the proteins present in all the lines under study. We also applied Principal Components Analysis (PCA) to all original data matrices previously grouped by color and resistance capacity, eliminating extraction buffer variable by generalized Procrustes, to determine the spots that majorly contribute to resistance characteristic. We finally evaluated the statistical resistance-predictive method applied by using experimental and theoretical lines with characteristics of both resistant lines and evaluating them by principal coordinates analysis. All analysis was realized with the software InfoStat23.
RESULTS AND DISCUSSION
Maize lines selection. Guided by the mentioned characteristics, we pre-selected 11 maize lines (Table 1), and then we selected 4 maize lines from this initial selection: 2 resistant and 2 susceptible to A. flavus infection. White grain lines were selected with a close relationship between them, both having the same germplasm source, known as Tuxpeño 1. In contrast, yellow grain lines were deliberately selected with different germplasm sources (CML-409 is derived from "Antigua Veracruz" population, while CML-497 is derived from RCY source). The maize-grain-lines-resistance levels were confirmed by KSA assay (figure 1), modified as mentioned
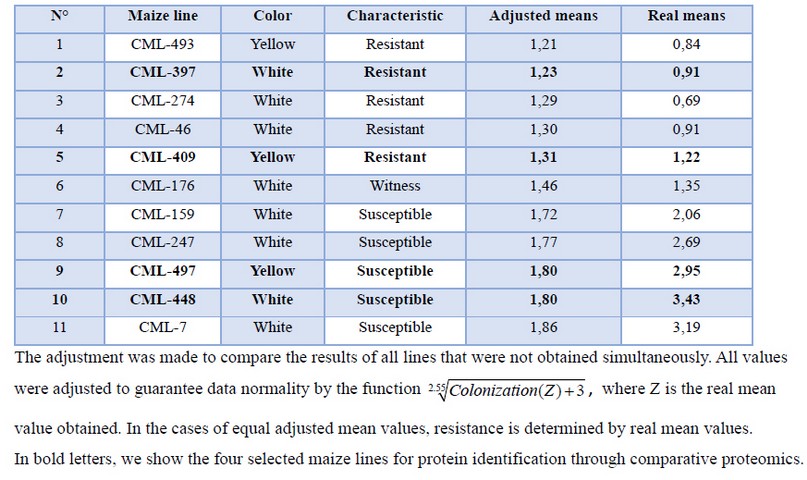
Table 1. Modified KSA assay results of pre-selected maize lines against A. flavus grain infection. These results are ordered by resistance capacity 7 days post-infection. Adjusted values by a mean test (5%) of three replicates.
Although CML-493 was the most resistant maize line, it was not used because it is a quality protein maize (QPM) line, and we neither used CML-7 maize line even though it was the most susceptible line, because its yield in tons per hectare in Venezuela is far lower than the one of CML-448 maize line.
Evaluation of studied maize lines proteomes. We decided to study the relationship between the four evaluated proteomes and determine if there is any proteome expression-pattern difference in the proteins with both types of lines, yellow and white. For this, we used a data matrix using only proteins present in at least one of the white lines and one of the yellow maize lines, resulting in 224 spots. Generalized Procrustes adjusted this data matrix to eliminate the extraction method factor and maintaining only the factors, grain color, and resistance capacity. We made a cluster analysis of the adjusted matrix, using calculating the square Euclidean distance and Ward. We demonstrate that the proteomes obtained from the two resistant lines, under infection conditions for 20 hours, are more similar than those with their same color-susceptible lines. Furthermore, the relationship between resistant lines is stronger than the relationship between susceptible lines. This demonstrates that, under infection, both resistant lines show a similar response mechanism (Figure 2).
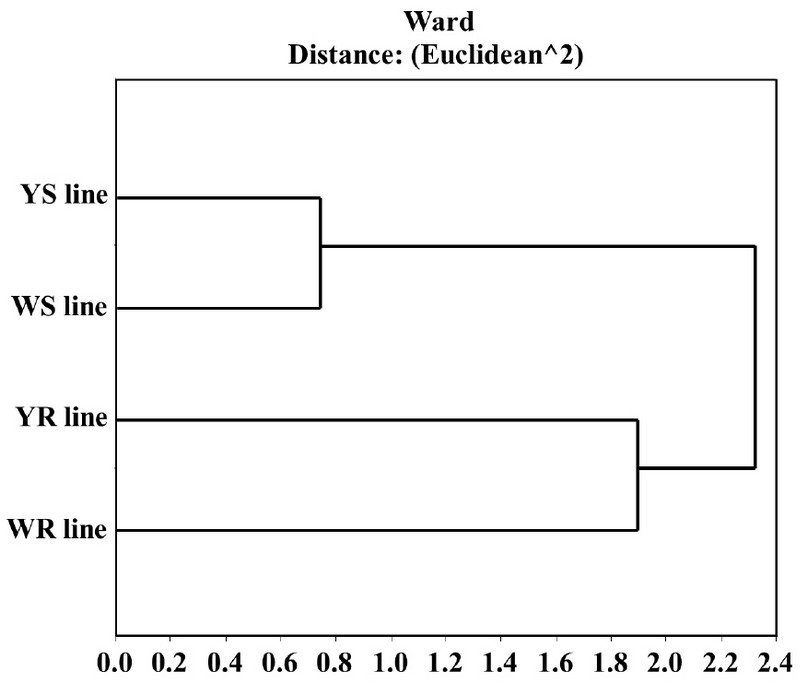
Figure 2. Cluster diagram of the four studied lines inoculated (20h) with A. flavus. This was made using the 224 spots detected in at least one yellow line and one white line. It shows a stronger relationship between the resistant lines' proteome with each other than between maize-grain color. Results obtained with InfoStat v 2012.
Determination of major resistance-contributing proteins. Using these 224 spots matrices, we made a PCA to determine the proteins (variables) that majorly contribute to each maize line's centroids position and, consequently, to resistance capacity. In this way, we determined that 66 proteins majorly contribute to resistance (figure 3). In this figure, we show the 66 proteins spot number, separated by colors where spots in green are the spots that majorly contribute to the YR line position, in blue are the spots that majorly contribute to the WR line position, and in red are the spots that majorly contribute to the position of both resistant lines. We then decided to identify these significant resistance-contributing proteins.
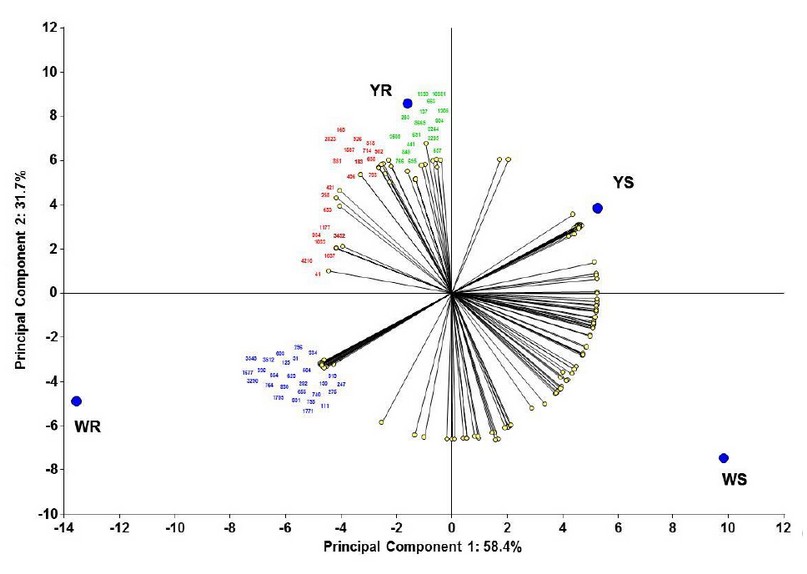
Figure 3. Principal components analysis to determine resistance-contributing proteins. Statistical analysis made using InfoStat v201223.
Protein identification by peptide-mass fingerprinting and sequencing. MALDI-TOF MS. carried out identification of the two-fold up or down-regulated proteins. Selected spots were subjected to in-gel tryptic digestion. MALDI-TOF MS analysis and mass spectra were searched against the protein sequence databases. 47 of the 66 selected spots were identified by peptide mass fingerprinting (PMF) (Table 2). Two to three peptides were sequenced from each spot for protein identification. Nineteen proteins remained unidentified, some of them because the homology score was too low to consider it as that protein, others because they did not show significant homology to any known protein sequence. This is an exciting matter for further investigations. We consider it essential to remark some of the identified proteins, like NADPH HC toxin reductase (NHCTR), whose function is to inactivate HC toxin, a cyclic tetrapeptide Helminthosporium carbonum, by carbonyl group reduction24. Hm1 was the first considered resistance gene cloned and evaluated, proving the toxin's encoded protein activity25. HC toxin is a potent histone deacetylase inhibitor26. Histone deacetylase eliminates histones, acetyl groups, transforming the lysine and arginine amino groups into amides, diminishing their DNA affinity, allowing separation and posterior transcription. Thus, HC toxin inhibits the separation between histones and DNA, inhibiting protein transcription, probably resistance proteins27. At the transcriptional level, we determined an overexpression in the resistant lines after infection, exceptionally the white resistant (WR) line that reaches higher relative-expression values. Besides, there are no significant changes in the white susceptible (WS) line after infection, and we could not detect any expression level in the yellow susceptible (YS) line (data not shown or see supplementary data or figure S1). This protein showed an overexpression on white-grains resistant-maize line with respect to the susceptible one at the translational level and was not detected in yellow lines.
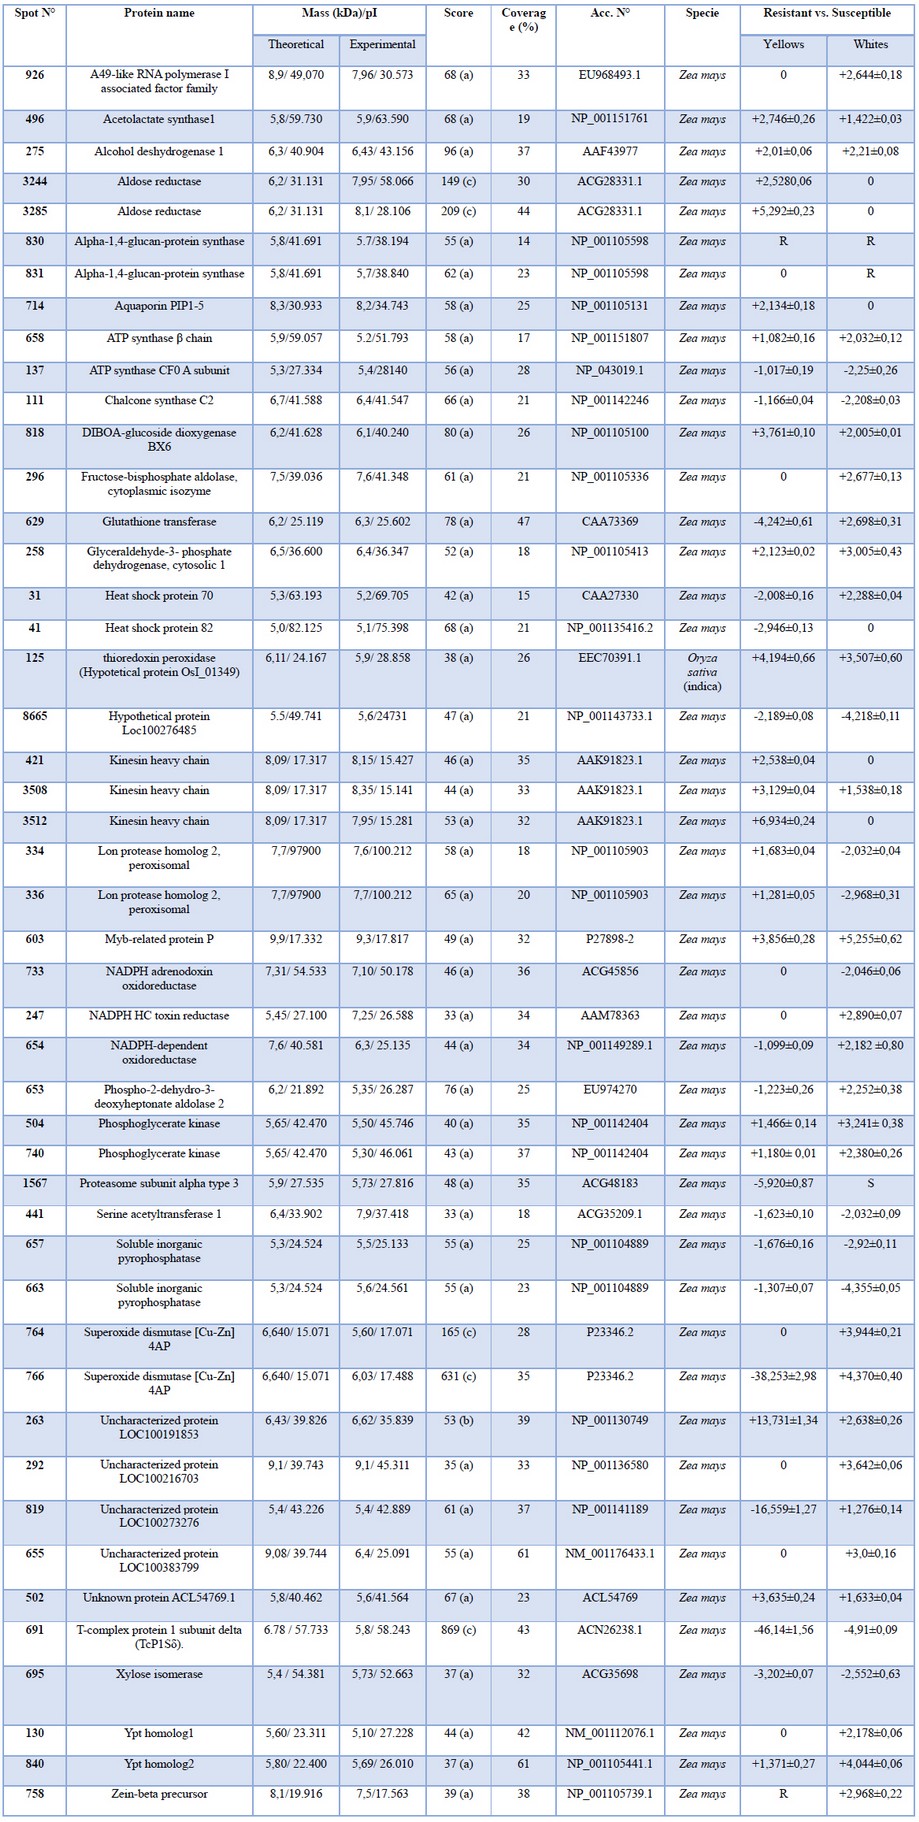
Table 2. Summary of the proteins identified by MS from fungal-infected grains by both buffers.
NADPH HC toxin reductase overexpression in WR line was detected in this work, a fascinating result, because it is known that this enzyme responds almost exclusively to the fungus Helminthosporium carbonum, due to a coevolution phenomenon between the two organisms28. This result indicates that A. flavus somehow stimulates maize grains response mechanisms, similar to those activated by H. carbonum, perhaps because of a similar infection mechanism. In H. carbonum, the toxin synthesis depends on a complex locus of five genes that encodes, among other things, promoter proteins and HC-toxin synthase (Genbank: M98024.2)29. We compared the HC-toxin synthase sequence of H. carbonum with A. flavus (taxid:5059) and found a mRNA sequence coding for a protein with 97% of homology NRRL3357, nonribosomal peptide synthase Pes1 (XM_002380451.1). This suggests the existence of a similar toxin-synthesis mechanism between the two fungi, which provokes an overexpression of NADPH HC toxin reductase. This work is the first report of overexpression of this enzyme caused by A. flavus.
We also detected four proteins involved in the shikimate pathway, phospho-2-dehydro-3-deoxyheptonate aldolase 2 (PDDA2), myb-like transcription factor (myb-P), chalcone synthase (ChS), and α-1,4-glucan-protein synthase (α-GS), which describe their importance in the resistance phenomena. Several proteins involved in the catabolism, phosphoglycerate kinase (PGK), xylose isomerase (XI), soluble inorganic pyrophosphatase (SIPP), glyceraldehyde 3-phosphate dehydrogenase cyt 1 (GAPDHc1), fructose bisphosphate aldolase (FBA), are required for energy production due to the high demand to face the pathogen.
Additionally, we detected chaperone proteins, motor proteins, ATP synthesis proteins and transmembrane transporters, and some hypothetical and unknown functional proteins.
Response model of a maize-kernel cell against A. flavus at 20 hours infection. All the information gathered was used to develop a response model that describes the processes that we consider provide the highest corn-kernels resistance-levels against A. flavus. The ORFs whose role is not confirmed yet, were not included in the response model. Figure 4 shows the model which summarizes what occurs within the cell, including proteins reported in other studies19,30–37. It can be noted that an immediate response mechanism takes place (left side of the model), where an overexpression of several proteins responsible for reactive-oxygen species (ROS) production occurs. These ROS are involved both in the direct attack and in cell damaged wall repair, but they are highly toxic for host cells, because they cause membrane pores, protein damage and conglomeration among other events. Therefore, the activation of proteins related to ROS degradation can be expected as was observed. Chaperone proteins that protect the native proteins folding were also detected, and the subexpression of proteins related to the degradation of other proteins indicates that in resistant-plants maize-grains, the protection of proteins already synthesized is favored instead of protein degradation and resynthesis, which supposes lower energy cost. We found that energy is not wasted unnecessarily. However, energy requirements increase proportionally because of infection, which stimulates an increase of catabolic-proteins expression and an increase of ATP synthesis in chloroplasts and mitochondria, and an energy waste necessary for proteins synthesis involved in defense against ROS species, as well as of proteins involved in synthesis of molecules used for direct attack and in cell wall-repair and reinforcement, both in affected cells and in neighbor ones, which stops the infection advance. Our study differs from others where the point of view is from the fungus and not from the maize's response38,39.
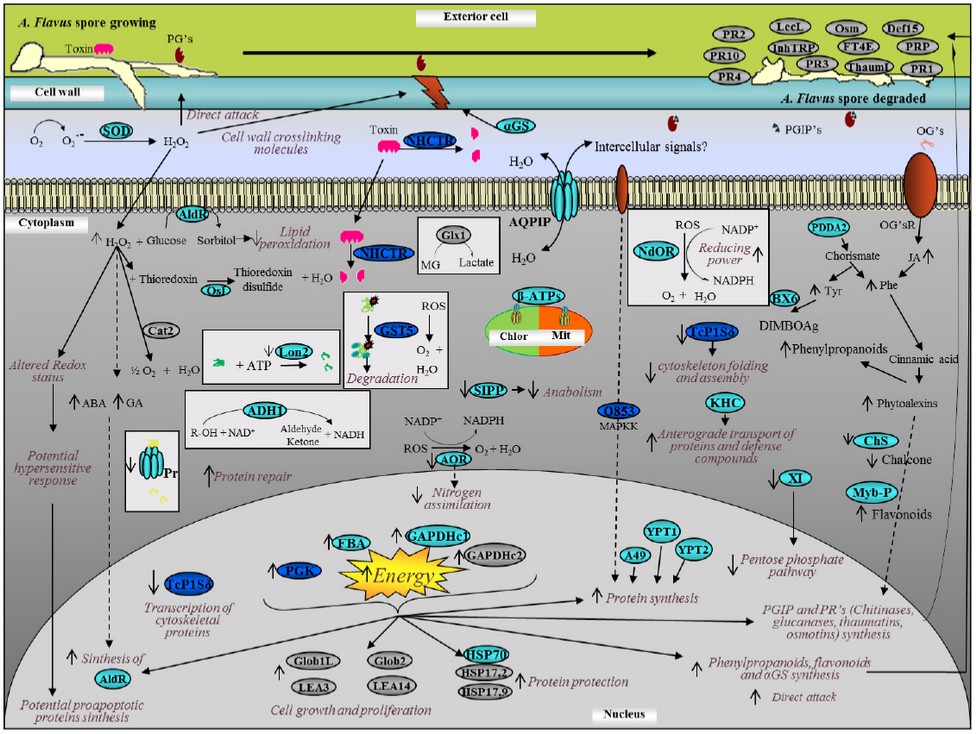
Figure 4. Response model of maize kernel cell against A. Flavus at 20 hours post-infection. The model was constructed using the characteristics that we consider to provide the highest maize kernel cells resistance against infection with A. flavus. In gray, we show the most relevant proteins reported; in light blue, proteins with only their translational behavior; and in dark blue, proteins with transcriptional and translational behavior.
Statistical analysis for correlating proteome with resistance capacity. All original data matrices of the proteins with differential expression patterns were analized to correlate spots present in both yellow and white grain maize obtained by both buffers, so we regrouped all information, making irrelevant the extraction buffers just focus on grain color and resistance capacity. This was accomplished by transformation to presence/absence (binomial), and we applied generalized Procrustes methodology. Distance matrices generated were submitted to PCoA (figure 5). In this figure we noted that due to the matrices characteristics, 266-483 variables (spots) depending on the evaluated matrix and only in 4 cases (white resistant line proteome, white susceptible line proteome, yellow resistant line proteome, and yellow susceptible line proteome) PCoA could collect 97.6% of the information in the two firs axis, noticing that in axis X is the information concerning the grain color and in Y axis, the resistance capacity (figure 5). We can also observe that due to their distances from the centroid to the Y axis, WS (CML-448) and WR (CML-397) are the most susceptible and the most resistant lines, respectively, which corroborates the results of the modified KSA assay (table 1).
We think that the PCoA generates a statistical plane used as a predictive model of resistance capacity against A. flavus.
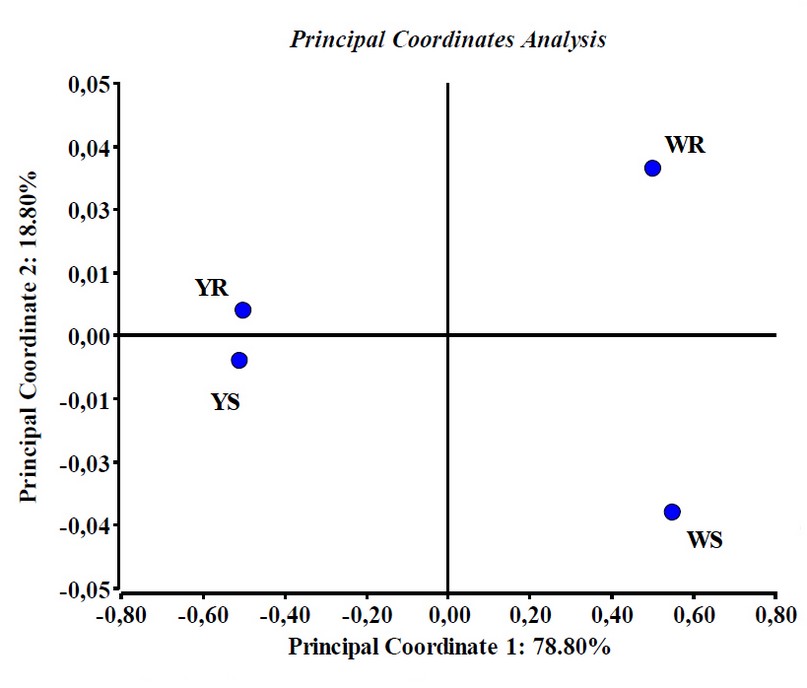
Figure 5. Principal coordinate analysis of the studied maize lines proteomic expression patterns. Points are centroids of each studied maize line. Note that in axis X is the information concerning the grain color and in Yaxis, the resistance capacity. Results obtained with InfoStat v 201223.
Testing the predictive statistical model of resistance. To evaluate the proposed statistical predictive model, we perform a principal coordinates analysis including not only the studied maize lines proteomes behavior, but also by creating two theoretical maize lines, a theoretical white resistant line (ThWR) which has the spot behavior of WR plus the protein patterns identified in YR that could bring resistance but absent in the WR line (figure 6A); and a theoretical yellow resistant line (ThYR), which has the spot behavior of YR plus the protein patterns identified in WR, that could bring resistance but absent in the YR line (figure 6B). Specifically, for the ThWR we added to its theoretical proteome, the behavior of the two isoforms of aldose reductase, Hypothetical protein Loc100273276 and aquaporin PIP1-5 obtained from yellow lines. For the ThYR case we added to the theoretical proteome, the behavior of NADPH HC toxin reductase, Phospho-2-dehydro-3-deoxyheptonate aldolase 2, the isoforms of Lon protease homolog 2, peroxisomal, NADPH adrenodoxin oxidoreductase Fructose bisphosphate aldolase, the isoforms of Phosphoglycerate kinase, ATP synthase β chain and the HSP70 obtained from the white lines. Statistical analysis demonstrates two important aspects; in first place, the metabolic model of maize kernel-cell response to the infection of A. flavus is very accurate, and in the second place, they corroborate the predictive power of the model developed in this work. Although ThWR receives no statistical gain in resistance when we incorporate the factors absent from it but present in YR, it demonstrates the predictive power of statistical analysis developed since the ThWR is located towards the white lines. For the case of the ThYR, we can see that the line remains located on the side of the yellow lines, which confirms the capacity of the predictive statistical model. Furthermore, by ThYR location in coordinates plane, we can infer that this hypothetical line would be more resistant than its original line (YR), which corroborates the contribution of the protein's behavior obtained from WR to resistance.
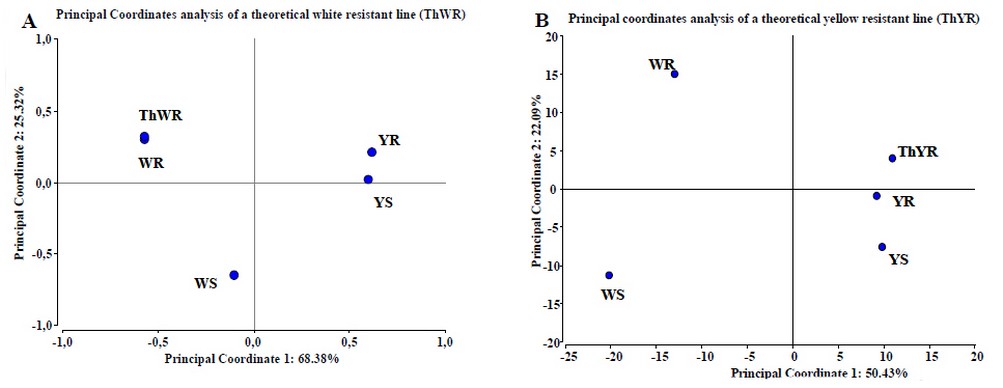
Figure 6. Test of PCoA predictive model using theoretical white (A) and yellow (B) maize lines. In (A) we observe no gain of resistance of the ThWR line than WR line; the analysis collects 93.7% of the information. In (B) we observe a real gain of resistance capacity of ThYR line compared to YR line when we include the behavior of some proteins from WR line that are absent in YR. The analysis collects 72.52% of the information. Results obtained with InfoStat v 201223.
We decided to make a final test of the model incorporating the proteome behavior obtained from the other two pre-selected maize lines (CML-46 and CML-247) at the same time (figure 7). In these results, we can see that both lines locate not only on the white side of the coordinates plane, but also their position concerning Y axis, which is the axis that collects the information relative to resistance capacity. This corroborates the statistical analysis predictive capacity and demonstrates its strong relationship with KSA results (table 1). KSA results reported CML-46 line to be slightly more resistant than YR (CML-409), but not as much as WR (CML-397) line, and on the other hand, CML- 247 was reported to be more susceptible than YS (CML-497) but less than WS (CML-448). These are the same results obtained by proteomics and PCoA analysis developed in this work.
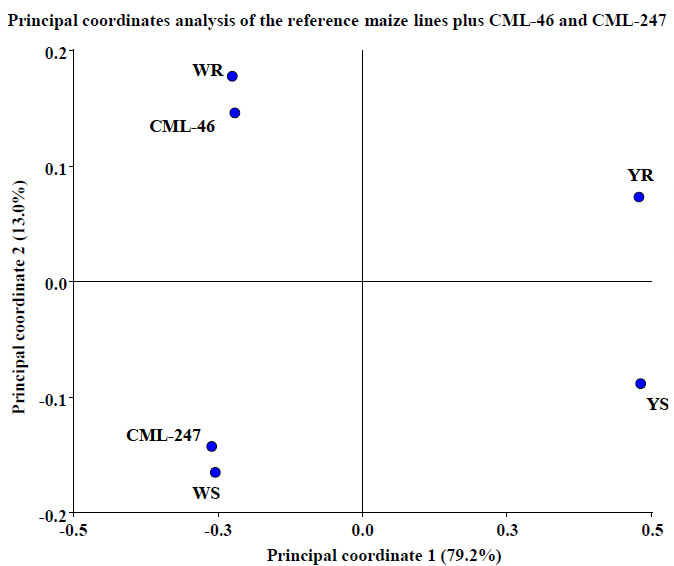
Figure 7. Test of PCoA predictive model using two more maize lines proteomic behavior. We observe that both lines locate not only on the white side of the coordinates plane but also on the coordinates plane, corroborating the statistical analysis predictive capacity. In two planes, the analysis collects 92.2% of the information. Results obtained with InfoStat v 201223.
CONCLUSIONS
This work exhibits a global view of the interrelations between the maize-kernel cell-proteins that occurs in response to infection with A. flavus, in an easy-to-understand response model of an individual cell. Besides, with the statistical analysis developed, it was possible to determine which proteins contribute to resistance capacity. Principal coordinates analysis allowed us to generate a statistical plane that can be used as a predictive method of other maize lines' resistance capacity. Cluster analysis showed that the proteomes obtained from the two resistant lines under infection conditions are more similar between each other than between susceptible lines. Furthermore, this relation is closer than the relationship between susceptible lines. This demonstrates that under infection, both resistant lines show a similar response mechanism. This work is the first known report of overexpression of NADPH HC toxin reductase stimulated by A. flavus infection. The presence of a similar enzyme to HC toxin synthetase from H. carbonum in the genome of A. flavus, detected by sequence homology, suggests the existence of a similar toxin and corroborates this result. We finally present an overview of the response mechanism of maize kernels to infection with A. flavus, and propose the use of these statistical methods of resistance capacity determination, using proteins expression pattern for a recurrent selection process to choose the most resistant maize lines after each sowing event, always preserving the required productivity levels.
Acknowledgments.
This work was supported by the BID-FONACIT II project Nº N-100001-D. We also thank the Fundación DANAC, for the assistance with material and equipment to accomplish several KSA assays.
REFERENCES
1. FAOSTAT Database [Internet]. [cited 2012 May 1]. Available from: http://faostat.fao.org/site/339/default.aspx
2. Malaguti G. Section 3: Enfermedades del maíz en Venezuela. In: Fontana H, González C, editors. El maíz en Venezuela. Caracas: Fundación Polar publications; 2000. p. 245–50.
3. Medina-Martínez MS, Martínez AJ. Mold occurrence and aflatoxin B1 and fumonisin B1 determination in corn samples in Venezuela. J Agric Food Chem. 2000;48(7):2833–6.
4. Mazzani C, Borges O, Luzón O, Barrientos V, Quijada P. Incidencia de Aspergillus flavus, Fusarium moniliforme, aflatoxinas y fumonisinas en ensayos de híbridos de maíz en Venezuela. Fitopatol Venez. 1999;12(9):13.
5. Paliwal RL. El Maíz en los trópicos: Mejoramiento y producción. Introducción al maíz y su importancia. Files deposit of the food and agriculture organization of the United Nations (FAO); 2001.
6. Pingali PL, Heisey PW. Cereal-crop productivity in developing countries: past trends and future prospects. In: Alston J, Pardey P, Taylor, editors. Agricultural science policy: Changing global agendas [Internet]. Baltimore and London: The International Food Policy Research Institute / The John Hopkins University Press; 2001. p. 56–82. Available from: http://www.cimmyt.org
7. Miché L, Battistoni F, Gemmer S, Belghazi M, Reinhold-Hurek B. Upregulation of jasmonate-inducible defense proteins and differential colonization of roots of Oryza sativa cultivars with the endophyte Azoarcus sp. Mol Plant Microbe Interact. 2006;19(5):502–11.
8. Schenk PM, Kazan K, Wilson I, Anderson JP, Richmond T, Somerville SC, et al. Coordinated plant defense responses in Arabidopsis revealed by microarray analysis. Proc Natl Acad Sci. 2000;97(21):11655–60.
9. Hajduch M, Ganapathy A, Stein JW, Thelen JJ. A systematic proteomic study of seed filling in soybean. Establishment of high-resolution two-dimensional reference maps, expression profiles, and an interactive proteome database. Plant Physiol. 2005;137(4):1397–419.
10. Kaku H, Nishizawa Y, Ishii-Minami N, Akimoto-Tomiyama C, Dohmae N, Takio K, et al. Plant cells recognize chitin fragments for defense signaling through a plasma membrane receptor. Proc Natl Acad Sci. 2006;103(29):11086–91.
11. Paliwal RL. El Maíz en los trópicos: Mejoramiento y producción. Enfermedades del maíz. Files deposit of the food and agriculture organization of the United Nations (FAO); 2001.
12. Tubajika KM, Damann KE. Sources of resistance to aflatoxin production in maize. J Agric Food Chem. 2001;49(5):2652–6.
13. Brown RL, Cleveland TE, Payne GA, Woloshuk CP, Campbell KW, White DG. Determination of resistance to aflatoxin production in maize kernels and detection of fungal colonization using an Aspergillus flavus transformant expressing Escherichia coli β-glucuronidase. Phytopathology. 1995;85(9):983–9.
14. Anderson TW. Asymptotic theory for principal component analysis. Ann Math Stat. 1963;34(1):122–48.
15. Krzanowski WJ. Between-groups comparison of principal components. J Am Stat Assoc. 1979;74(367):703–7.
16. Saitou N, Nei M. The neighbor-joining method: a new method for reconstructing phylogenetic trees. Mol Biol Evol. 1987;4(4):406–25.
17. Sneath PH, Sokal RR. Numerical taxonomy. The principles and practice of numerical classification. San Francisco, USA: Freeman W.H. and Co.; 1973. 573 p.
18. Gower JC. Some distance properties of latent root and vector methods used in multivariate analysis. Biometrika. 1966;53(3–4):325–38.
19. Campo S, Carrascal M, Coca M, Abián J, San Segundo B. The defense response of germinating maize embryos against fungal infection: a proteomics approach. Proteomics. 2004;4(2):383–96.
20. BioProfiling.de [Internet]. [cited 2011 Aug 1]. Available from: http://www.bioprofiling.de/index.html
21. European Bioinformatics Institute [Internet]. [cited 2011 Oct 1]. Available from: http://www.ebi.ac.uk/
22. Lee D-G, Ahsan N, Lee S-H, Kang KY, Bahk JD, Lee I-J, et al. A proteomic approach in analyzing heat‐responsive proteins in rice leaves. Proteomics. 2007;7(18):3369–83.
23. Di Rienzo JA, Casanoves F, Balzarini M, González L, Robledo C. InfoStat version 2012 [Internet]. Argentina: Universidad Nacional de Córdoba; 2012. Available from: http://www.infostat.com.ar/
24. Han F, Kleinhofs A, Kilian A, Ullrich SE. Cloning and mapping of a putative barley NADPH-dependent HC-toxin reductase. Mol Plant Microbe Interact. 1997;10(2):234–9.
25. Meeley RB, Walton JD. Enzymatic detoxification of HC-toxin, the host-selective cyclic peptide from Cochliobolus carbonum. Plant Physiol. 1991;97(3):1080–6.
26. Brosch G, Ransom R, Lechner T, Walton JD, Loidl P. Inhibition of maize histone deacetylases by HC toxin, the host-selective toxin of Cochliobolus carbonum. Plant Cell. 1995;7(11):1941–50.
27. Choudhary C, Kumar C, Gnad F, Nielsen ML, Rehman M, Walther TC, et al. Lysine acetylation targets protein complexes and co-regulates major cellular functions. Science. 2009;325(5942):834–40.
28. Haubruck H, Prange R, Vorgias C, Gallwitz D. The ras‐related mouse ypt1 protein can functionally replace the YPT1 gene product in yeast. EMBO J. 1989;8(5):1427–32.
29. Walton JD. HC-toxin. Phytochemistry. 2006;67(14):1406–13.
30. Baker RL, Brown RL, Chen Z-Y, Cleveland TE, Fakhoury AM. A maize lectin-like protein with antifungal activity against Aspergillus flavus. J Food Prot. 2009;72(1):120–7.
31. Baker RL, Brown RL, Chen Z-Y, Cleveland TE, Fakhoury AM. A maize trypsin inhibitor (ZmTIp) with limited activity against Aspergillus flavus. J Food Prot. 2009;72(1):185–8.
32. Bravo JM, Campo S, Murillo I, Coca M, San Segundo B. Fungus-and wound-induced accumulation of mRNA containing a class II chitinase of the pathogenesis-related protein 4 (PR-4) family of maize. Plant Mol Biol. 2003;52(4):745–59.
33. Chen Z-Y, Brown RL, Damann KE, Cleveland TE. Identification of unique or elevated levels of kernel proteins in aflatoxin-resistant maize genotypes through proteome analysis. Phytopathology. 2002;92(10):1084–94.
34. Chen Z-Y, Brown RL, Rajasekaran K, Damann KE, Cleveland TE. Identification of a maize kernel pathogenesis-related protein and evidence for its involvement in resistance to Aspergillus flavus infection and aflatoxin production. Phytopathology. 2006;96(1):87–95.
35. Jia J, Fu J, Zheng J, Zhou X, Huai J, Wang J, et al. Annotation and expression profile analysis of 2073 full‐length cDNAs from stress‐induced maize (Zea mays L.) seedlings. Plant J. 2006;48(5):710–27.
36. Sekhon RS, Kuldau G, Mansfield M, Chopra S. Characterization of Fusarium-induced expression of flavonoids and PR genes in maize. Physiol Mol Plant Pathol. 2006;69(1–3):109–17.
37. Sels J, Mathys J, De Coninck BM, Cammue BP, De Bolle MF. Plant pathogenesis-related (PR) proteins: a focus on PR peptides. Plant Physiol Biochem. 2008;46(11):941–50.
38. Fountain JC, Koh J, Yang L, Pandey MK, Nayak SN, Bajaj P, et al. Proteome analysis of Aspergillus flavus isolate-specific responses to oxidative stress in relationship to aflatoxin production capability. Sci Rep. 2018;8(1):1–14.
39. Chen Z-Y, Rajasekaran K, Brown RL, Sayler RJ, Bhatnagar D. Discovery and confirmation of genes/proteins associated with maize aflatoxin resistance. World Mycotoxin J. 2015;8(2):211–24.
Received: 23 November 2020
Accepted: 20 January 2021
Leandro Balzano, 1; Jesús Alezones, 2; Nardy Diez García, 3.
1. University of Florida. Department of Microbiology and Cell Science. Gainesville, United States. https://orcid.org/0000-0003-4620-3607
2. Fundación para la Investigación Agrícola DANAC. Carretera San Javier-Guarataro. Estado Yaracuy. Venezuela. https://orcid.org/0000-0001-9198-492X
3. Centro de Investigación Biotecnológicas del Ecuador (CIBE), Facultad de Ciencias de la Vida, Escuela Superior Politécnica del Litoral, ESPOL, Guayaquil, Ecuador.
* Corresponding author: [email protected]; +593 98 267 4083. https://orcid.org/0000-0003-3561-8815