2021.06.02.7
Files > Volume 6 > Vol 6 No 4 2021 > Vol 6 No 2 2021
INVESTIGATION / RESEARCH
Injury patterns among road traffic accidents: a hospital-based study in Ecuador

Aline Siteneski 1,2*, Leonardo D. Jalca Cantos 2, Emily P. Calderón Delgado2, Ruth M. Yaguache Celi2, César A. Silva Saltos 2, Angel Zamora2, Mónica Mastarreno 2, Diego Portalanza3.
Available from: http://dx.doi.org/10.21931/RB/2021.06.02.7
ABSTRACT
Traffic accidents are serious public health problems, account for profound economic costs to individuals, families, and societies. The social impacts range from physiological to economic causes, which could be a serious negative effect, especially in undeveloped countries. To further elucidate this problem, the prevalence of injuries caused by traffic accidents in a Santa Ana Health Centre, Portoviejo, Ecuador, was studied. This registry-based retrospective study analyzed data on Santa Ana, from Enero 2016 to Diciembre 2019, and the medical records of patients who had been admitted were extracted and analyzed. Passengers cars, motorcycles, and bicycles involved in collisions were included, and the information collected was relating to sex, age, and type of injuries. In total, 75%±6.34 patients victims of road traffic injuries were males, and their mean age was 20 and 49 years. There was a cooperative agreement between total injury occurrence (%) and type of vehicle. Bus and car accidents had lower relation (R2 = 0.44, 078) (p = 0.063, 0.005) with total occurrence. The highest relation was found in motorbikes (R2 = 0.98 p = 2e-05), since it's the primary or most popular means of transportation in the city. The best of our knowledge is the first study to reporting data on road traffic injuries in the Province of Manabí, the third-largest province in extension in Ecuador. Additional studies with larger populations are thus necessary to construct a robust data system in undeveloped countries that can facilitate the flow of reliable information about road traffic injuries.
Keywords: Road traffic injuries; Traumatic brain injury Polytrauma; Ecuador
INTRODUCTION
Traffic accidents are serious public health problems, account for profound economic costs to individuals, families, and societies 1. The estimated global annual rate of road traffic deaths of about 17.4 per 100000 population 2. in low-and-middle-income countries, despite owning just about 54% of the world's motor vehicles, is predicted to move from the current eighth to the sixth leading cause of death by the year 2030 3. It is suggested that for every one road traffic accident-related death, an additional 20–50 more individuals suffer some disability 4,5. Road traffic injuries are also the leading cause of years of potential life lost, according to the global burden of disease study 6,7. The severity is represented through the dates of 2016 when motor vehicle collision was responsible for 1.35 million fatalities globally, and these numbers are continuously increasing 8.
Data showed that almost 50% of global road traffic deaths occur among vulnerable road users, as motorcyclists represent 23 %, followed by pedestrians 22 %, and cyclists 4 % 9. Additionally, it is worth mentioning that early mortality and disability are attributable to young adults (between 15–44 years). More than 460.000 young people under 30 years die in road traffic crashes each year, about 1262 a day and, more than 75 percent of the deaths occur mostly among low- and middle-income countries 10. Any complications resulting from road traffic injuries contribute to the lengthened hospital occupancy, increasing costs, and mortality. Polytraumatizm is one of these complications, with rates descript up to 60% 11,12. Immobilization, limited immunologic response, emergency interventions, and frequent mechanical ventilation are the causes of this high complication rate; abrupt and primary trauma deaths are determined by significant brain injuries or significant blood loss (hemorrhagic shock). In contrast, late mortality is caused by minor brain damages and host defense failure (3–15). Both poly traumatism and traumatic brain injuries are increasing as motor vehicles are more widely used in developing countries 16,17.
In low-and middle-income countries, the scarcity of adequate medical care, rehabilitation services, and protection mechanisms aggravate problems. Road traffic injuries can include pedestrian, bicycle, or motor vehicle as a motorcycle, bus, or car whose collision involves at least one moving vehicle that occurred or originated on a road or street open to public traffic and resulted in one or more people being killed or injured 18,19. The resultant misfortune deaths or disabilities can take a heavy toll on families and friends, who frequently are obliged to dispense from work to dedicate themselves to the patient's care 5. Similarly, all patients and families suffer adverse financial debts because of the costly rehabilitation services and reduced income, physical discomfort, social and emotional strains 20,21. It is worth stating that due to the high costs associated with road traffic injuries related to patients' incapacity, governments have been adopting public politics to reduce these events. Equally, the road safety management, safer roads and mobility, safer vehicles, safer road users, and postcrash care 22,23.
According to the World Health Organization (WHO), there is a need for more research on epidemiologic accident patterns in low and middle or low-income countries to determine the problem's dimensions and identify vulnerable individuals. The health sector needs to expand its traditional caregiving role and be involved in areas relevant to promoting road safety, such as data collection, support, policy development, and capacity development 2,9,10. Determining the type of injury, the vehicle involved, and the risk group through the system by collecting information may be valuable key elements not identifying and assessing preventive actions. Those measures have critical clinical implications concerning these patients' care prevent traffic fatalities in middle or low-income countries 1,24,25. In Ecuador, according to the National Traffic Agency (NTA), the annual record of misfortunes has been decreased in the last four years, but for Manabí Province, this number was increased 26,27. In this sense, the present work's objective investigated road traffic injuries in the Santa Ana health Centre in Ecuador.
METHODS
Patients and variable description
The observational study was a retrospective analysis of the data from a health center-based database of Santa Ana in Ecuador, belonging to Portoviejo city, Manabí (Figure 1). The data from Santa Ana were recorded from 2016 until 2019 by the Technical University of Manabí (UTM) medicine students, all traffic accident injuries were registered. The inclusion criteria for the study were no fatal patients. Collected information on the variables were type and injury mechanisms: polytrauma, brain injuries, gender, age, and type of vehicle involved (motorcycle, bicycle, car, or bus) during 4 years (2016-2019).
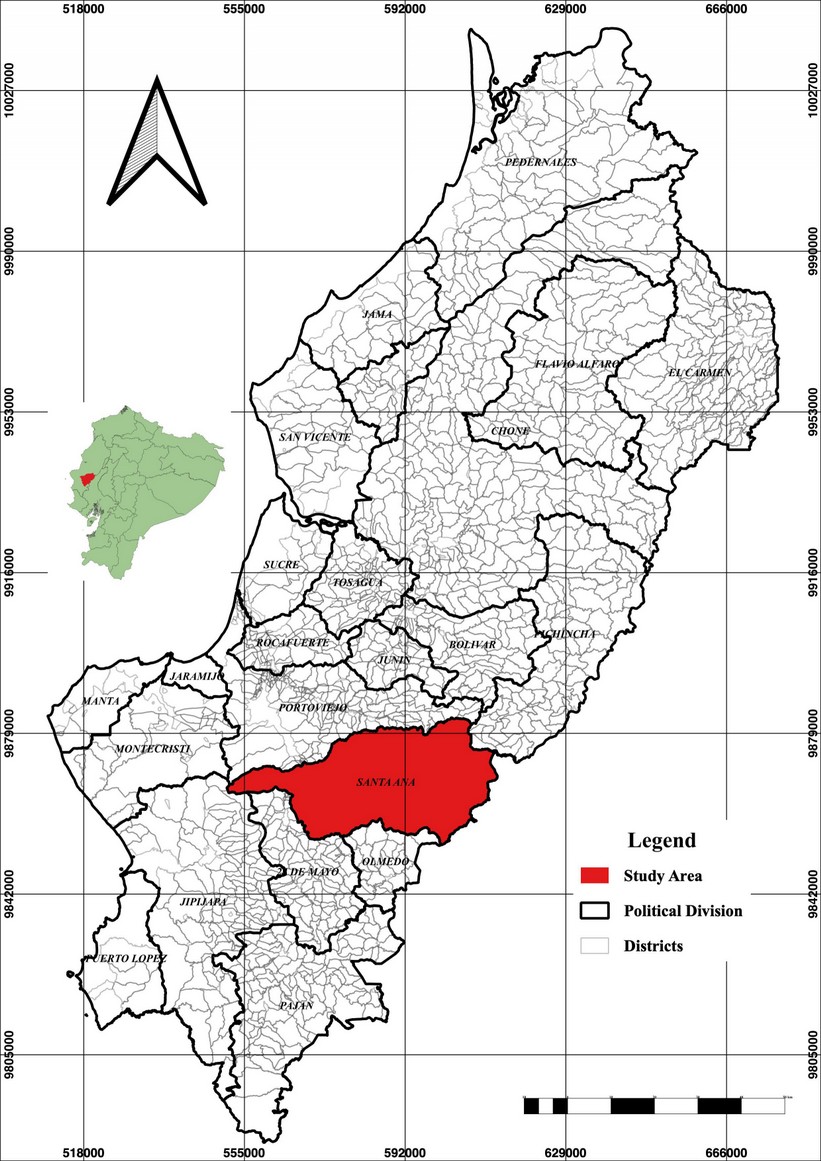
Figure 1. The figure represents the study area in Santa Ana, Manabí Province, in Portoviejo, Ecuador.
Variable analysis
To understand the relation between the obtained data, an exploratory data analysis (EDA) was performed. First, we plotted boxplots for all types of vehicles (TOV) (bike, bus, car, and motorbike) and injuries (TOI) brain injury (TB), polytrauma (POL), upper limb fracture (ULF), lower limb fracture (LLF), spinal, chest and abdomen injury (SCA), facial injuries (FI), superficial injuries (SI) and dislocations (DIS) for4 years (2016-19). Second, we divided TOV and TOI into years to understand year-to-year variations. A boxplot is a standardized way of displaying the data set based on a five-number summary: the minimum, the maximum, the sample median, and the first and third quartiles 28,29. We use the interquartile range (IQR) to compare variables using the following equation (Eq 1)

were IQR is the interquartile range, Q3 is the third quartile, Q1 is the first quartile, qn (0.75) is the upper quartile, and qn (0.25) is the lower quartile. Third, to show the spread of positive and negative values from TOI, a diverging chart was performed based on the total number of years. Preparation of the data as follows:
a) Compute normalized values, to create central, positive and negative divergence (Eq. 2):

were Nv being the normalized values, Q are single value observation, Qmean is the value mean, Sd is the standard deviation, and Qi are the total observations 30. Fourth, density histograms were plotted to represent the visualization of the variations within TOV and TOI. For this, using equispaced breaks (x=observed values) and estimated density values (y= relative frequencies) as follows (Eq. 3)

The number of breaks and f(xi) 31 is the estimated density value 32. Finally, to represent gender and age groups differences, we used a population pyramid 33 in which ages were divided into groups (1 – 4 years, 5- 9 years, 10 – 14 years, 15 – 19 years, 20 – 49 years, 50 – 64 year and > 65) using ranges from the Ecuadorian Nacional Survey Institute (INEC) 34. Finally, the total relative frequency was correlated with the type of vehicle using linear regression; for this, we calculate the coefficient of determination (R2), slope, and intercept.
R2 is the coefficient of determination, x is the frequency value for total injuries per type of vehicle, and y is the vehicle's total frequency. All plots and calculations were performed using RStudio version 1.2.5033 35,36 using stats package. Density histograms and boxplots were plotted using the ggplot2 package for R 37.
Compliance with ethical standards
Personal identifiers had already been removed from the study. Because of this study's anonymous and retrospective nature, the need for informed consent was waived by the Ethics Committee that approved the study Protocol.
RESULTS
Type of injuries comparisons between the four years
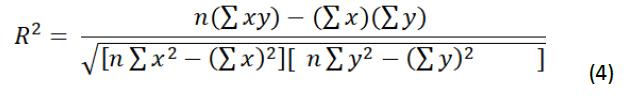
The highest traffic accident injury incidence during the studied period (2016-2019) is shown in figure 2a and 2b. In the first year, 45% of the patients suffered a traumatic brain injury (considered mild, moderate, and severe), poly traumatism (estimated as mild, moderate, and severe), which represented 35%, and 10% cases of lower extremity fracture (equivalent to the tibia, fibula, malleoli, patella, pelvis, anterior cruciate ligament, and metatarsus), open upper extremity wound (associated with the radius and ulna), open upper extremity wound (radius and ulna), lower extremity (considering tibia and metatarsus) corresponding to 5% in each of the cases respectively. In the second year of study, poly traumatism corresponding to 32.26%, traumatic brain injury corresponding to 25.81%, fracture of the lower extremity equivalent to 21.51%, 5.38% upper extremity (associated with carpus, radius, ulna, humerus and clavicle), FI corresponding to 4.30% (related to fracture of the upper jaw, eye injury, eyebrow injury, fracture of the bones of the face and nose) and fracture of the spine, chest, and abdomen representing 4.30%, open lower extremity wound equivalent to 3.23%, superficial injury (corresponding to multiple lacerations) with 2.15% and dislocation (upper and lower limb) with 1.08%. In the third year of the study, we found a high multiple trauma percentage (48.75%) and traumatic brain injury (21.25%), followed by LLF (12.50%), upper limb (8.75%), open lower limb, and FI (3.75% each group) and dislocation (1.25%). Finally, in 2019, we found traumatic brain injury and polytrauma (18, 25% respectively) as the leading cause of injury, followed by superficial injury (22%) LLF (14%) ULF (8 %), spine injury, chest and abdomen (6%), face injury (3%), and dislocation (5%).
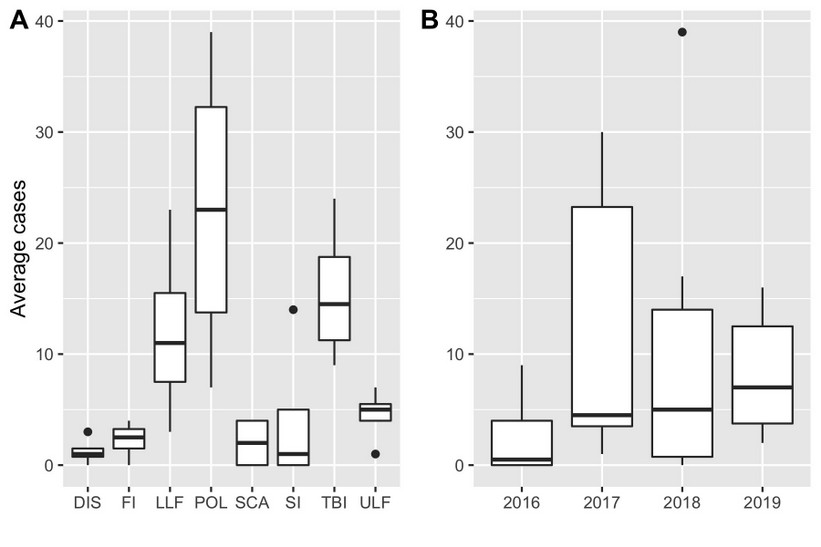
Figure 2. Prevalence of cases per type of vehicle and average of occurrence over time. The number of cases per type of injury (TOI) (a) and yearly average of occurrence (b) boxplot. Boxes represent values between the 25th and 75th percentile. Lines represent the median, and the dots represent the outliers.
Type of vehicle comparisons between the years of the studied period
Four motor vehicle types were recorded (motorcycle, bicycle, car, and bus) associated with road traffic accidents. (Figures 3a and 3b). In 2016, it was observed that the frequencies of victims were high in motorcyclists (represented 75% of the cases), followed by car users (25%). Later, in 2017, road traffic accidents represented by motorcycles, cars, and buses were 78.49%, 17.20%, and 4.30%, respectively. Statistics for 2018 shown that 85% of accidents were motorcycles, 13.75% automobiles, and 1.25% bicycles. Decisively, in 2019 was observed 83% of motorcyclists, followed by 11% cars, buses (5%), and cyclists (2%).
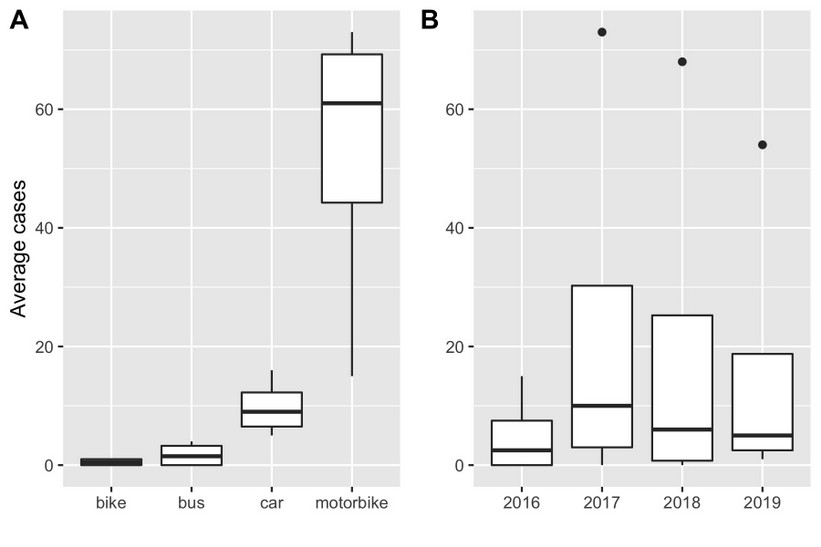
Figure 3. Prevalence of cases per type of vehicle and average of occurrence over time. The number of cases per type of vehicle (TOV) (a) and yearly average of occurrence (b) boxplot. Boxes represent values between the 25th and 75th. Lines represent the median and the dots represent the outliers.
Age and sex comparisons.
From 2016 to 2019, the prevalence of road traffic injuries was recorded mainly in men and was gradually increased over the years, reaching its highest record in 2017 (75% in the first year, 81.72%, 80 and 75.38% respectively, of the total data of 258 investigated patients). The predominant age of the victims was between 20 and 49 years.
Type of vehicle and trauma relation
The Odds Ratio (OD) represent the type of injury and type of vehicle were descript in table 1 OR were > 1 showing a positive association between motorcycles or cars and all kinds of injuries. Total cases per type of trauma were represented in Figure 4. There was a cooperative agreement between total injury occurrence (%) and vehicle type (Figure 5). Bus and car accidents had lower relation (R2 = 0.44, 078) (p = 0.063, 0.005) with total occurrence. The highest relation was found in motorbikes (R2 = 0.98 p = 2e-05), since it's the primary or most popular means of transportation in the city.
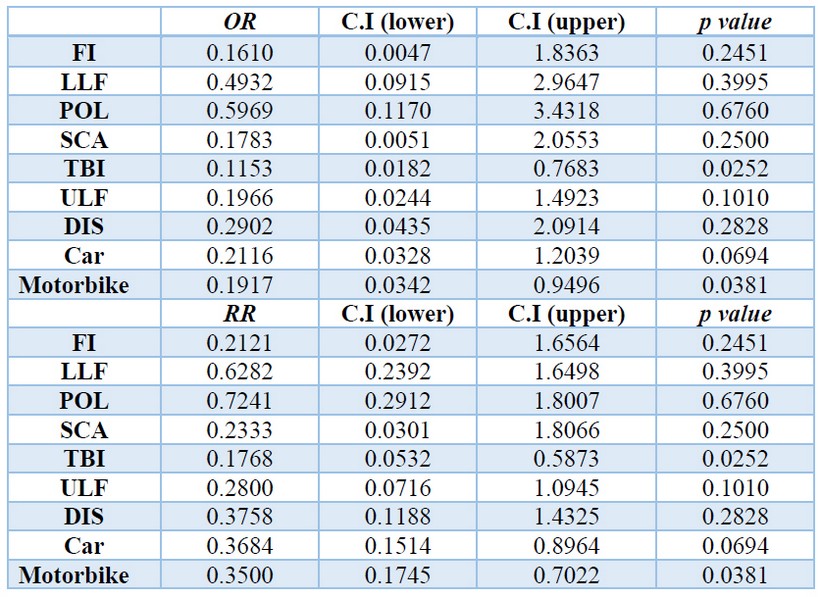
Table 1. Odds and risk ratios for the type of injury and type of vehicle.
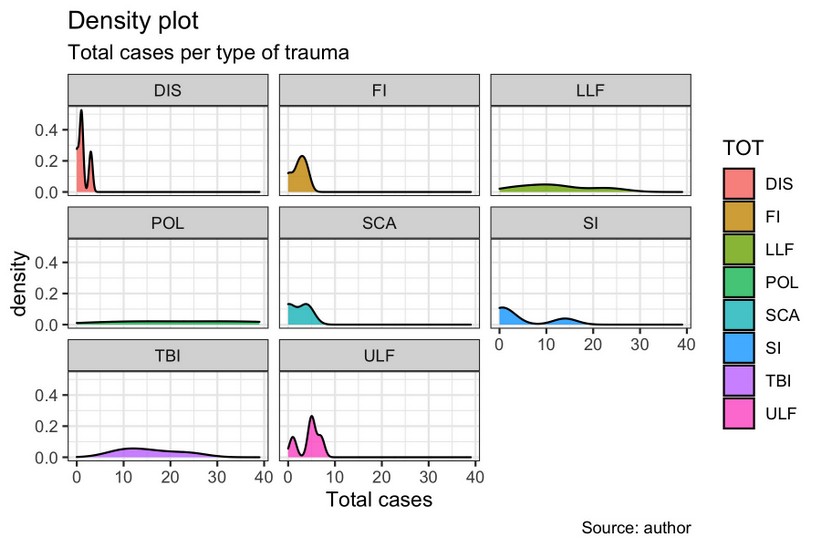
Figure 4. Density histogram represents the type of trauma for all years of study. (a)Type of trauma density histogram; (brain injury (TB), polytrauma (POL), upper limb fracture (ULF), LLF (lower limb fracture), spinal, chest, and abdomen injury (SCA), FI (face injury), superficial injuries (SI) and dislocations (DIS) for all years, (b) Normalised diverging bars for total counts (incidents) for TOI. *relative values.
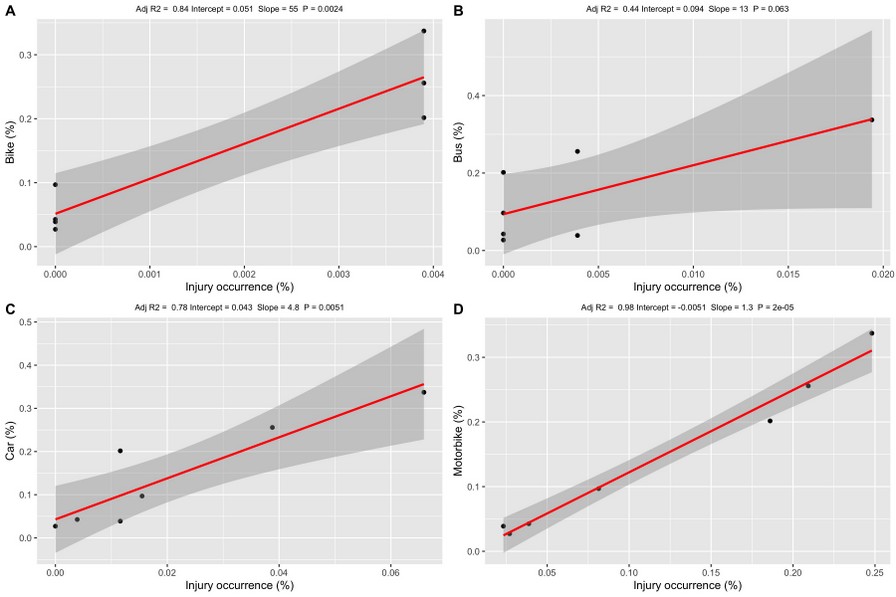
Figure 5. General linear regressions indexes for total injury occurrence and a) bike, b) bus, c) car, and d) motorbike accidents.
DISCUSSION
The present study found that road traffic accidents were more frequent in motorcyclists of young men. Besides, we showed that the most affected age group was 20 to 49 years old, while also the more common type of lesion was poly traumatism followed by traumatic brain injuries. The number of road traffic accidents in Ecuador, specially Manabí province, increased during the study period (four years) 38. In the world, road traffic injuries are reported as the leading cause of death among young people aged 15–29 years and are among the top three causes of mortality among people aged 15–44 years 39, 40. To the best of our knowledge, it is the first to report data on road traffic injuries in the province of Manabí, third-largest province in extension in Ecuador.
Several lines of evidence have indicated that motorcycles are considered the most dangerous form of motorized transportations, and the risk of its accidents is further heightened by poor road conditions coupled with busy roads. Even though motorcycles are one of the private transport used extensively in many countries because of their affordability, motorcycles are the most unsafe form of motor-powered transportation 41. Considering its easy maneuverability and speed, victims of motorcycle crash undergo more movement and impact and sustain more severe injuries. In our study motorcyclists, were most vulnerable to road traffic injuries; young patients constituted the vast majority of injured motorcyclists. Nearly half of all global road traffic deaths are among pedestrians and motorcyclists, mostly occurring on urban roads 10. Pedestrians are the most vulnerable road users, making up to 22% of the annual global road traffic deaths in low and middle-income countries, followed by motorcyclists, pedal cyclists, and car occupants 4. In a country like Ecuador, where a substantial portion of road users are motorcyclists, our results reinforce the importance of the vital necessity to implement effective local policies to reduce injury risk associated with motorcycles. Education campaigns promoting safe riding habits and behavior and helmets must be implemented to reduce motorcycle casualties 24,41. Introducing and enforcing the use of motorcycle helmets can reduce death risk by 40 percent and the risk of severe head injuries by more than 70 percent 42, so the use of helmets has the potential to reduce road traffic injuries and deaths substantially and the associated personal and societal costs.
Although an increase of technological advancements and road improvements has been made to avoid motors vehicle accidents and reduce occupants' injury severity of occupants 43, we found that car accident were the second cause of road traffic injuries in Santa Ana Health Centre Ecuador. Motor vehicle collision is predicted to become the fifth most common cause of fatalities globally by 2030 5 and the first cause of death in developed countries 44, while in low and middle-income countries, most of the victims are cyclists and motorcyclists 39,44. Therefore, it is recommended that all countries more significant efforts to decrease car fatalities. In the years between our study periods, laws requiring seatbelt usage in rear seats and strengthened fines for drunk driving were established to reduce car accidents in Ecuador. The use of a safety seat belt might be responsible for reducing car accidents for an extended period. Road traffic law in Ecuador was revised so that rear-seat passengers were required to wear a seatbelt, in addition to four-wheeled vehicle drivers and front-seat passengers. Previous studies showed the advantage of wearing a rear seatbelt in dropping the risk of motor vehicle crash-related mortalities and injuries 45.
Interestingly, a systematic review of 15 randomized controlled trials on the efficacy of safety education agendas indicated the scarcity of good evidence in low and middle-income countries of the effectiveness of traffic education. Highlight the importance of effective enforcement of traffic regulations could provide economic benefits, combining the strategy of education with legislation and enforcement 16,20. Moreover, vehicle crashworthiness improvements have increased the collision survivability of motor vehicle passengers, and the focus of recent automobile designs is to avoid crashes altogether 43.
Imprudence at the individual level, like speeding, driving while impaired, driving while distracted, inexperienced or young, and using substances, favors road traffic accident injuries 46. In the present study, most frequently, road traffic injuries were observed in 20 to 49 years old persons. Precisely the age of more production in work when these people in consequence of road traffic accident injuries could become disabled and these results corroborate previous studies in other countries 47. With this, patients and families suffer adverse financial debts because of the expensive rehabilitation services and reduced income, physical pain, social and psychological stresses, besides the absence from work 48. Furthermore, due to the high costs associated with road traffic injuries related to patients' incapacity, public policies were used to define the costs in terms of years of life saved or disability-adjusted life years averted 49.
WHO considers a very cost-effective intervention if it generates a healthy life year for less than the gross domestic product per capita, cost-effective if it produces a healthy life year for less than three times the gross domestic product per capita and non-cost-effective if it produces a healthy life year for more than three times the gross domestic product per capita 50. Our data reinforce the importance of adequate public policies to prevent road traffic injuries in an underdeveloped country such as Ecuador. Interventions focus should address setting more strict blood alcohol concentration limits, enforcing seat belts for drivers and passengers, and helmets for motorcyclists and bicyclists 45. Polytraumatizm is a severe consequence with rates up to 60% mortality 12. Immobilization, limited immunologic response, emergency interventions, and the frequent need for mechanical ventilation are descript as causes for this high complication rate 13, mostly due to central nervous system damage or exsanguination, have been descript of causes of death 17. Fractures of the diaphysis and the distal third of the femur and the proximal tibia are also frequent in poly traumatized patients. Open fractures of the lower limbs are more severe since they are associated with a more extensive soft tissue injury and other simultaneous injuries, and that lower extremity fracture was found ourselves as the third most common cause of road traffic injuries in Santa Ana Health Centre. Despite these findings, our 4 years of data (2016-2019) revealed that a reduction in the total number of accidents might be attributed to factors, such as education, law enforcement, improvement of public policies, safety belts use, or shortening of the duration between the emergency call and hospital arrival, etc. These measures may be responsible for the reduction of road traffic injuries that we found.
The present study has considerable limitations; for example, we did not include all injury cases in the Manabí Province; instead, a small health center in the capital was chosen. It is an area of great agricultural importance with a high circulation rate; our data can serve as a source for future studies. Indeed, we did not consider the information on crashes, such as collision details (a type of car, collision direction, and velocity), seatbelt use, and airbag deployment, and this database was hospital-based, cases of pronounced instant death at collision scene were omitted. This may be considered in future studies making connections between accident data collected by the police Department and medical data based on hospital records. This strategy would make the data more reliable. However, we believe our analyses provided representative results. Interestingly, a study evaluated deaths in Manabí Province, where 7% of fatalities were caused by road traffic accidents in 2016, lower rates than in other provinces. It is worth highlighting that unclear or missing data were excluded before analysis in the present study; thus, the analyzed data had a high-reliability level.
Consequently, further studies about road traffic injuries are warranted at both the national and local levels to establish the mortality and morbidity estimates, reliable information and data on modifiable risk factors, costs associated, age- and gender-specific, joint injury severity gashes correlated with fatality. Finally, our findings described here highlight the ability of data collections in a small health center. Establishing robust yet straightforward data systems in middle and low-income countries can facilitate the flow of continuous, reliable, and systematic information on key variables to all stakeholders 24, 51.
CONCLUSION
Altogether, the results provided suggest a reducing total road traffic injuries over the years. We showed more frequently in motorcycle young men (between 20 to 49 years old), suffered road traffic injuries, while also a more common type of lesion was poly traumatism followed by traumatic brain injuries. Additional studies are thus warranted to establish a causal relationship between these effects. These results also highlight the importance of considering modifiable risk factors and public policy interventions as the basis for the prevention of road traffic injuries.
Acknowledgments and funding
This study was aid by the Research Institute of the Technical University of Manabí. Authors are thankful to the students of medicine that performed data-collection and the Faculty of Health Sciences, Medical career to provide facilities. The authors would like to thank the Santa Ana Health Centre for using the data records required to perform this work.
Conflict of interest: The authors declare that they have no conflict of interest.
REFERENCES
1. Bachani AM, Paichadze N, Bentley JA, Tumwesigye NM, Bishai D, Atuyambe L, Wegener S, Guwatudde D, Kobusingye, Hyder AA. Postgraduate training for trauma prevention, injury surveillance and research, Uganda. Bull World Health Organ. 2018; 96:423-427.
2. Rohrer WM. Road Traffic Accidents as Public Health Challenge in the Gulf Cooperation Council (GCC) Region. Public Heal - Open J. 2016; 1(3):e6-e7.
3. WHO. Global Status Report on Road Safety 2018: Summary. Geneva: World Health Organization. 2018 (WHO/NMH/NVI/18.20). Licence: CC BY-NC-SA 3.0 IGO). 2018. [Accessed 20 April 2020]
4. Sidawi B, al Majil A. Editorial on Impacts on Traffic Safety. International Journal of Transportation Science and Technology. 2012; 1(4):1-3.
5. Peden M. Global collaboration on road traffic injury prevention. Int J Inj Contr Saf Promot. 2005; 12(2):85-91.
6. Global, regional, and national incidence, prevalence, and years lived with disability for 354 diseases and injuries for 195 countries and territories, 1990–2017: a systematic analysis for the Global Burden of Disease Study 2017. Global Burden of Disease Collaborative Network. Lancet. 2017; 392:10159.
7. Zhang K, Batterman S. Air pollution and health risks due to vehicle traffic. Sci Total Environ. 2013; 450-451, 307–316.
8. Whiteford HA, Degenhardt L, Rehm J, Baxter AJ, Ferrari AJ, Erskine HE, et al. Global burden of disease attributable to mental and substance use disorders: Findings from the Global Burden of Disease Study 2010. Lancet. 2013; 382 (9904): 1575-1586.
9. WHO. Global status report on road safety 2015. Inj Prev. 2015. [Accessed 2 April 2020]
10. WHO. WHO: Road traffic injuries. World Health Organization. 2018. [Accessed 2 Mayo 2020]
11. Sierink JC, Saltzherr TP, Wirtz MR, Streekstra GJ, Beenen LFM, Goslings JC. Radiation exposure before and after the introductionof a dedicated total-body CT protocolin multitrauma patients. Emerg Radiol. 2013; 20 (6): 507–512.
12. Saltzherr TP, Visser A, Ponsen KJ, Luitse JS, Goslings JC. Complications in multitrauma patients in a dutch Level 1 trauma center. J Trauma - Inj Infect Crit Care. 2010; 69 (5): 1143-1146.
13. Keel M, Trentz O. Pathophysiology of polytrauma. Injury. 2005; 36(6):691-709.
14. Mauritz W, Brazinova A, Majdan M, Leitgeb J. Epidemiology of traumatic brain injury in Austria. Wien Klin Wochenschr. 2014; 126: 42-52.
15. International Society for the Study of Trauma and Dissociation. Guidelines for Treating Dissociative Identity Disorder in Adults. J Trauma Dissociation. 2011; 12: 115-187.
16. Maas AI, Stocchetti N, Bullock R. Moderate and severe traumatic brain injury in adults. The Lancet Neurology. 2008; 7(8):728-41.
17. Probst C, Zelle BA, Sittaro NA, Lohse R, Krettek C, Pape HC. Late death after multiple severe trauma: When does it occur and what are the causes? J Trauma - Inj Infect Crit Care. 2009; 66 (4):121-1217.
18. Lagarde M, Palmer N. The impact of health financing strategies on access to health services in low and middle income countries. Cochrane Database Syst Rev. 2018; 2018(4):CD006092.
19. Verguet S, Jamison DT. Health Policy Analysis: Applications of Extended Cost-Effectiveness Analysis Methodology in Disease Control Priorities, Third Edition. In: Disease Control Priorities. Improving Health and Reducing Poverty. 2017; 3a ed (9): 157-166.
20. Yan LL, Li C, Chen J, Miranda JJ, Luo R, Bettger J, Zhu Y, Feigin V, O'Donnell M, Zhao D, Wu Y. Prevention, management, and rehabilitation of stroke in low- and middle-income countries. Neurol. Sci. 2016; 2(2) 21–30
21. Naghavi M, Abolhassani F, Pourmalek F, Lakeh M, Jafari N, Vaseghi S, et al. The burden of disease and injury in Iran 2003. Popul Health Metr. 2009; 15:7-9.
22. Belin MÅ, Tillgren P, Vedung E. Vision Zero - a road safety policy innovation. Int J Inj Contr Saf Promot. 2012; 19 (2): 171-179.
23. Collaboration UNRS. Global plan for the Decade of Action for Road Safety 2011–2020. Geneva WHO. 2011; (3):1-16.
24. Hyder AA, Allen KA, Peters DH, Chandran A, Bishai D. Large-scale road safety programmes in low- and middle-income countries: An opportunity to generate evidence. Glob Public Health. 2013; 8 (5): 504-518.
25. Slyunkina ES, Kliavin VE, Gritsenko EA, Petruhin AB, Zambon F, He H, et al. Activities of the Bloomberg Philanthropies Global Road Safety Programme (formerly RS10) in Russia: Promising results from a sub-national project. Injury. 2013; 44: 64 - 69.
26. Agencia Nacional de Tránsito. Descargables - Accidentes2015 - Agencia Nacional de Tránsito del Ecuador - ANT. Agencia Nacional de Tránsito. 2015.
27. Estadística de transporte terrestre y seguridad vial. Estadísticas sobre Siniestros de Tránsito - Agencia Nacional de Tránsito del Ecuador - ANT. Estadísticas de transporte terrestre y seguridad vial. 2019.
28. Hubert M, Vandervieren E. An adjusted boxplot for skewed distributions. Comput Stat Data Anal. 2008; 52 (12): 5186-5201.
29. Gooch JW. Boxplot. In: Encyclopedic Dictionary of Polymers. 2011.
30. Rangel A, Clithero JA. Value normalization in decision making: Theory and evidence. Current Opinion in Neurobiology. 2012; 22(6):970-81.
31. Tabelow K, Clayden JD, Lafaye de Micheaux P, Polzehl J, Schmid VJ, Whitcher B. Image analysis and statistical inference in neuroimaging with R. Neuroimage. 2011; 55 (4), 1686-1693.
32. Venables WN, Ripley BD. Modern Applied Statistics with S. 2002. Springer-Verlag Nueva York 44a ed: 498p.
33. Aldrich J, Rodríguez H. Population Pyramid. In: Building SPSS Graphs to Understand Data. 2014. California: Sage publications, 392p.
34. Moncayo J, García J. INEC. Compendio Estadístico 2014 Ecuador. Inec: 290p.
35. Rstudio Team. RStudio: Integrated Development for R. [Online] RStudio, Inc., Boston, MA. 2016.
36. RStudio Team. RStudio. Boston: Integrated Development for R. RStudio. 2017.
37. Wickham H. ggplot2 - Elegant Graphics for Data Analysis, Second Edition. Media. 2016; 2a ed: 260 p.
38. Agencia Nacional de Tránsito. Siniestros Por Provincia a Nivel Nacional- Diciembre 2018. 2018;11.
39. World Health Organization. Global status report on road safety. World Health Organisation; 2015. [Accessed 20 junio 2020]
40. Rosli N, Ambak K, Daniel BD, Sanik ME. Structural equation modelling in behavioral intention to use safety helmet reminder system. In: MATEC Web of Conferences. 2016; 47: 1-7.
41. Esmaeilikia M, Radun I, Grzebieta R, Olivier J. Bicycle helmets and risky behaviour: A systematic review. Transp Res Part F Traffic Psychol Behav. 2019; 60: 299-310.
42. Liu BC, Ivers R, Norton R, Boufous S, Blows S, Lo SK. Helmets for preventing injury in motorcycle riders. Cochrane Database of Systematic Reviews. 2008; 23;(1):CD004333.
43. Jermakian JS, Bao S, Buonarosa ML, Sayer JR, Farmer CM. Effects of an integrated collision warning system on teenage driver behavior. J Safety Res. 2017; 61: 65-75.
44. Rogé J, El Zufari V, Vienne F, Ndiaye D. Safety messages and visibility of vulnerable road users for drivers. Saf Sci. 2015; 79: 29:38.
45. Ng CP, Law TH, Wong SV, Kulanthaya S. Factors related to seatbelt-wearing among rear-seat passengers in Malaysia. Accid Anal Prev. 2013; 50: 351-360.
46. Kleiman MAR, Jones T, Miller C, Halperin R. Driving While Stoned: Issues and Policy Options. SSRN Electron J. 2018; 11 (2): 12.
47. Choquehuanca-Vilca V, Cárdenas-García F, Collazos-Carhuay J, Mendoza-Valladolid W. Epidemiological profile of road traffic accidents in Peru, 2005-2009. Rev Peru Med Exp Salud Publica. 2010; 27(2): 162-69.
48. Mock C, Arreola-Risa C, Quansah R. Strengthening care for injured persons in less developed countries: a case study of Ghana and Mexico. Injury control and safety promotion. 2003; 10(1-2):45-51.
49. Ditsuwan V, Lennert Veerman J, Bertram M, Vos T. Cost-effectiveness of interventions for reducing road traffic injuries related to driving under the influence of alcohol. Value Heal. 2013; 16(1):23-30.
50. Hutubessy R, Chisholm D, Tan-Torres Edejer T, Adam T, Baltussen R, Evans D, et al. Generalized cost-effectiveness analysis for national-level priority-setting in the health sector. Cost Eff Resour Alloc. 2003; 19;1(1):8.
51. Razzak JA, Sasser SM, Kellermann AL. Injury prevention and other international public health initiatives. Emergency Medicine Clinics of North America. 2005; 23(1):85-98.
Received: 12 December 2020
Accepted: 20 January 2021
Aline Siteneski 1,2*, Leonardo D. Jalca Cantos 2, Emily P. Calderón Delgado2, Ruth M. Yaguache Celi2, César A. Silva Saltos 2, Angel Zamora2, Mónica Mastarreno 2, Diego Portalanza3.
1 Research Institute, Technical University of Manabí, Portoviejo, Ecuador.
2 Faculty of Health Sciences, Medicine Career, Technical University of Manabí, Portoviejo, Ecuador.
3 Federal University of Santa Maria, Department of Physics, Climate Research group, Av. Roraima, 1000, Santa Maria (RS), Brazil.
* Corresponding Author
Dr. Aline Siteneski, Ph.D.,
Research Institute and Faculty of Health Sciences, Medicine Career.
Technical University of Manabí, Portoviejo, Ecuador.
Phone: (+593) 099129 2040
Email address: [email protected]