2022.07.02.32
Files > Volume 7 > Vol 7 No 2 2022

Hadeel Mohamed Saeed Majeed*1 ; Ahmed Abdul-Hassan Abbas2; Mahmood Shakir Khudair
Dept. of Microbiology, College of Medicine, Al-Nahrain University, Baghdad, Iraq
* Correspondence:e-mail; [email protected]
Available from: http://dx.doi.org/10.21931/RB/2022.07.02.32
ABSTRACT
Type2 Diabetes mellitus is a chronic and most common form of diabetes characterized by hyperglycemia arising from problems with the utilization or production of insulin. Various agents related to an increased risk of developing T2DM include pro-inflammatory cytokines that are critically associated with the progressive resistance of insulin and the pathogenesis of newly diagnosed T2DM. The study aimed to study a possible association of TNFα serum level in diabetes type2 initiation using enzyme-linked immunosorbent assay (ELISA). In this study, 50 newly diagnosed T2DM patients with an age range between 25 and 70 years were included; in addition to fifty healthy volunteers whose sex and age were matched with the T2DM patient’s group to act as a control, serum samples were collected to estimate serum levels of TNFα by Enzyme-Linked Immunosorbent Assay (ELISA). The TNFα revealed a statistically significantly higher serum level in the newly diagnosed T2DM patients compared with the healthy control group.
On the other hand, there is no statistically significant difference between obese and non-obese T2DM. The higher level of TNFα in T2DM patients compared to the control group may have a role in the development and pathogenesis of T2DM. The current study showed an association between the serum TNFα level and newly diagnosed type 2 DM, and this studied marker might help in the prediction of T2DM
Keywords. T2DM, TNFα, ELISA
List of Abbreviation: T2DM= type2 diabetes mellitus, TNFα=tumor necrosis factor-alpha., Triglyceride (TG), Total cholesterol (Tc), High-density lipoprotein (HDL), Low-density lipoprotein (LDL), Atherogenic index (AI).
INTRODUCTION
Type 2 diabetes is related to insulin resistance associated with metabolic stress and inflammation and other factors, such as genetic1, that can lead to cardiovascular disease and atrophy 2. Although type 2 diabetes (T2D) is characterized by insulin resistance which means that insulin responding to its target tissues (especially the liver, muscle, and fat) will be the decline, in this case, insulin inoperative with rising its generation to sustain glucose level as a consequence, blood sugar is unable to enter these cells and be used for energy storage. When sugar is unable to enter cells, the blood sugar level rises. This is referred to as hyperglycemia. The body is incapable of using glucose as an energy source. This results in type 2 diabetes symptoms3,4,5. Type 2 diabetes commonly advances misdiagnosed for several years due to slow of hyperglycemia and, through earlier stages, is mostly insufficient for the patient to observe the usual manifestations of diabetes. However, patients who are undiagnosed have rising danger progressing of microvascular and macrovascular problems 6. Hence, due to the immediately developing frequency and ubiquity of T2DM rises necessary urgency to advance competent or powerful means being used for initial and earlier detection of the disease in order to avoid the development of T2DM and ameliorate clinical outcomes of patient7. Tumor necrosis factor-alpha (TNF-α) is one the most important pro-inflammatory mediator. It is yielded chiefly from adipocytes and/or peripheral tissues and activates inflammation of particular tissue via the production of reactive oxygen species and induction of diverse intermediate transcriptional pathways8. When TNF-α consistent elevated it will activate resistance of insulin in both peripheral tissues and adipocytes via hindering the insulin signaling through serine phosphorylation which promote arising of T2DM 9. It is a cytokine that is secreted by chronically inflamed cells. The immune system produces it. Type 2 diabetes mellitus is believed to be connected with low-grade chronic pancreatic inflammation 10.
MATERIALS AND METHODS
This case-control study was conducted on 100 Iraqi adults who were divided into two groups
Group (1): includes 50 newly diagnosed patients with type2 diabetes mellitus as a case group.
Group (2): includes 50 healthy subjects as a control group.
Diabetic pregnancy, patients on insulin or any other drugs that would affect glucose homeostasis, smokers’ and alcoholism patients were excluded from the study. This study was established in AL-Emamain AL-Kadhemain Medical City and Diabetes Disease center in Baghdad during the period between October 2020 till September 2021.
Blood sample collection
Five ml of venous blood from each subject were distributed into two tubes. The first 3ml was dispensed into a gel tube containing a clot activator, left at room temperature to clot for about (10) minutes, and then centrifuged for (10 min at 4000 rpm). In this study, the serum was isolated and utilized to assess glucose, cholesterol, and triglyceride. The residual serum was frozen at -20 °C till the quantified of TNFα in serum using a sandwich ELISA kit. The other 2ml was transmitted to the ethylenediaminetetraacetic Acid tube (EDTA) for routine work glycated Hemoglobin assessment.
HbA1C, cholesterol, TG, CRP
The healthy subjects and patients were investigated for the following parameters: hemoglobin A1c, fasting blood sugar FBS, TG, cholesterol, CRP was measured by Cobas c111 system. A ready commercial Kit Mybio-source Catalog No: MBS455676 / USA was used for the in vitro quantitative measurement of TNFa in human serum
Statistical analysis
To do statistical analysis, SPSS 20.0 and Microsoft Excel 2013 were used. The Shapiro-Wilk test was used to examine the normality of numerical data. The Mann–Whitney U test was employed to compare the median and 25-75 confidence intervals of the data for comparing two groups. Percentage of the total number of categories in the data set. The use of the chi-square test estimated the connection between variables. Below or equal to 0.05 is the minimum statistical significance level that may be acceptable.
RESULTS
The mean age of patients was 46.00± 10.42 years, and there was female predominance among patients; there were 52.0% females, while 48.0 % were males. There was no statistically significant difference between patients and the control group (p> 0.05) in age or sex present. According to the (BMI) The results in this study demonstrated a statistically significant difference in (BMI) between the studied groups (p ≤ 0.001).
Fasting Blood sugar and HbA1c
The results in table 3 illustrated a highly significant difference in median FBS and HbA1c among study groups (P ≤ 0.001).
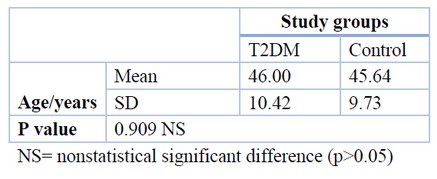
Table 1. The age distribution of study groups
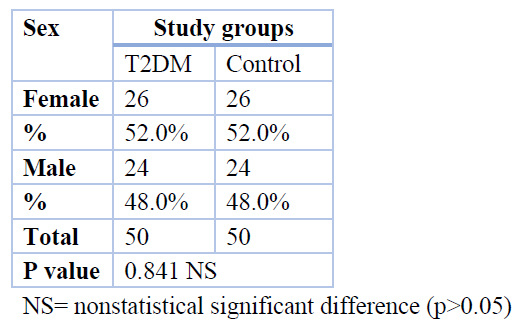
Table 2. Sex type distribution in T2DM patients and control.
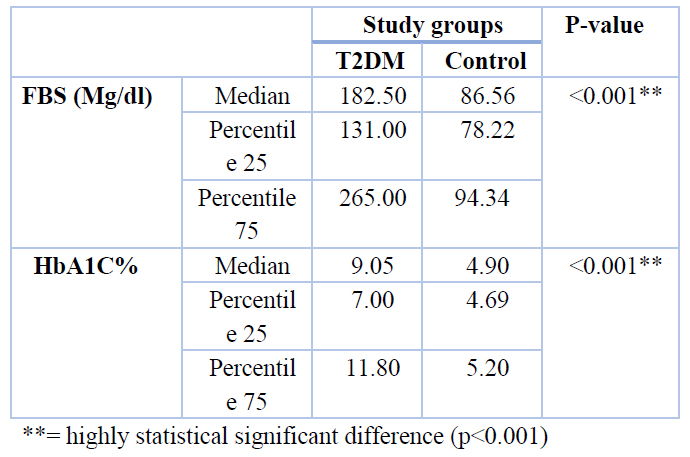
Table 3. Serum laboratory findings distribution in both T2DM patients and control
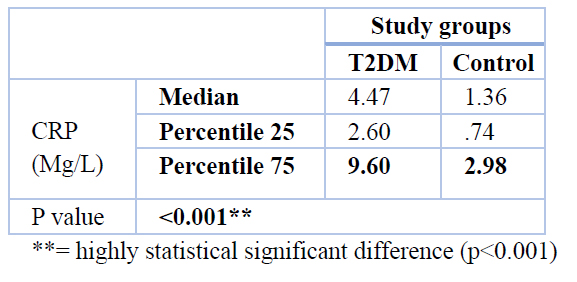
Regarding TG and cholesterol, LDL, AI with median value (177.50 Mg/dl), (200.00 Mg/dl), (137.00 Mg/dl) (0.64) respectively, was higher in T2DM than in control group (102.94 mg/dl), (164.69 Mg/dl), (94.99 Mg/dl), (0.30). with p-value =< 0.001, While the HDL results were shown that the median of patients' T2DM was lower than the control group (38.84, 51.18 Mg/dl) respectively, with p-value = < 0.001.(table 4). On the other hand, concerning CRP, the median value for T2DM was (4.47 Mg/L) higher than the median of the control group (1.36 Mg/L). So, there was a significant difference between the T2DM patients and control groups shown in table 5. Also, The current result revealed a higher concentration in the serum of patients TNFα compared with controls, as shown in Table 6.
The results of the current study concerning TNFα concentration between obese and non-obese patients showed a non-significant difference, as revealed in Table (7). Recent study results revealed a non-significant association between TNF alpha and HbA1C in patients with T2DM, as shown in Table 8.
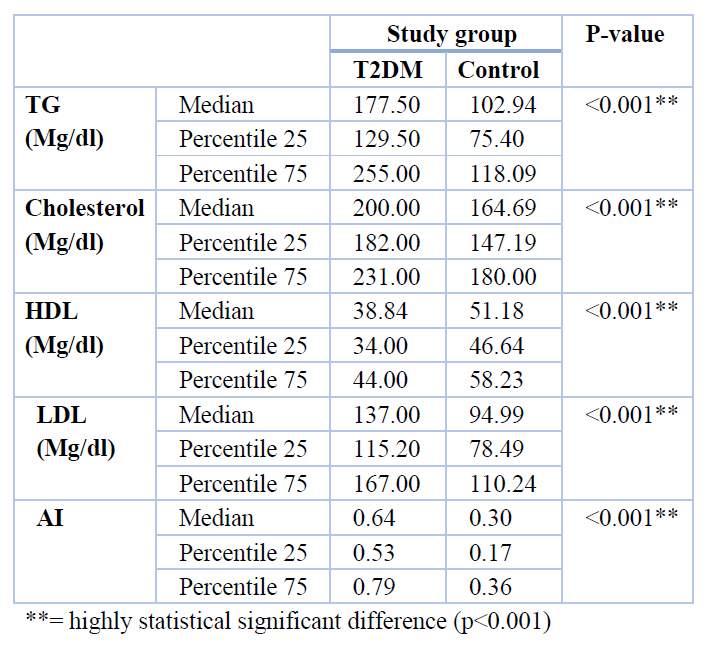
Table 4. Lipid profile and Atherogenic index distribution in T2DM and control groups
 highly statistical significant difference (p<0.001)
Table 5. CRP parameter distribution in T2DM and control group
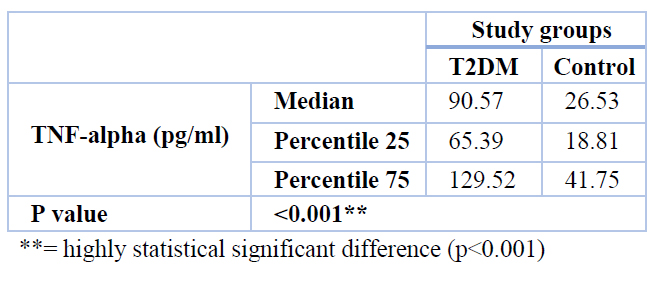
Table 6. The concentration of TNFα in T2DM and control group
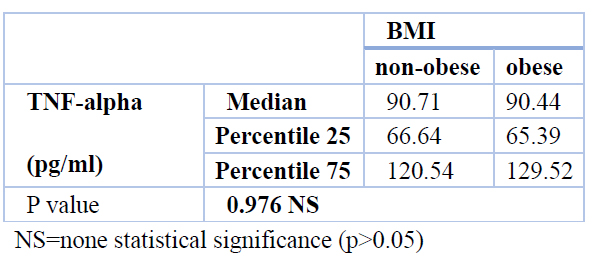
Table 7. The concentration of TNFα between obese and non-obese patients
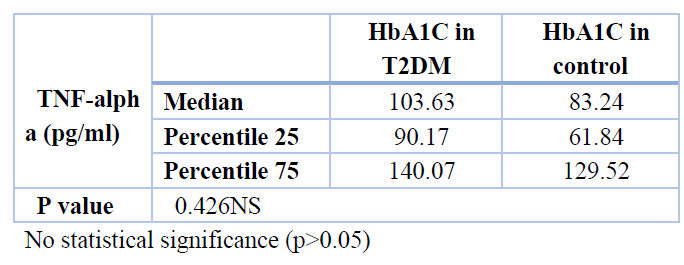
Table 8. Association between TNF-alpha and HbA1C in T2DM
Level of HbA1c, CRP, TNFα in obese and non-obese T2DM
According to the results demonstrated in Table (9), there was no statistically significant difference between obese and non-obese regarding HbA1c, and TNFα in patients with T2DM, except CRP. There was a statistically significant difference between obese and non-obese T2DM with a p-value (0.020). Also, this study revealed no statistically significant correlation between TNFα and group of demographic and laboratory findings (Age, BMI, FBS, HbA1c, Lipid profile, AIP and CRP) as in Table 10.
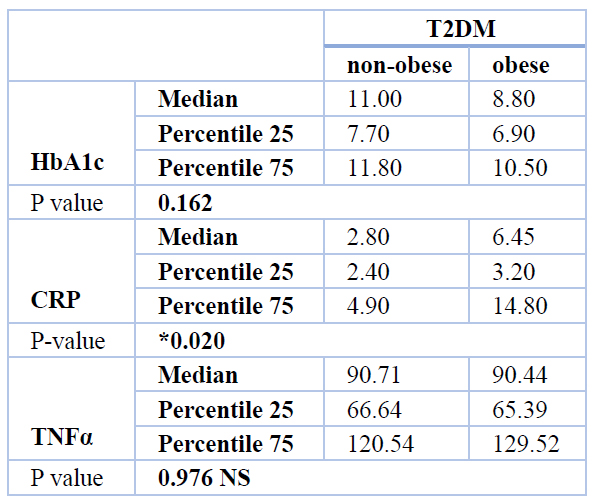
Table 9. Level of HbA1c, CRP, TNFα in obese and non-obese T2DM
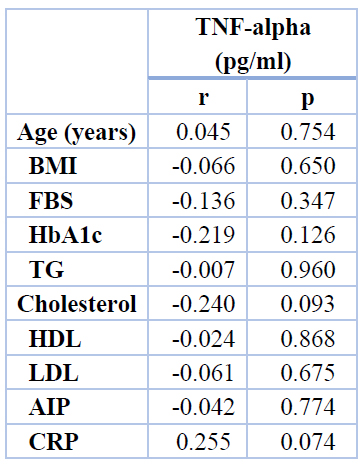
Table 10. Correlation of TNFα with demographic and laboratory findings among the studied groups
DISCUSSION
This study revealed a significant difference in TG levels between T2DM patients and control groups, similar to research 11that established a link between high TG and type 2 diabetes. There is a significant difference in cholesterol levels between the patients and the control group. This is consistent with the findings 12, which showed that diabetes individuals had considerably greater CHO levels than non-diabetic individuals. The present results on TG and Cholesterol levels disprove those of other studies 13, which found no significant difference between T2DM and healthy controls. The rise in cholesterol levels appears to be due to increased cholesterol synthesis due to a lack of control or poor management of hyperglycemia, which returns to standard or near-normal following adequate and suitable diabetic control14, 15. In concerning to LDL and HDL current study revealed a significant difference in LDL levels of T2DM compared to healthy control subjects. Even though newly diagnosed diabetic patients show a significant decrease in high-density lipoprotein (HDL) compared to the healthy control group, this is consistent with a 16 study that found a significant difference (p<0.001) in the newly diagnosed diabetic group as compared to healthy control group regarding LDL and a negative correlation of T2DM with the control group in HDL Present study revealed a significant difference between the T2DM in compared to control groups regarding AI and this agrees with 17 studies which shown also AI in T2DM group was significantly higher than in the healthy control group. Study16 reported a significant increase in levels AI in T2DM compared to the control group. AI is a good predictor and indicator for follow-up monitoring in managing patients with high-risk type 2 diabetes because it is a clinically convenient indicator for detecting T2DM with a high risk of complications and related disorders18. Sugar, cholesterol, and triacylglycerol levels were more elevated in patients with type 2 diabetes than those with normal blood sugar levels and lower serum levels of high-density lipoprotein cholesterol compared to those without type 2 diabetes. Diabetic people are more prone than non-diabetic patients to develop dyslipidemia, a key risk factor for atherosclerosis and coronary heart disease19. This study found that the CRP concentration was substantially more significant in the newly diagnosed T2DM group than in the healthy control group. This finding is consistent with research 20, which found that the serum CRP concentration was significantly higher in the IGT and type 2 DM groups (p 0.001). Some researchers believe that type 2 diabetes is a symptom of a persistent acute-phase response defined by changes in the levels of so-called acute-phase proteins, such as the inflammatory protein C-reactive protein (CRP) 21,22 Furthermore, according to the findings of the current investigation, the blood TNF- level was considerably greater in newly diagnosed T2DM patients. Compared to obese non-diabetic patients and non-obese diabetic patients, there was no significant difference in TNF- α levels between obese diabetic patients and obese non-diabetic healthy subjects. Study 10 did not confirm this association.
In this current study, the absence of correlation concerning TNF α concentration in obese and non-obese diabetic patients could be related to the duration of the disease. All patients present in the study were selected orderly as newly diagnosed T2DM. Most of the diabetic patients in this study didn’t have a BMI greater than 30kg. Could be linked to the small sample size of obese patients in the current study. Furthermore, neither the waist-to-hip ratio nor the quantity of visceral fat was measured in this research. The inability to find any link between BMI and serum TNF- α may also be explained by several sources of circulating TNF- α and the failure to account for the independent impacts of obesity and diabetes. Multiple studies have shown that blood TNF levels were linked with abdominal obesity23 or visceral fat24, but not with subcutaneous fat or BMI. These findings are consistent with previous findings.
Additionally, TNF- α is produced and released by muscle25 and lymphocytes and macrophages 26. It has been proven in vitro 25 People with insulin resistance, and type 2 diabetes have higher levels of TNF- α in their muscles. Also, the generation of TNF- α by monocytes and macrophages is boosted by hyperglycemia27 and hyperinsulinemia28. TNF- α levels seem to rise with aging in certain studies29. However, It was shown that even after adjusting for age, the diabetic group’s TNF-a concentration increased. Meta-analysis of 19 studies shows that elevated TNF- levels are strongly associated with an increased risk of developing Type 2 Diabetes Mellitus (T2DM) 30. TNF- α is a crucial modulator of inflammatory responses.
The role of cytokines in promoting the production of acute-phase proteins is well-known. Increases in inflammatory biomarkers are a result of both obesity and hyperglycemia. After neutralizing TNF- α, obese rats showed increased glucose absorption in the peripheral bloodstream, indicating that TNF- α plays a critical role in developing insulin resistance and diabetes 31. TNF- α has previously been linked to insulin resistance and type 2 diabetes (T2DM) associated with obesity32,33; however, another investigation did not support this link34. The current study demonstrated no significant association between TNFα and HbA1C in T2DM. The duration of the diseases could cause this, the limited sample size or some of those patients had insulin sensitivity. High levels of inflammatory cytokines that emerged in the early stages of T2DM could predict the development of type 2 diabetes by lowering insulin sensitivity 35. Current findings contribute to a more significant number of studies indicating that certain inflammatory factors play a vital role in the pathophysiology of T2DM. They also provide insights on the potential clinical utility of certain inflammatory factors as biomarkers for early T2DM detection and treatments36. According to another study, people with diabetes were shown to have considerably raised levels of TNF-α, which was most pronounced in those with HbA1c values of more than 6.5 % 37. In this study, HbA1c levels were not linked to TNF- α in this group of T2DM patients, whose mean HbA1c was 9.49%. Because the glycation rate and the turnover of erythrocytes aren’t directly related to blood glucose levels, the amount of HbA1c might fluctuate for reasons unrelated to blood glucose levels 37. The negative relationship between TNFα levels and insulin sensitivity in persons with Normal Glucose Tolerance (NGT) and Impaired Glucose Tolerance (IGT) or prediabetics, regardless of age, sex or obesity, supports circulating TNFα playing a role in insulin action control 15. Activated macrophages and lymphocytes were observed to produce and release tumor necrosis factor 26 because type 2 diabetes is thought to result from a constant state of inflammation 38. A soluble TNF receptor-IgG fusion protein has been shown to promote insulin-stimulated autophosphorylation of insulin receptor and insulin receptor substrate-1 in muscle and fat, supporting this hypothesis 39. Similarly, Obesity-induced suppression of TNF - α activity by an adenovirus vector with impaired replication By increasing insulin receptor signaling, the Zucker rat enhances hepatic and muscular sensitivity 40,23. Neutralizing circulating TNF- α levels did not improve glycemic control or insulin sensitivity in obese, insulin-resistant diabetic and non-diabetic adults.
CONCLUSION
TNF- produced by fat cells and macrophages/lymphocytes may have interfered with the paracrine effects of TNF- neutralizing antibodies on the local level.
Funding: “Author funded this research
Informed Consent Statement:
Al-Nahrain University’s College of Medicine’s ethics committee authorized this research. All samples were taken with informed permission to comply with the Al-Imamain Al-Kadimain Medical City’s policies on informed consent and informed consent forms.
Acknowledgments: The authors would like to extend thanks and gratitude to all who support us in completing this project.
Author conflict: No conflict
REFERENCES
1. Skyler JS, Bakris GL, Bonifacio E, Darsow T, Eckel RH, Groop L, et al. Differentiation of diabetes by pathophysiology, natural history, and prognosis. Vol. 66, Diabetes. Diabetes; 2017. p. 241–55.
2. Wiviott SD, Raz I, Bonaca MP, Mosenzon O, Kato ET, Cahn A, et al. Dapagliflozin and Cardiovascular Outcomes in Type 2 Diabetes. N Engl J Med. 2019 Jan 24;380(4):347–57.
3. Adeghate E, Schattner P, Dunn E. An update on the etiology and epidemiology of diabetes mellitus. In: Annals of the New York Academy of Sciences. Ann N Y Acad Sci; 2006. p. 1–29.
4. Zheng Y, Ley SH, Hu FB. Global aetiology and epidemiology of type 2 diabetes mellitus and its complications. Vol. 14, Nature Reviews Endocrinology. Nat Rev Endocrinol; 2018. p. 88–98.
5. 2. Classification and diagnosis of diabetes: Standards of medical care in diabetes-2021. Diabetes Care. 2021 Jan 1;44:S15–33.
6. Association AD. Classification and diagnosis of diabetes: Standards of Medical Care in Diabetes-2020. Diabetes Care. 2020 Jan 1;43(Supplement 1):S14–31.
7. Introduction. Vol. 39, Diabetes Care. American Diabetes Association; 2016. p. S1–2.
8. Akash MSH, Rehman K, Liaqat A. Tumor Necrosis Factor-Alpha: Role in Development of Insulin Resistance and Pathogenesis of Type 2 Diabetes Mellitus. J Cell Biochem. 2018 Jan 1;119(1):105–10.
9. Akash MSH, Rehman K, Liaqat A. Tumor Necrosis Factor-Alpha: Role in Development of Insulin Resistance and Pathogenesis of Type 2 Diabetes Mellitus. J Cell Biochem. 2018 Jan 1;119(1):105–10.
10. Alzamil H. Elevated Serum TNF-α Is Related to Obesity in Type 2 Diabetes Mellitus and Is Associated with Glycemic Control and Insulin Resistance. J Obes. 2020;2020.
11. Dave M, Gupta AK, Patel P, Heernath H. Correlation between Fasting Blood Sugar Level, HbA1C Level and Serum Lipid Levels in Type 2 Diabetes Mellitus Patients. Int J Contemp Med Res [IJCMR]. 2019;6(7).
12. Sabahelkhier MK, Awadllah MA, Mohammed Idrees AS, Abel Rahheem Mohammed AA-G, Idris MAR. A study of lipid profile Levels of Type II Diabetes Mellitus. Nov J Med Biol Sci. 2016;5(2).
13. Kamel N, Ayoub N, Ibrahim R, Ghalwash A, Khalaf N. Clinical significance of microRNA 126 in diabetic retinopathy in type 2 diabetes mellitus. J Recent Adv Med. 2020;1(2):128–35.
14. Simonen PP, Gylling HK, Miettinen TA. Diabetes Contributes to Cholesterol Metabolism Regardless of Obesity. Diabetes Care. 2002 Sep 1;25(9):1511–5.
15. Association AD. Nutrition Recommendations and Interventions for Diabetes. Diabetes Care. 2008 Jan 1;31(Supplement 1):S61–78.
16. Mohammed SK, Taha EM, Muhi A. PENTRAXIN3 AND NITRIC OXIDE-ASSOCIATED WITH AN ATHEROGENIC INDEX AND TYPE II DIABETES MELLITUS. 2020;23:4.
17. Song P, Xu L, Xu J, Zhang H, Yu C, Guan Q, et al. Atherogenic Index of Plasma is Associated with Body Fat Level in Type 2 Diabetes Mellitus Patients. Curr Vasc Pharmacol. 2018 Jan 4;16(6):589–95.
18. Li Z, Huang Q, Sun L, Bao T, Dai Z. Atherogenic index in type 2 diabetes and its relationship with chronic microvascular complications. Int J Endocrinol. 2018;2018.
19. Biadgo B, Abebe SM, Baynes HW, Yesuf M, Alemu A, Abebe M. Correlation between Serum Lipid Profile with Anthropometric and Clinical Variables in Patients with Type 2 Diabetes Mellitus. Ethiop J Health Sci. 2017 May 1;27(3):215–26.
20. Yuan G, Zhou L, Tang J, Yang Y, Gu W, Li F, et al. Serum CRP levels are equally elevated in newly diagnosed type 2 diabetes and impaired glucose tolerance and related to adiponectin levels and insulin sensitivity. Diabetes Res Clin Pract. 2006 Jun;72(3):244–50.
21. Pickup JC, Mattock MB, Chusney GD, Burt D. NIDDM as a disease of the innate immune system: association of acute-phase reactants and interleukin-6 with metabolic syndrome X. Diabetologia. 1997 Nov;40(11):1286–92.
22. Pickup JC, Crook MA. Is type II diabetes mellitus a disease of the innate immune system? Vol. 41, Diabetologia. Diabetologia; 1998. p. 1241–8.
23. Kolls J, Peppel K, Silva M, Beutler B. Prolonged and effective blockade of tumor necrosis factor activity through adenovirus-mediated gene transfer. Proc Natl Acad Sci U S A. 1994 Jan 4;91(1):215–9.
24. Katsuki A, Sumida Y, Murashima S, Murata K, Takarada Y, Ito K, et al. Serum Levels of Tumor Necrosis Factor-α Are Increased in Obese Patients with Noninsulin-Dependent Diabetes Mellitus 1 . J Clin Endocrinol Metab. 1998 Mar 1;83(3):859–62.
25. Saghizadeh M, Ong JM, Garvey WT, Henry RR, Kern PA. The expression of TNFα by human muscle: Relationship to insulin resistance. J Clin Invest. 1996 Feb 15;97(4):1111–6.
26. Uysal KT, Wiesbrock SM, Marino MW, Hotamisligil GS. Protection from obesity-induced insulin resistance in mice lacking TNF- α function. Nature. 1997;389(6651):610–4.
27. Morohoshi M, Fujisawa K, Uchimuraa I, Numano F. Glucose-Dependent Interleukin 6 and Tumor Necrosis Factor Production by Human Peripheral Blood Monocytes In Vitro. Diabetes. 1996 Jul 1;45(7):954–9.
28. Tada Iida K, Shimano H, Kawakami Y, Sone H, Toyoshima H, Suzuki S, et al. Insulin Up-regulates Tumor Necrosis Factor-α Production in Macrophages through an Extracellular-regulated Kinase-dependent Pathway. J Biol Chem. 2001 Aug 31;276(35):32531–7.
29. Hae Young Chung, Hyon Jeen Kim, Jung Won Kim, Byung Pal Yu. The inflammation hypothesis of aging: Molecular modulation by calorie restriction. In: Annals of the New York Academy of Sciences. New York Academy of Sciences; 2001. p. 327–35.
30. Liu C, Feng X, Li Q, Wang Y, Li Q, Hua M. Adiponectin, TNF-α and inflammatory cytokines and risk of type 2 diabetes: A systematic review and meta-analysis. Cytokine. 2016 Oct 1;86:100–9.
31. Hotamisligil GS, Shargill NS, Spiegelman BM. Adipose expression of tumor necrosis factor-α: Direct role in obesity-linked insulin resistance. Science (80- ). 1993;259(5091):87–91.
32. Katsuki A, Sumida Y, Murashima S, Murata K, Takarada Y, Ito K, et al. Serum Levels of Tumor Necrosis Factor-α Are Increased in Obese Patients with Noninsulin-Dependent Diabetes Mellitus 1 . J Clin Endocrinol Metab. 1998 Mar;83(3):859–62.
33. Jaganathan R, Ravindran R, Dhanasekaran S. Emerging Role of Adipocytokines in Type 2 Diabetes as Mediators of Insulin Resistance and Cardiovascular Disease. Vol. 42, Canadian Journal of Diabetes. Elsevier BV; 2018. p. 446-456.e1.
34. Miyazaki Y, Pipek R, Mandarino LJ, DeFronzo RA. Tumor necrosis factor α and insulin resistance in obese type 2 diabetic patients. Int J Obes. 2003 Jan 1;27(1):88–94.
35. Schmidt MI, Duncan BB, Sharrett AR, Lindberg G, Savage PJ, Offenbacher S, et al. Markers of inflammation and prediction of diabetes mellitus in adults (Atherosclerosis Risk in Communities study): A cohort study. Lancet. 1999 May 15;353(9165):1649–52.
36. Al-Shukaili A, Al-Ghafri S, Al-Marhoobi S, Al-Abri S, Al-Lawati J, Al-Maskari M. Analysis of inflammatory mediators in type 2 diabetes patients. Int J Endocrinol. 2013;2013.
37. Mirza S, Hossain M, Mathews C, Martinez P, Pino P, Gay JL, et al. Type 2-diabetes is associated with elevated levels of TNF-alpha, IL-6 and adiponectin and low levels of leptin in a population of Mexican Americans: A cross-sectional study. Cytokine. 2012 Jan;57(1):136–42.
38. Pickup JC, Mattock MB, Chusney GD, Burt D. NIDDM as a disease of the innate immune system: association of acute-phase reactants and interleukin-6 with metabolic syndrome X. Diabetologia. 1997 Nov;40(11):1286–92.
39. Hotamisligil GS, Budavari A, Murray D, Spiegelman BM. Reduced tyrosine kinase activity of the insulin receptor in obesity- diabetes. Central role of tumor necrosis factor-α. J Clin Invest. 1994 Oct 1;94(4):1543–9.
40. Cheung AT, Ree D, Kolls JK, Fuselier J, Coy DH, Bryer-Ash M. An in vivo model for elucidation of the mechanism of tumor necrosis factor-α (TNF-α)-induced insulin resistance: Evidence for differential regulation of insulin signaling by TNF-α. Endocrinology. 1998 Dec 1;139(12):4928–35.
41. Mohamed-Ali V, Goodrick S, Rawesh A, Katz DR, Miles JM, Yudkin JS, et al. Subcutaneous adipose tissue releases interleukin-6, but not tumor necrosis factor-α, in vivo. J Clin Endocrinol Metab. 1997;82(12):4196–200.
Received: 18 December 2021 / Accepted: 28 February 2022 / Published:15 May 2022
Saeed Majeed H M; Abdul-Hassan Abbas A; Shakir Khudair M . The role of TNFα in type2 diabetes mellitus. Revis Bionatura 2022;7(2) 32. http://dx.doi.org/10.21931/RB/2022.07.02.32