2023.08.04.34
Files > Volume 8 > Vol 8 no 4 2023

Tania Peña-Paz 1, 2, Maria Elisa Ortiz3 , Manuel Rodriguez4, Pedro Enrique Ortiz5*
1 Experimental and Innovation Center for Water Resources of the Honduran Institute of Earth Sciences/ Universidad Nacional Autónoma de Honduras/Tegucigalpa/Honduras; [email protected].
2 PhD in Water and Development, University Institute of Water and Environmental Sciences, Universidad de Alicante/Spain [email protected]
3 Master's Degree in Water Resources with a Focus on Hydrogeology/ Universidad Nacional Autónoma de Honduras/Tegucigalpa/Honduras; [email protected]
4 Honduran Institute of Earth Sciences/ Universidad Nacional Autónoma de Honduras/Tegucigalpa/Honduras; [email protected].
5 Servicio Autónomo Nacional de Acueductos y Alcantarillado, SANAA; [email protected]
6 *Corresponding author: Email: [email protected]
7 Available from: http://dx.doi.org/10.21931/RB/2023.08.04.34
ABSTRACT
This research, led by the IHCIT in collaboration with the ADAPTARC project of SERNA/UNDP, forms a crucial part of the author's doctoral and master's thesis. Focusing on the Rio Chiquito sub-basin in Tegucigalpa, the capital of Honduras, it aims to offer a preliminary insight into the dynamics of the isophreatic curves as a technical tool for decision-makers. Despite its relatively small size, this sub-basin features a dramatic elevation change, ranging from 950 - 2200 meters above sea level over a 21km river length and with 30% urbanization.
The study involved meticulous information management of over 100 wells, primarily used for human consumption, highlighting the community's dependence on groundwater. Given the intermittent and insufficient municipal water supply, this was especially critical, emphasizing groundwater's role in meeting basic needs and public health. The findings reveal underground water levels varying between 5 to 20 meters on average, with peaks up to 60 meters in the subbasin's lower western area. This underground flow aligns with the sub-basin geomorphology and surface dynamics, showing a gradient from 950 to 1200 meters in the middle-lower part, ascending to 2200 meters in the middle-upper region.
Keywords: water table, aquifer, groundwater, sub-basin,
INTRODUCTION
Groundwater and urbanization are intimately linked 1. The demand for water in urban centers is vital to their development, where traditional capture systems through dams are not enough, and groundwater exploitation is increasingly enhanced. These population densities increase demand and the processes of contamination of surface waters, given the increase in treatment costs. Furthermore, costs given this global trend have been facilitated by the reduction (and generally modest) in the cost of good construction2.
Honduras, specifically its capital Tegucigalpa, located in the Central District Municipality with over 1,300,000 inhabitants, with a density of 883.3 inhabitants/km² and with 1,199,136 inhabitants3 living in its urban area, gets its supply from the public service of its City Hall to the municipality through 5 primary sources. 99% comes from the surface exploitation of the sub-basins of San José (Concepción and Miraflores), Guacerique (Laureles), and Río Chiquito/Choluteca Alta (Picacho System). These sources, in turn, go through a treatment system to be distributed by large tanks for storage and subsequent distribution by gravity to the different neighborhoods and suburbs of the MDC4. This supply system is not continuous, so the various sectors (residential, commercial, and industrial) have had to resort to groundwater exploitation through wells located and built according to their demand needs. Given the dynamics of city development with more technologies such as washing machines, showers, and bathtubs, this also means a higher water consumption per person. 5 6
The above prioritizes the research of underground water environments, especially to have proper surveillance and monitoring of these levels to prevent intensive exploitation, given the density of wells in the urban environment. Furthermore, groundwater exploitation does not guarantee its suitability for human use. Geological environments impacted by anthropogenic activities can compromise this quality. This poses a risk to populations relying on this resource without adequate prior treatment. This issue has been evident throughout the Choluteca River basin, where serious contamination processes have been observed in both surface and groundwater. The construction of isophreatic curves is one of the main tools for integrated groundwater management 7. Having this type of tool allows water managers to determine several things: The intrinsic vulnerability of aquifers to pollution8, the phreatic dynamics due to the effects of exploitation, or changes in water dynamics due to the effects of climate change (the effects of climate change considering that impacts are already observed in the frequency of extreme precipitation in these urban and peri-urban environments is increasing 9), among others.
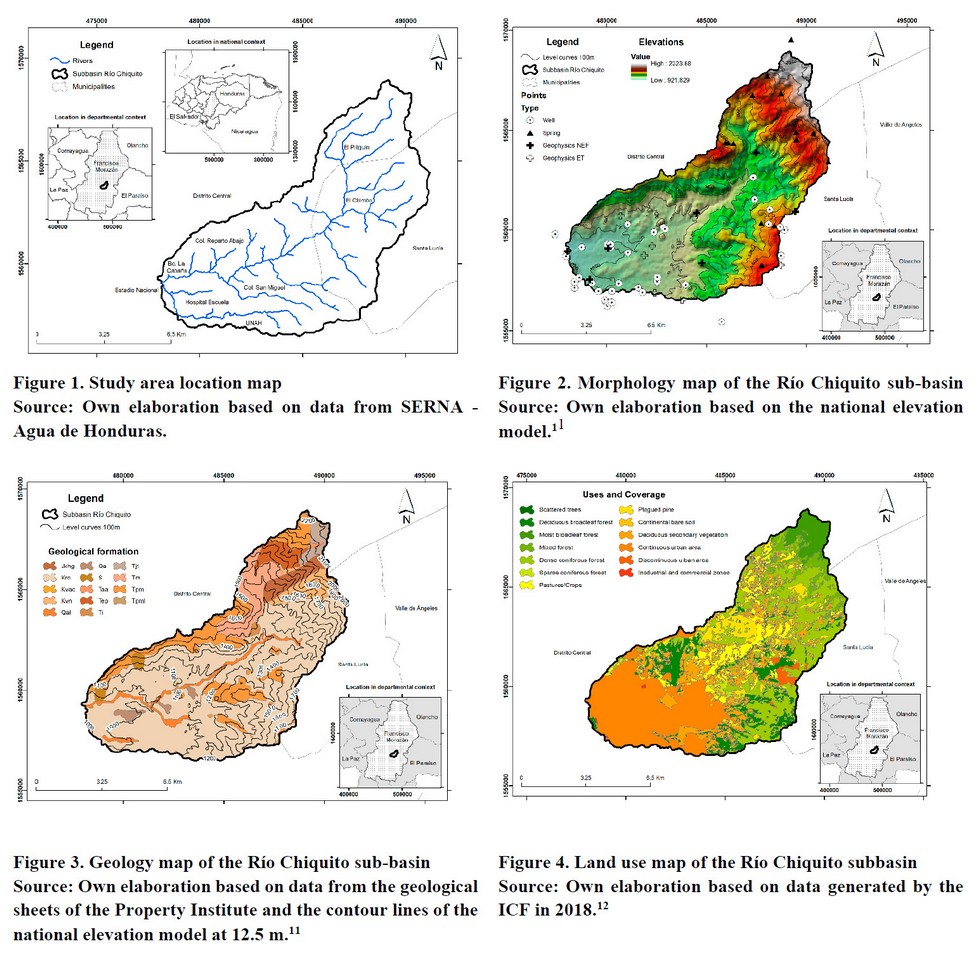
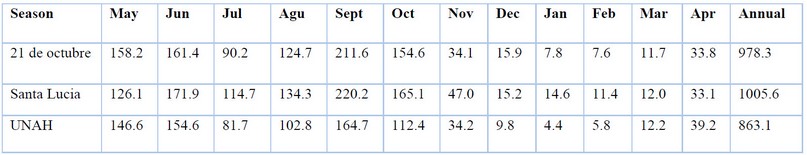
This research focused on constructing the isophreatic curves for the sub-basin of the Rio Chiquito, located within the municipality of the Central District and its northeastern part in Santa Lucia (see Figure 1). The sub-basin covers an approximate area of 71.66 km² and features a dramatic elevation range from 2288 meters above sea level to 937 meters in its lower part (see Figure 2). This results in an average slope of 32.7% for the sub-basins, marking it as the steepest within the sub-basins of the upper part of the Rio Choluteca basin.
The primary objective of this study was to construct isophreatic curves, a crucial step toward understanding the dynamics of groundwater flow in the region. By accurately delineating these curves, we can better assess the availability and sustainability of groundwater resources, which are vital for human consumption and health. This knowledge becomes particularly valuable in regions with intermittent or inadequate public water supply, such as the Rio Chiquito sub-basin. It enables informed decision-making for water resource management, ensuring the local population can access safe and reliable groundwater, thereby significantly contributing to public health and well-being.
This dynamic of elevations is also reflected in the surface runoff (channel length of 21.06km) where there are minor streams that contribute to the river flow, among these: the Quebradas La Mololoa, de las Burras, and la Orejona, among others, which together form the Rio Chiquito, which crosses the city of Tegucigalpa, where it joins the Rio Choluteca in its lower part. In the underground context, springs are located in their upper parts and are used by communities and the public service (AMDC through a catchment system known as the Picacho System4).
Study Area
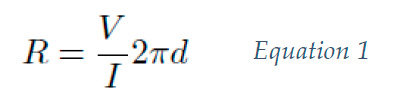
The Rio Chiquito sub-basin is generally made up of the Valle de Angeles Group, where the Rio Chiquito formation consists typically of red layers distinguished from the Villa Nueva Formation by their fine texture. These strata contain shales, limonites, sandstones, and some layers of quartz conglomerate, but the clastics are fine-grained, and the color is dark pink-purple. There are also some thin strata of andesite like the one found in the cut by the new road between Santa Lucia and El Eden (see Figure 3). Near Chimbo is a thin outcrop of gray limestone within the Rio Chiquito Formation. Some sedimentary structures mainly include flat stratifications with few crossed stratifications and graduated layers, as well as gypsum veins located in the La Bolsa neighborhood, and this mineral was reported in the layers of the Valle de Angeles Group by Finch (1972, 1981) in the central zone of Honduras.13 14
In the upper part of the sub-basin, the Padre Miguel Formation is represented in the study area by the presence of a volcanic-clastic sequence formed by silicified pyroclastic rocks; ignimbrites, tuffs, and agglomerates, mainly of rhyolitic and andesitic composition, and rhyolites, with different degrees of compaction. The following lithological units were identified.15
This geology leaves in the sub-basin Chimbo soils that are moderately deep, moderately well-drained, with medium and fine textures, with slopes greater than 15%, as well as soils of the Valles and Epariguat Soils, which are relatively deep soils, between moderately and excessively drained, of moderately fine textures with more than 40% quartz gravel. Morphologically, they are rounded hills with slopes greater than 30%, with strongly undulating to steep relief.16
Due to the urban environment, land use in the sub-basin leaves almost 30% of the area as a continuous or discontinuous urban zone. The agricultural issue is less, with 10% of the area and 60% of different types of forests: coniferous, broadleaf, mixed, and pine, whether dense or sparse (see figure 4) (12). The importance of this forest in terms of water is worth mentioning, as it is the primary recharge area for the sub-basin.17
From the climatological data of the sub-basin, there are average annual values between 870 - 1000mm, with the rainiest period being May - June and September - October, and the driest from November - April (see Table 1). The average annual temperature hovers around 22°C and the average annual relative humidity is between 71 - 83%.18
Source: Data from relevant Water Resources Assessment stations under their 2012 natural regime18
Table 1. Average monthly reception values of the stations within the subbasin
Regarding runoff, the required precipitation values are between 5 mm, meaning that any precipitation turns into runoff up to 90 mm. This indicates that this amount of rainfall needs to be exceeded to generate runoff. As expected, the months with the most runoff occur between September and October, with values that exceed 20 mm of runoff. On the contrary, during the dry months from January to March, there is a total absence of runoff.19
Data Management of Levels
The data required for constructing isophreatic curves come from obtaining the water table levels of the wells, whether drilled artisanally or from the elevations of the springs. With this objective, information generated in previous studies was collected. 10 20, as well as the census and measurement of the water table levels in new wells during the canícula (July and August 2019 - 2022), through field cards and a piezometric probe (Solinst 101 metric probe). For this measurement, it is required that the wells have what is necessary for the inspection, resulting in the main limitation for the study being the inspection of these where in these studies in the sub-basin more than 200 are located, of which only the data of 19 of these could be obtained and in 5 wells that the Groundwater Unit of the Autonomous National Service of Aqueducts and Sewerage had and where pumping tests had been carried out. Likewise, a census of the springs located within the sub-basin was carried out.
To complement the data on water table levels, research was carried out on tomographies and profiles by natural potential where the water table levels were determined. The methods used were:
· Electrical tomography
The electrical resistivity method involves applying a flow of electricity on the Earth's surface and then measuring the potential differences at specific points. This leads us to determine the distribution of resistivity on the surface and an interpretation of the subsurface materials. It is carried out by placing four electrodes aligned at equal distances from each other. A battery is connected to the outer electrodes, measuring the intensity that circulates between them and the voltage between the intermediate electrodes. The expression21 defines the resistivity:
Where R is the resistivity in ohm-m, V is the voltage, I is the intensity, and d is a factor of the distance between the electrodes, which varies depending on the electrodes' arrangement. The obtained resistivity value represents the average of a large soil volume since the current network extends in depth. To explore soil resistivity at different depths, this procedure is repeated with varying separations between electrodes to carry out what is known as a vertical electrical sounding or VES. Suppose this procedure is repeated with the electrodes at different separations and points. In that case, information can be obtained along a profile and in-depth to perform an electrical tomography22, a 2D model.
The data are collected using the TERRAMETER SAS 4000 electrical resistivity prospecting equipment from ABEM, which allows the connection of up to 40 electrodes. Cables are used with a maximum separation between electrodes of 5m. With this configuration, up to 200m can be covered on the surface per profile, and maximum depths of between 30m and 35m are reached, depending on the soil characteristics. The data are then stored on a computer using ABEM's proprietary communication software for later analysis in the laboratory.
· Natural Potential
The Natural Electric Field method or Natural Potential is a passive method of geophysical exploration based on the AMT methods studied since the 1970s.
The principle of the PQWT method is based on measuring the electric potential on the surface due to the components of the Earth's natural electromagnetic field in N different frequencies, considering planar waves that are approximately distributed perpendicular to the ground. The sources of waves are the effects of electrical storms or other disturbances that produce currents in the soil. These waves have frequencies ranging from 1Hz to 20 KHz, hence Audio MT.
The variations of the measured field can be related to abnormal changes in geological structures, the presence of solid rock, the presence of holes (Karst) in the subsoil, or the presence of groundwater, as it has been used in recent years.23 24.
The equipment used for the study is the PQWT model TC300 from the Chinese company Hunan Puqi Geologic Exploration Equipment Institute. The equipment can measure up to 56 frequencies, allowing for an exploration depth of up to 500m. After the data is collected, it is processed to generate a profile map that shows the potential values in (millivolts) as a function of depth, allowing for the quick determination of the location of mineralized bodies, aquifers, caves, or other geological structures.
Construction of the curves
For the construction of the isophreatic curves, the water table levels of the wells, the elevations of the springs, and the water levels evidenced in the tomographies and the natural potential profiles were taken. A mesh of points was created with their spatial location to proceed with an interpolation process using the Kriging method, defined as a method for the geostatistical analysis of data variation. This means that it analyzes the behavior of data in space by analyzing variograms. This method has been applied in mining, geology, and hydrology, as it is a flexible spatial interpolation method. For example, a practical application is for the design of sampling networks since Kriging is a method that can be used for data analysis in geohydrology28 29.
RESULTS
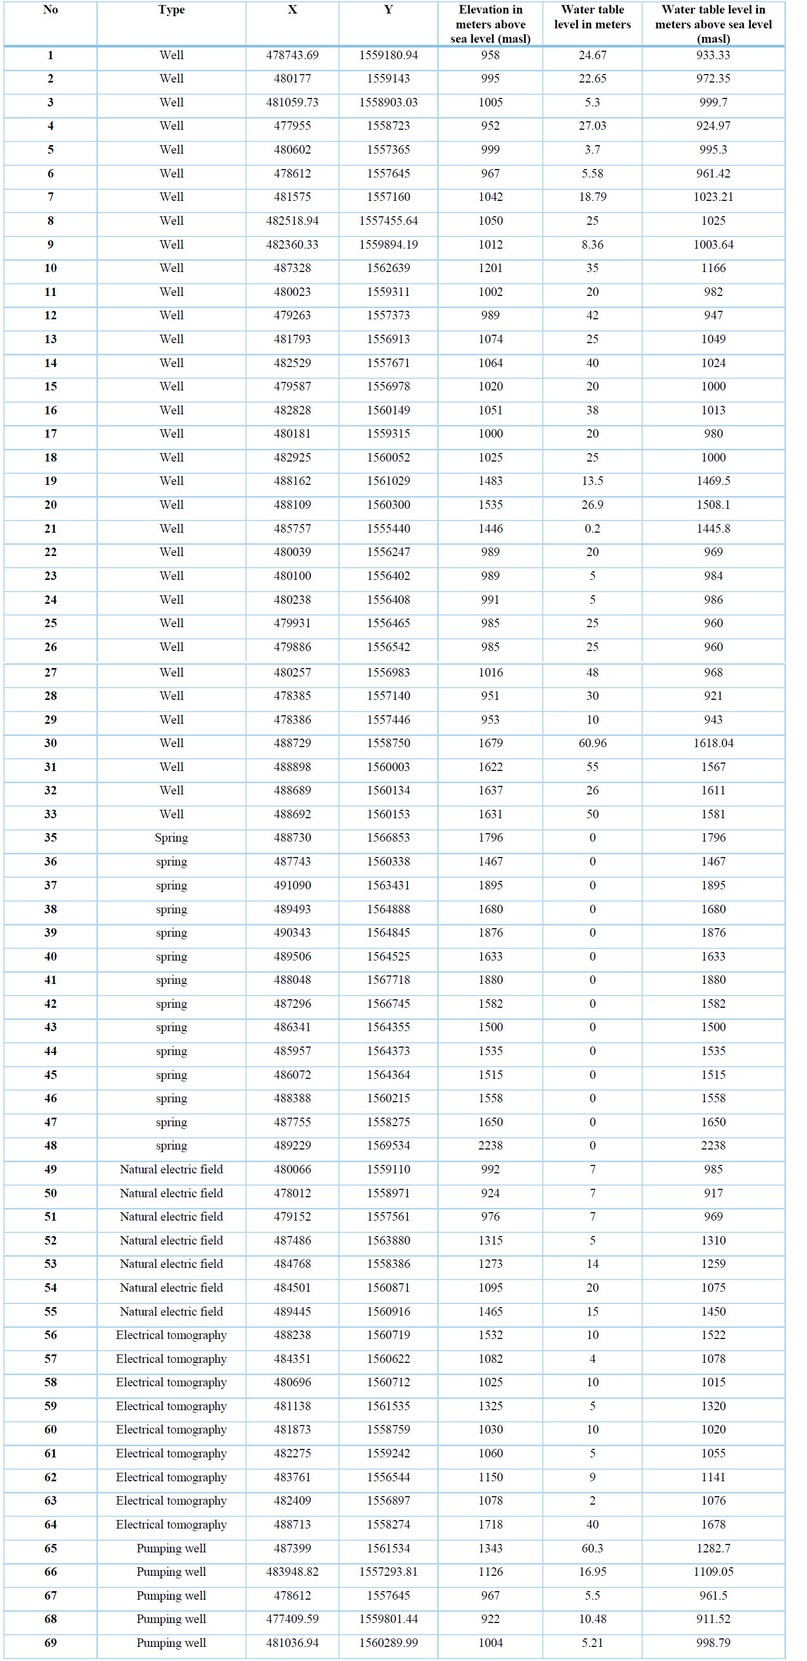
The management of information and well census led to having 38 wells for the area, the majority in the lower part of the sub-basin and towards the south; 14 springs in total in the upper part of the sub-basin. From the geophysical component, seven (7) profiles were made with natural potential, and nine (9) tomographies were located in the places where data were absent (see Figure 5 and Table 2 for results). Figure 6 shows the results of the geophysical profiles for determining the water table levels.
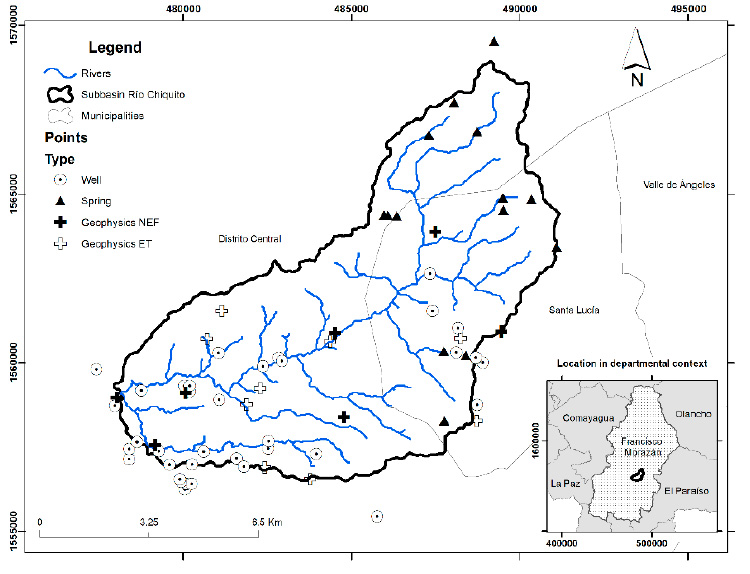
Figure 5. Location map of located wells and geophysical profiles
Source: Own elaboration from the generated data and water information of SERNA - Agua de Honduras.
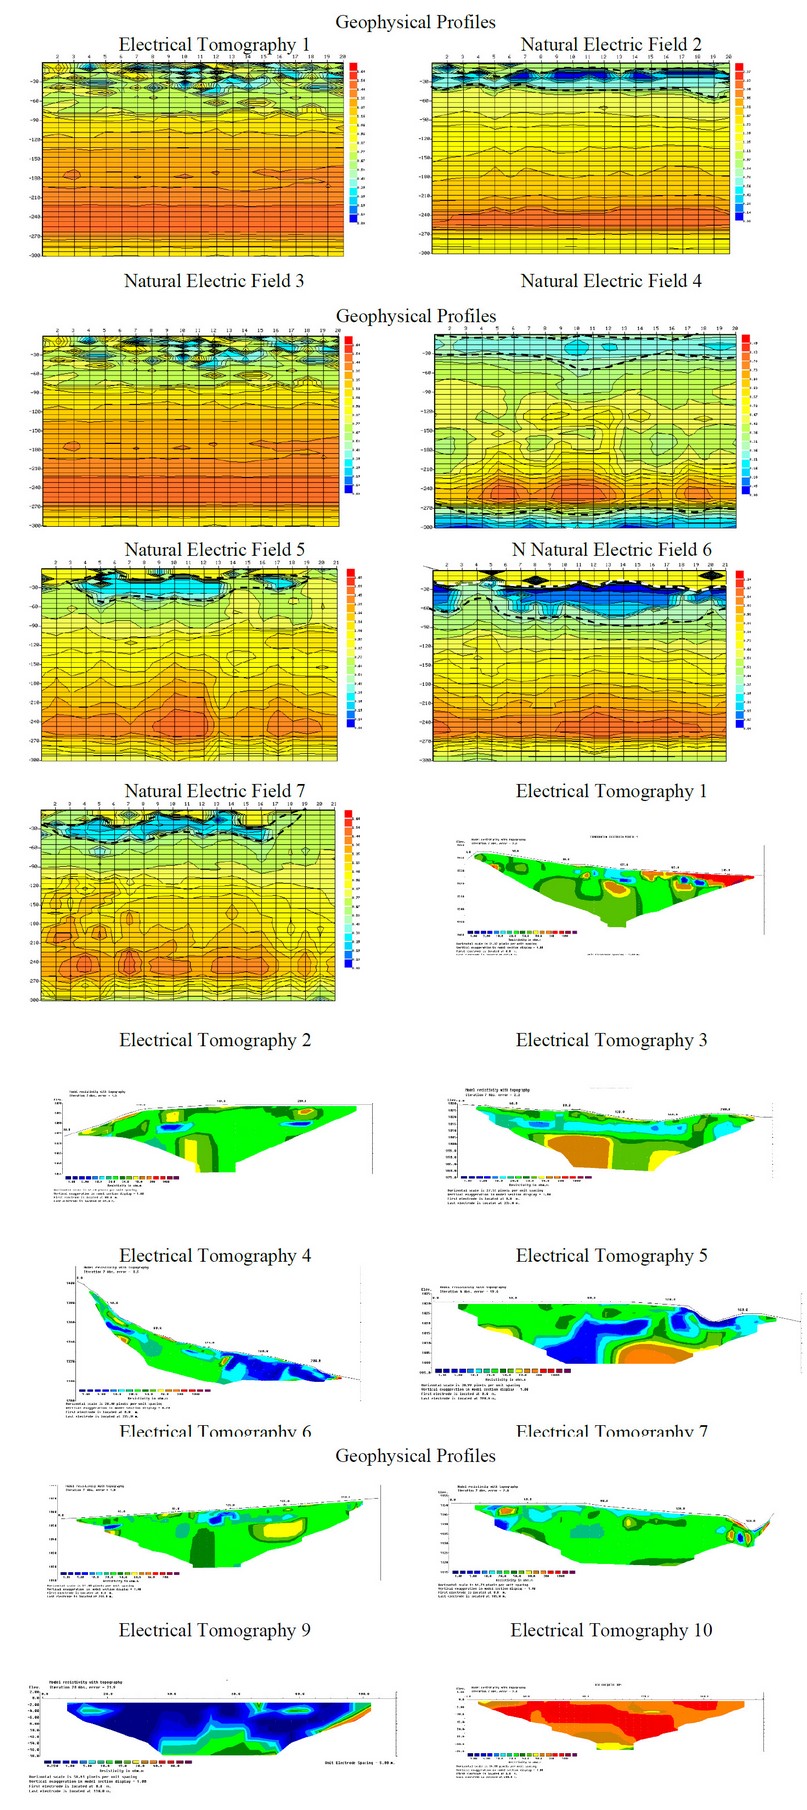
Figure 6. Geophysical profiles (Tomography and natural potential) determine water table levels.
Source: Own elaboration based on generated data.
Table 2. Data of the obtained water table levels.
The above, with the 69 points in the 71.66 km2, allows us to have a mesh of points to construct the isophreatic curves. After several interactions and geostatistical analysis, we build these curves every 50 meters, ranging from 0 - 61 meters, from elevation 950 to 2220 masl. From the lower-middle part, these elevations remain from 950 to 1200 masl; concerning the middle-high part, there is a jump from 1200 to 2200, consistent with the geomorphological context. The wells where the most profound levels were identified are in the lower part towards the southwest (see Figure 7). The direction of the flow is shown from east to west, from the upper part to the lower part of the basin.
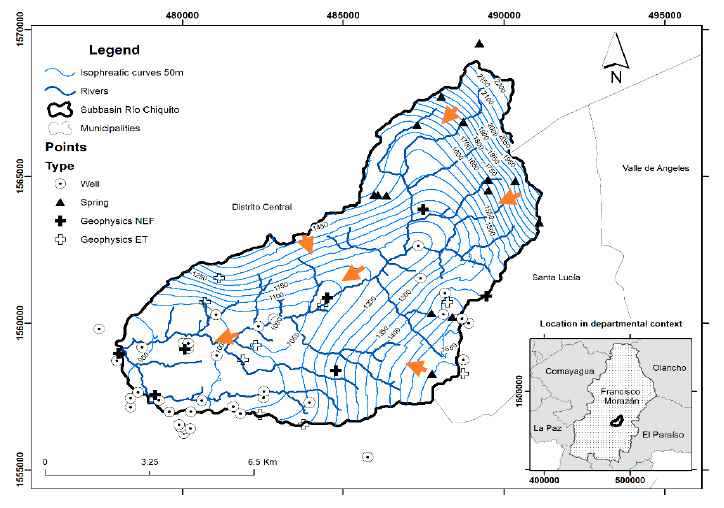
Figure 7. Map of isofreatic courses for the Río Chiquito sub-basin
Source: Own elaboration based on generated data and sub-basin from SERNA - Agua de Honduras.
The construction of the isophreatic curves for the Rio Chiquito sub-basin is a proposal constructed from the managed data from wells and geophysical methods. This work requires more data to strengthen the proposal; however, it can be used as a baseline for the hydrogeological study of the basin. Geomorphology plays a significant role in this dynamic, as the flow obeys the surface dynamic because 75% of the basin is a single formation (Rio Chiquito Formation) formed by data known from these wells by multilayer aquifers. The proposed curves obey this first aquifer given that the levels mainly fluctuate between 5 - 20 meters, except in the lower part of the sub-basin in the west area, where it deepens, given the rise in elevations due to the hills in this area.
These curves can also show the relationship between the Rio Chiquito and other runoffs in the sub-basin, even more so the aquifer's contributions to it. For this, it is recommended that the necessary tests be carried out to verify this relationship.
Another aspect to consider would be the depth of the wells. From the data obtained, we know that the depths of these wells are between 80 and 120 meters. No deeper wells were evident in the census for the sub-basin, so there is no data on the medium. However, this hydrogeological unit, which we suppose is composed of multilayer aquifers and from the data obtained in the profiles that were able to reach depths of 300 meters, shows us deeper aquifers between 200 - 250 meters, which can be part of the water reserves of this unit, especially in the lower part of the sub-basin.
The information from the geophysical profiles was crucial to constructing these curves, given that the way wells are constructed prevents their surveillance and monitoring; this information can be obtained with these profiles. Both methods worked for the objective of locating the water table level. The tomographies turned out to be more enlightening to identify this level.
The methods used for interpolation are essential for better construction of these tools. In addition, specialized software for hydrogeology allows a better construction of these, correlating with the geology. Therefore, developing these types of models should be done through specialized software.
CONCLUSIONS
The dynamics of the water table level are dominated by the geomorphology of the sub-basin for this upper aquifer, according to the data from the wells and the geophysical profiles, built from a network of 69 points, with values mostly between 5-20 meters of water table level. The maximum depth is 60 meters west of the sub-basin in its lower part.
The behavior of the isophreatic curves corresponds to the surface runoff, wherein the upper part, at least 14 springs are identified, these in the Padre Miguel formation and the wells located in the Rio Chiquito formation, both within the Valle de Angeles Group.
Municipal water managers and decision-makers need to establish measures to facilitate the recharge of this aquifer, given its importance in the city's dynamics and mainly due to the effects of land degradation that occurs in the sub-basin, increased by the impact of climate change.
PATENTS
Author Contributions: Conceptualization and methodology, Tania Peña-Paz; Geophysics, Manuel Rodriguez; Maps, data compilation, tables, and literature review, Maria Elisa Ortiz y Pedro Ortiz; Assistance for profiling, Félix Enrique Rodríguez García, Maynor Ruiz, Manuel Rodriguez and María E. Ortiz, writing—original draft preparation, Tania Peña-Paz, Research translated by: Andrea José Rosales Tamshiro and Jason Ariel Borjas Rodriguez
Funding: This research was funded by the Climate Change Adaptation Fund Project, "Ecosystem-based Adaptation in the Central Forest Corridor of Tegucigalpa," from the Secretariat of Natural Resources and Environment SERNA and the United Nations Development Programme UNDP. And with the support of the instrumental team of the Honduran Institute of Earth Sciences of Universidad Nacional Autonóma de Honduras.
Acknowledgments: To the ADAPTARC project for facilitating the resources for this research and its complement; to the Honduran Institute of Earth Sciences; to the management, water resources unit, meteorology, and geology for supporting the data. To the Groundwater Unit of SANAA for facilitating the data and providing logistical support. To Ph.D. Enric Suñe from the Institute of Environmental Assessment and Water Research (IDAEA), of the Spanish National Research Council (CSIC), Barcelona, Spain, and a Professor at the University of Alicante in Spain Ph.D. Nuria Boluda for their general contributions to water dynamics.
Conflicts of Interest: The authors declare no conflict of interest.
REFERENCES
1. Sustainable groundwater use for developing country urban populations: lessons from Brazil. Foster, S. and Hirata, R. 2012, Water, Vol. 21, pp. 44-48.
2. IAH, International Association of Hydrogeologists. Resilient Cities and Groundwater. International Association of Hydrogeologists. 2015.
- INE, Instituto Nacional de Estadistica. INE - Instituto Nacional de Estadisticas. ine.gob.hn. [Online] Febrero 20, 2022. https://www.ine.gob.hn/V3/baseine/.
- Lanza, Raul. On the sources of water that supply the MDC. [interv.] Tania Peña. 20 August, 2021.
- Water, sanitation and urban children: the need to go beyond "improved" provision. Bartlett, Sheridan. 2, 2003, Environment and Urbanization, Vol. 15, pp. 57-70.
- Water on an urban planet: Urbanization and the reach of urban water infrastructure. Robert I. McDonald, Katherine Weber, Julie Padowski, Martina Flörke, Christof Schneider, Pamela A. Green, Thomas Gleeson, Stephanie Eckman, Bernhard Lehner, Deborah Balk, Timothy Boucher, Günther Grill, Mark Montgomery. 2014, Global Environmental Change, Vol. 27, pp. 96-105.
- Llamas, Custodio &. Underground Hydrology. Second Edition. Barcelona, : Omega S.A., 2001. Vol. I.
- The aquifer pollution vulnerability concept: aid or impediment in promoting groundwater protection? Foster, Stephen, Hirata, Ricardo and Andreo, Bartolome. 7, 2013, Hidrogeology Journal, Vol. 21.
- Caretta, M.A., A. Mukherji, M. Arfanuzzaman, R.A. Betts, A. Gelfan, Y. Hirabayashi, T.K. Lissner, J. Liu, E. Lopez Gunn,. Water. In: Climate Change 2022: Impacts, Adaptation and Vulnerability. Contribution of Working Group II to the Sixth Assessment Report, Intergovernmental Panel on Climate Change. Cambridge, UK and New York, NY, USA: Cambridge University Press, 2022. pp. 551-712.
- Peña-Paz & Chirinos-Escobar. Use of water, a perspective from the national to the basin, case study: Upper part of the Rio Choluteca basin. Tegucigalpa M.D.C. : Unidad de Recursos Hídricos del Instituto Hondureño de Ciencias de la Tierra - UNAH / SERNA /PNUD, 2023.
- Japan Aerospace Exploration Agency. Elevation Model. s.l. : PALSAR Sensor (Phased Array Type L-band Synthetic Aperture Radar), 2006.
- ICF, Forest Conservation Institute. Geoportal of the Forest Sector of Honduras. Forest coverage 2015 - 2019. [Online] 2015 - 2019. [Cited: 20 July, 2023.] https://geoportal.icf.gob.hn/geoportal/main.
- Gose, W. a. Magnetostratigraphic studies of the Cretaceous rock in Central America. . s.l. : Earth Sciences U.A.N.L. LINARES, 233-241., 1987.
- Ritchie, A.W and Finch, R.C. Widespread Jurassic strata on the Chortis Block of the Caribbean plate. . s.l. : Geological Society of America, 17(07), 700-701., 1985.
- Rogers, R. O. Geology of the Tegucigalpa Quadrangle, Francisco Morazán. Tegucigalpa, Honduras: National Cartographic Institute., 1993.
- Simmons, C. S. The soils of Honduras. Rome: United Nations Organization for Food and Agriculture., 1969.
- Water Stable Isotopes Reveal Groundwater Vulnerability to Land Use Fragmentation and Climate Variability in Central Honduras. García-Santos, Saúl and Sánchez-Murillo, Ricardo and Peña-Paz, Tania and Chirinos-Escobar, Marcio and Hernández-Ortiz, Junior and Mejía-Escobar, Edgar Josúe and Ortega, Lucía,. 2021, Science of The Total Environment, Vol. 844.
- UNAH-SERNA. Evaluation of Water Resources in their Natural Regime. Tegucigalpa: SERNA, 2012.
- Ayala, José & Mejía, Edgar. Water availability of the río Chiquito sub-basin: a water balance for the improvement in the processing of water management. Tegucigalpa: UNAH, 2022.
- SERNA, UNAH -. Hydrogeochemical study of the upper part of the Rio Choluteca basin (Update of the groundwater resource inventory) Honduras. Tegucigalpa: UNAH, 2012.
- Telford, W. M., Geldart, L. P., & Sheriff, R. E. Applied geophysics. Cambridge: Cambridge University Press., 1990.
- Lokenote. M. H. Electrical imaging surveys for environmental and engineering studies:. s.l. : A practical guide for 2-D and 3-D surveys, 2000.
- Use of the natural potential method in groundwater exploration: case study Hospital of Olanchito. Rodriguez, M., Ruiz, M.,. 1-9, Tegucigalpa: Physics School Journal, 2022, Physics School - UNAH, Vol. 9.
- Application of the Natural Potential Method for the exploration of groundwater in the area of the Volcán El Pedregal, Honduras. Ruiz, M., Rodriguez M., Funes,. 1-6, Tegucigalpa: Land Journal, 2022, Vol. 2.
- PQWT. Operation manual. Hunan Puqi Geologic Exploration Equipment Institute. 2017.
- Comparison of the IDW and kriging interpolators in the spatial variation of pH, Ca, CEC and P of the soil. Villatoro, M., Henríquez, C., & Sancho, F.. 95-105, s.l. : Costa Rican Agronomy, 2008, Vol. 32.
- Use of kriging for the elaboration of monthly precipitation isohyets curves in the Province of Santa Fe, Argentina. Zucarelli, A., Paris, M., & Macor, J.. Santa Fé - Argentina: National University of the Litoral, Faculty of Engineering in Water Sciences,, 2014.
- Data Requirements for Kriging: Estimation and Network Design. Hughes, J., & Lettenmaier, D. 6, s.l. : Water Resources Research, 1981, Vol. 17.
- Geostatistical Schemes for Groundwater Sampling. . Rouhani, S., & Hall, T. J.. 85-102, 1988, Journal of Hydrology, Vol. 103.
- BM, World Bank. World Bank - Understanding Poverty. Urban Development. [Online] 20 April, 2020. [Cited: 3 October, 2022.] https://www.worldbank.org/en/topic/urbandevelopment/overview.
Received: 26 September 2023 / Accepted: 15 April 2023 / Published:15 December 2023
Citation: Peña-Paz T, Elisa Ortiz M, Rodriguez M, Ortiz P. Dynamics of the Water Table in the Rio Chiquito Sub-basin, Honduras. Revis Bionatura 2023;8 (4) 34. http://dx.doi.org/10.21931/RB/2023.08.04.34
Publisher's Note: Bionatura stays neutral concerning jurisdictional claims in published maps and institutional affiliations.
Copyright: © 2023 by the authors. Submitted for possible open-access publication under the terms and conditions of the Creative Commons Attribution (CC BY) license (https://creativecommons.org/licenses/by/4.0/).