2023.08.01.17
Files > Volume 8 > Vol 8 No 1 2023
Effect of different drying airflows and harvest periods on the quality of specialty coffee (Coffea arabica L.)

Valeria Arévalo1, William Mejía1, Juan Manuel Cevallos-Cevallos2, Johana Ortiz-Ulloa1*
1University of Cuenca, Faculty of Chemical Sciences, Department of Biosciences, Av. 12 de Abril y Av. Loja, Cuenca, Ecuador
2Escuela Superior Politécnica del Litoral (ESPOL), Centro de Investigaciones Biotecnológicas del Ecuador (CIBE), Km 30.5 Vía Perimetral, Apartado 09015863, Guayaquil, Ecuador
Corresponding author. Email: [email protected]
http://dx.doi.org/10.21931/RB/2023.08.01.17
ABSTRACT
Coffee is one of the most consumed commercial beverages worldwide, and coffee growers are constantly seeking innovative processing techniques to improve the quality of the final product. This study evaluated the influence of four drying airflows and three harvest periods on the chemical composition of green and roasted specialty coffee beans. The samples were obtained from the Hacienda La Papaya in Loja, Ecuador. Liquid and gas chromatographic techniques characterized the chemical profile of coffee beans, and sensory analysis was performed using the Specialty Coffee Association of America methodology. In total, 49 compounds were described, 29 in green beans and 20 in roasted beans. A significant (p<0.05) effect of the harvest period was observed in all phenolic compounds except for chlorogenic acid. The drying type significantly affected the levels of rutin and trigonelline. In addition, samples from different harvest periods observed significant differences in the levels of the amino acids serine, arginine, phenylalanine and leucine.
Similarly, the drying type significantly influenced glycine, alanine, valine and isoleucine levels. For all drying-harvest combinations, the final cupping score was higher than 85/100, as the different drying processes slightly influenced the cupping attributes. Drying with minimal airflow was characterized by a low balance and intense flavor while drying with medium airflow presented a high ratio and soft body. The harvest period and drying type cannot be used as cupping predictors since no clear trends were observed to classify specialty coffee organoleptic attributes. Therefore, other variables involved in specialty coffee processing should be explored to evaluate higher sensitivity toward flavor prediction and innovation.
Keywords: chromatographic analysis, Coffea arabica L., sensory analysis, specialty coffee.
INTRODUCTION
Worldwide, coffee is the second most traded commodity after oil 1, and drinkable coffee is one of the most significantly consumed foods 2,3. Coffee aroma is the determining attribute factor that defines the quality and coffee acceptance by the consumer 2,3,4, and it is crucial for the specialty coffee market (Arabic variety), which is very elitist 5,6.
The chemical composition of green beans is very complex and plays a significant role in aroma formation 7. Organic acids and certain bioactive compounds have been identified as possible coffee sensory quality descriptors 8,9. Trigonelline and chlorogenic acids are precursors to other volatile compounds produced during coffee roasting and contribute directly to the coffee aroma 10. Trigonelline is an alkaloid in green coffee beans that is degraded considerably into pyridines and pyrroles 11. Caffeine is associated with an undesirable bitterness that, depending on its concentration, can make the drink worthless 8. Other aroma precursors in green coffee beans are sugars, proteins and free amino acids 12. The protein content of dry green coffee beans is about 8-12%, and it is mainly degraded to amino acids during maturation, which is accelerated by chlorogenic acids and their derivatives 13. Coffee beans contain several free amino acids such as alanine, arginine, asparagine, cysteine, glutamic acid, histidine, glycine, isoleucine, leucine, lysine, methionine, phenylalanine, proline, serine, tyrosine, threonine, and valine 14. Those compounds could contribute to the character and even the acceptability of the beverage since it has been suggested that the amino acid profile influences the yield of specific volatiles during roasting 15.
Coffee bean processing is essential to obtain a high-quality product 16. Roasting, washing and drying processes are the major stages that may influence coffee's chemical composition and, consequently, its aroma 17,18. Drying is one of the post-harvest steps with the most significant influence on coffee quality 19,20. The coffee drying process reduces the bean's moisture content and prevents the microbial action responsible for spoilage during storage 21. The drying process of green coffee beans may be accompanied by changes in the physical, chemical, and organoleptic properties of heat-sensitive components 20. Thus, the quality of the beverage could be defined while controlling the drying process 22. The need for lower production costs and mitigating environmental damage has led to the development and research new drying techniques 21.
Coffee aroma generation occurs predominantly during roasting through a complex series of Maillard reactions, in which nitrogenous heterocyclic compounds (pyridines, pyrazines and pyrroles) are formed. In addition, caramelization products generated by the thermal degradation of polysaccharides and simple sugars present in green coffee beans contribute to the development of roasting characteristics 4,23,24.
Besides pre and post-harvest practices, the sensory attributes can be influenced by the coffee variety and environmental/climatic factors (soil, altitude, sun exposure, rainfall, temperature) 25, 26,27. According to the Specialty Coffee Association of America (SCAA), the sensorial attributes evaluated in coffee cupping are fragrance/aroma, flavor, aftertaste, acidity, body, balance, sweetness, uniformity, clean cup and overall cupping 28. Limited literature relates the composition of green coffee beans to the coffee cup quality 22,29. Thus, more studies are required to support coffee to identify quality parameters at the green coffee bean stage, which is the most widely used maturity stage for purchasing and trading 30.
The objective of this study was to evaluate the influence of the combination of different drying processes and harvest periods in aroma related-compounds and its relation with the sensory quality of the final product in green beans of an Ecuadorian specialty coffee.
MATERIALS AND METHODS
Coffee samples
Green coffee beans samples of Coffea arabica L. typica variety were obtained from the Hacienda La Papaya, located in Saraguro, Loja province, Ecuador, at 1700 m.a.s.l. This farm produces specialty coffee, and all process parameters are controlled until parchment coffee is obtained. Coffee beans were manually collected as mature fruits (17 - 22 °Brix). Ripe coffee beans were subjected to wet fermentation for 15 hours, followed by drying for 7 - 10 days in greenhouse-type experimental rooms, where temperature, relative humidity and aeration were controlled. Grains were homogenized four times a day using a wooden paddle. Grains were dried until reaching a humidity level between 10 - 12% to prevent fungal contamination. After drying, the samples were stored in a controlled temperature chamber at 10°C and 60% relative humidity for 30 days. Experimental models of 250 g of dried green grains were collected and processed in July-August 2019. Samples were packed in hermetic metalized bags until analysis.
Experimental design
The study was based on an unbalanced 3x4 factorial design. Experimental variables were the harvest period (mid-July, early August and mid-August) and drying airflow: i) minimum (internal air movement produced by forced air from fans); ii) medium (high and low windows closed 50%, doors closed during the day and night); iii) zero airflow (high and low windows closed at 100%, doors closed during the day and night) and iv) maximum airflow (high and low windows open 100%, doors open during the day and closed at night). The experimental drying rooms were of the greenhouse type, built with wood and plastic. The drying rooms were rectangular, approximately 7 x 3.5 m2; the front and back parts correspond to the windows, and these were divided in half so that when the upper windows were opened, the lower ones could remain closed and vice versa. The lateral sides correspond to the doors of the greenhouses. In total, 36 samples were collected (12 conditions in triplicate). The response variables were the contents of some polyphenols, amino acids and volatile compounds involved in coffee aroma development.
Chemical analysis
Materials and reagents
Methanol and acetonitrile HPLC grade, fluorenyl-methoxycarbonyl chloride (FMOC; > 99%), and ortho-phthalaldehyde (OPA; > 99%) were supplied by Sigma Aldrich (St. Louis, MO, USA). Dibasic sodium phosphate is anhydrous by Mallincroudt AR (Phillipsburg, USA), glacial acetic acid and fuming hydrochloric acid by Merck KGaA (Darmstadt, Germany). Borate buffer and 3-mercaptopropionic acid, and ultrapure water were obtained from a NANOpure Diamond system (Barnstead, USA). Standards 3-O-caffeoylquinic acid, 4-O-caffeoylquinic acid, 5-O-caffeoylquinic acid, caffeine, trigonelline, caffeic acid, gallic acid, ferulic acid, apigenin, epicatechin, luteolin, rutin, DL-norvaline supplied by Sigma Aldrich (St. Louis, MO, USA) and quercetin by ROTH Carl (Karlsruhe, Germany). A stock solution of the amino acid standards (L-alanine, ammonium chloride, L-arginine, L-aspartic acid, L-cysteine, L-glutamic acid, L-leucine, L-lysine, L-serine, L-threonine, L-tyrosine, L-valine, L-histidine, L-isoleucine, L-methionine, L-phenylalanine, L-proline and glycine) were provided as a mixed solution at a concentration of 2500 pmol/µl was supplied by Sigma Aldrich (St. Louis, MO, USA).
Instrumentation
For the analysis of phenolic compounds and derivatives, as well as amino acids, a high-performance liquid chromatography (HPLC) equipment (Agilent 1200 series) equipped with a quaternary pump, diode array (DAD) and fluorescence (FLD) detectors (Agilent Technologies, USA) was used. For volatile compounds, a gas chromatograph (GC) (7890A series) coupled to a mass spectrometer (MS) (5975C series) (Agilent Technologies, Santa Clara, CA) was used.
Analysis of phenolic compounds and alkaloids
The extraction was carried out from 250 mg of dry and ground green coffee beans with 10 mL of an aqueous solution of 70% methanol. The solution was stirred for 1 minute with a vortex homogenizer, followed by sonication (BRANSONIC 3510, Mexico) for 1 hour with vigorous shaking every 10 minutes. Then, it was centrifuged at 6000 rpm for 10 minutes (Hettich MIRKO 220R, Germany). One mL of the supernatant was diluted with 9 mL of ultrapure water. The extract was filtered through 0.45 µm PVDF membrane filters before analysis.
Chromatographic separation of chlorogenic acids (5-CQA, 3-CQA and 4-CQA), caffeine, caffeic acid, gallic acid, ferulic acid, apigenin, epicatechin, luteolin, quercetin, rutin and trigonelline was performed by HPLC-DAD based on the method described in Saquicela (2018) 31 with some adaptations to include alkaloids. Separation was achieved with a Zorbax Eclipse C18 column (250 x 4.6 mm; 5 µm) (Agilent Technologies, USA), set at 30 °C and using a gradient elution at 1 mL/min of flow rate. The mobile phases were A: water acidified at 0.3% with acetic acid, B: acetonitrile: water/mobile phase A, 50:50 v/v, and C: acetonitrile 100%. Elution started with 10% B for 2 min, then increased to 55% B until 27 min and remained until 37 min. At 39 min, 100% C was reached and kept until 42 min (to wash the column). Finally, the column was re-equilibrated until 43.5 min. The injection volume was 10 µl. Detection was performed at 254 nm (trigonelline, rutin, luteolin and quercetin), 280 nm (gallic acid, caffeine and epicatechin), and 320 nm (5-CQA, 3-CQA, 4-CQA, caffeic acid, ferulic acid and apigenin). The analytical parameters of the HPLC method are shown in Supplementary material (S1).
Analysis of amino acid
The extraction was performed according to the method described in Murkovic & Derler (2006) 32. Briefly, 200 mg of dry and ground green coffee beans were mixed with 10 mL of 0.1 N HCl solution. The solution was shaken for 1 min with a vortex homogenizer and sonicated for 15 min. Finally, the extract was filtered with a 0.45 µm PVDF membrane filter prior to analysis.
The extracts were subjected to programmed pre-column derivatization in the HPLC autoinjector. Primary amino acids were derivatized with OPA (5.12 mg in 1 mL methanol, adding 4 mL 0.4 M borate buffer) and 10 µl 3-MPA. Secondary amino acids (particularly proline) derivatization was performed with FMOC (2.5 mg/mL in acetonitrile) 33.
Derivatized amino acids were separated with a Zorbax Eclipse AAA column (4.6 x 150 mm; 5 µm) (Agilent Technologies, USA), set at 40 °C. A flow rate of 2 mL/min was applied. Mobiles phases were A) 40 mM Na2HPO4, pH 7.8, and B) methanol/acetonitrile/water 45:45:10 v/v/v. Elution started with 100% A from 0 to 1.9 min, followed by an increase in B from 0-57% until 18.1 min and then increased to 100% at 18.6 min, maintained until 22.3 min, to finally re-equilibrate until 26 min. Compounds eluted up to 10 min were detected at 340 nm excitation and 450 nm emission, while eluates up to 15 min were detected at 266 nm excitation and 305 nm emission 34. The analytical parameters of the HPLC method are shown in S1.
Analysis of volatile compounds
Volatile compounds were evaluated in the experimental coffee samples after a standardized roasting process carried out in 50 g-roaster (Ikawa V2 model, London). The roasting process begins with a preheating phase of the Ikawa toaster until it reaches a temperature of 159.8 °C. In the meantime, 50 grams of green coffee beans were weighed and introduced into a doser of the roasting equipment. When the Ikawa equipment was preheated, the doser was opened, and the coffee beans fell through the hole into the roasting chamber. Then the roasting process begins at minute zero at 158.2 °C; this process lasts approximately 5 minutes and reaches a temperature of 205 °C. After roasting, Ikawa entered a cooling phase. Coffee was cool down inside of Ikawa, this took about 2 minutes more, and the roasted coffee was obtained ready for analysis in GC-MS.
Roasted grains were ground and kept in liquid nitrogen. Volatile compounds were extracted by solid phase headspace microextraction (SPME). Approximately 1 g of ground material was transferred to 50 mL vials of SPME. The samples were equilibrated at 50 °C for 30 minutes in a water bath. Finally, they were placed on a 50/30 𝜇m SPME fiber of Divinylbenzene / Carboxen / Polydimethylsiloxane (DVB/CAR/PDMS) (Supelco, Bellefonte, PA, USA) in the headspace of each sample vial for 30 min at 50°C. SPME fiber received initial conditioning at 270°C for 1 hour and daily maintenance conditioning at 240°C for 10 min.
The SPME fiber was removed from the vial and injected in Split mode at 240°C into the GC-MS. Chromatographic separation was performed with a DB5-MS column (30m x 250𝜇m x 0.25𝜇m). The oven temperature ramp started at 70°C and rose to 310°C at a rate of increase of 7°C/min. Helium was used as carrier gas at a flow rate of 0.8 mL/min. The MS was set to maximum sensitivity in electron impact mode, positive polarity, and the total ion current was recorded for a mass range of 50 to 550 amu.
For the identification of metabolites, the MZmine 2 software was used. First, the data from the analysis of aromatic compounds obtained from the chromatography equipment were imported. The presence of peaks (metabolites) in each sample was then checked, and low-quality samples (chromatograms with few peaks) were discarded. The aromatic compounds that are present in coffee were searched in the literature according to the peaks found in each sample obtained after discarding the low-quality samples. The baseline height and the height of the smallest peak in each sample were defined. The following parameters were determined: the average baseline, the average value of the small peaks and the minimum value of the peaks. Parameters that were later used for mass detection and construction of chromatograms. Then deconvolution, normalization and alignment of the peaks were performed. Subsequently, the process known as gap filling was carried out, making it possible to search for peaks that could have been erroneously eliminated in the previous steps. The data obtained in the MZmine 2 software was exported to an Excel file to identify the metabolites. The metabolites were defined by comparing the retention times obtained in the MZmine 2 software and the retention times of the data obtained from the chromatography equipment, as well as with the metabolites described in the literature and the probability percentage for each compound that was obtained from the chromatograph data.
Sensory analysis
The coffee sample cupping process was performed per the SCAA standards with the support of trained tasters. Initially, the samples were roasted (Ikawa V2, London) with a roasting profile adapted to 2500 m.a.s.l. and then ground (Coffee mill Mahlkonig Guatemalan, Germany). A sample of 12.5 g of ground coffee was weighed and placed in a 200 ml glass beaker. To reduce the subjectivity, coffee samples were coded. Aroma and fragrance were the first evaluated parameters. For this, the glass cup with the coffee was shaken and sucked by the tasters as many times as necessary to score it. Then, hot purified water was added to the coffee in the glass until it was almost complete. After 4 minutes, the foam was removed from the upper part of the glass, and the odor emanating from it was inhaled (a process known as "break cup"). The tasting was done 12 min after the contact of the coffee with the water. Coffee was absorbed with a spoon, and after a few seconds, the coffee was expectorated. With this, flavor, acidity, body, aftertaste and balance were determined. The absorption process was repeated as many times as necessary to evaluate each parameter. At the end of the tasting, a discussion and exchange of opinions on the scores were held to know each taster's points of view and observations regarding the samples evaluated without this influencing the already established scores. The samples were classified according to the scores within the following scale: 65-74.99, 75-79, 99, 80-84.99, 85-94.99 and 95-100, which corresponds to a cup quality of good, very good, specialty, excellent and exceptional, respectively.
Statistical analysis
Chromatographic data obtained on HPLC were processed using Chemstation software (Agilent Technologies, USA). Compounds were identified by comparison with the retention times of analytical standards. Each compound's concentration was calculated by interpolating the area values in the corresponding calibration curves.
To evaluate possible differences in the chemical coffee composition with respect to drying methods and harvest times, data was pre-processed. For the coffee samples subjected to the minimum airflow drying method, no experimental results were obtained for any of the analyzed samples. In the case of medium, zero and maximum airflow, results were obtained in some of the replicates. Considering the experimental design, data imputation before principal component analysis was performed specifically for those missing GC-MS results.
Then a normalization of the data was performed using two scaling methods: 1) the Min-max scaling method, used to scale the data in a 0-1 range, and 2) the Standard scaler method, in which the mean of the values becomes zero, and the standard deviation became one. Subsequent analyzes were performed with the values of all repetitions. Ordinary Least Squares performed linear regression to identify the compounds influenced by drying and harvest time and/or the interaction between them. Then, a principal component analysis (PCA) and heat map was constructed with the compounds that were sensitive to the study variables. The individual influence of the drying type and harvest time on the chemical composition of experimental coffee samples was evaluated by two-way ANOVA. To determine the different experimental conditions, the posthoc Tukey's test was applied. For the evaluation of cupping data and its relation with the type of drying, the Random Forest method and Shap plots were used. In addition, a heat map was built with the significant variables. Statistical analyzes were performed with a 95% confidence level using Python software version 3.9.0 and R version 4.1.2.
RESULTS AND DISCUSSION
Chemical composition of specialty coffee beans (Coffea arabica L.)
In this study, several compounds related directly or indirectly to the organoleptic characteristics of specialty coffee were evaluated.
The quantified alkaloids and phenolic compounds in green beans of specialty coffee are presented in Table 1. Caffeine concentration ranged between 7580.04 - 9482.43 µg/g, and trigonelline ranged between 8653.24 – 10322.03 µg/g. The composition of trigonelline was comparable with other studies where concentrations ranged between 7100 - 13200 µg/g; meanwhile, caffeine composition was within a broad range of 500 - 44420 for Arabica varieties from different geographical origins, µg/g previously reported 4,25,35–39. For most bio compounds, the highest concentrations were obtained at zero and maximum airflow and in samples of the last harvest (mid-August).
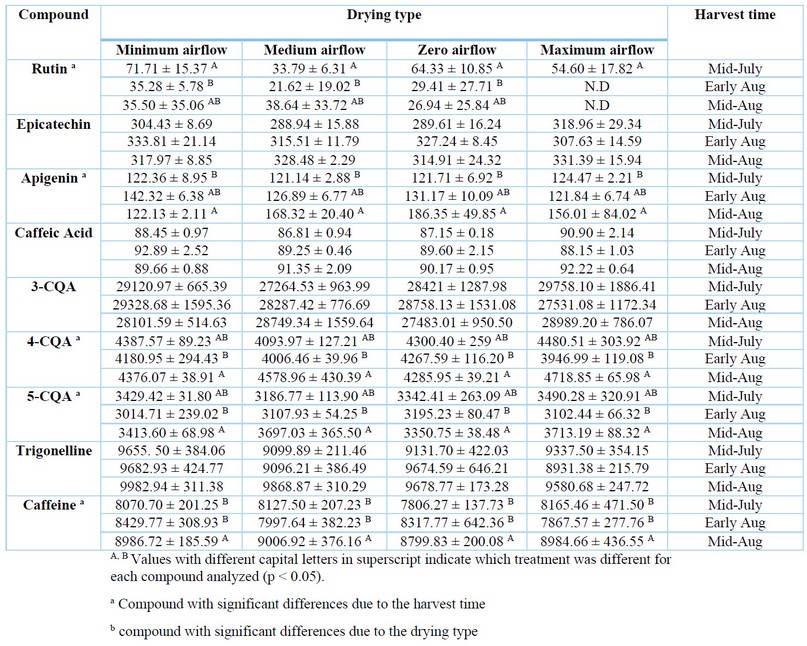
Table 1. Alkaloids and phenolic compounds composition in green coffee beans (µg/g)
Chlorogenic acids are the most abundant phenolic compounds in coffee samples 40–42. In general, the contents of 3-CQA (26250.39 - 31912.57 µg/g), 4-CQA (3861.64 - 5044.66 µg/g) and 5-CQA (2744.60 - 4054.43 µg/g) did not differ considerably among experimental samples. The results for 3-CQA and 4-CQA were within the broad ranges reported in another stud (4930 - 149200 µg/g and 7020 - 101900 µg/g, respectively), while our results for 5-CQA were markedly lower than previous reports (57330 - 263600 µg/g) 4,39,43–45. The significant variations among the concentrations of chlorogenic acids in coffee beans have been attributed to the application of different post-harvest processing 46, environmental factors and genetic variability between coffee species 45. Consequently, it has been suggested that more studies are required to elucidate the correlation between these factors and grain chemistry 46.
The highest concentrations for alkaloids and phenolic compounds quantified corresponded to the last harvest time (mid-Aug), except for rutin and acid 3-CQA whose highest concentrations were for the first harvest time (mid-July). Concerning the drying method, the highest concentrations of compounds were obtained in samples dried at zero and maximum airflow.
The concentration of amino acids in green coffee samples is shown in Table 2. In total, 14 amino acids were quantified, from which proline was the most abundant (4931.48 - 8704.18 µg/g), followed by glutamic acid (852.10 - 2377.78 µg/g) and aspartic acid (274.22 - 1279.43 µg/g). The highest concentrations quantified for the amino acids corresponded to the samples harvested during mid-July and early August; meanwhile, the highest concentrations were obtained when samples were dried at zero airflows, except for glycine, phenylalanine, lysine and proline, whose highest concentrations corresponded to the drying at maximum airflow.
Different amino acid profiles have been previously reported. Wei & Tanokura, (2015) 47 reported 29 types of free amino acids in green coffee bean extracts, where aspartic acid, glutamic acid, serine, glycine, valine, phenylalanine and lysine were similar to our results. In contrast, the concentrations of histidine, threonine and alanine were higher, while arginine, isoleucine, leucine and proline were lower to those determined in the present study. In Casal et al., (2003) 48, the concentrations of glycine and proline were lower, whereas leucine concentrations were higher than our results. In Lee et al. (2017), 49 lower concentrations of glutamic acid, glycine and proline, and high amounts of serine and valine were reported. Other studies reported similar proline, aspartic acid and glutamic acid concentrations but higher concentrations for the other amino acids 19, 50. Dong et al. (2017) 20 suggest that composition variations in coffee can be attributed to factors such as coffee variety 50, 51, geographical origin 51 or analytical methods 52 used. Regarding drying methods, Kulapichitr et al., (2019) 19 evaluated different drying methods in Thai coffee beans. Samples subjected to heat pump drying presented slightly higher levels of most amino acids and no differences at higher temperatures. Tray drying showed a moderate effect on amino acids compared to sun drying, possibly due to shorter drying times.
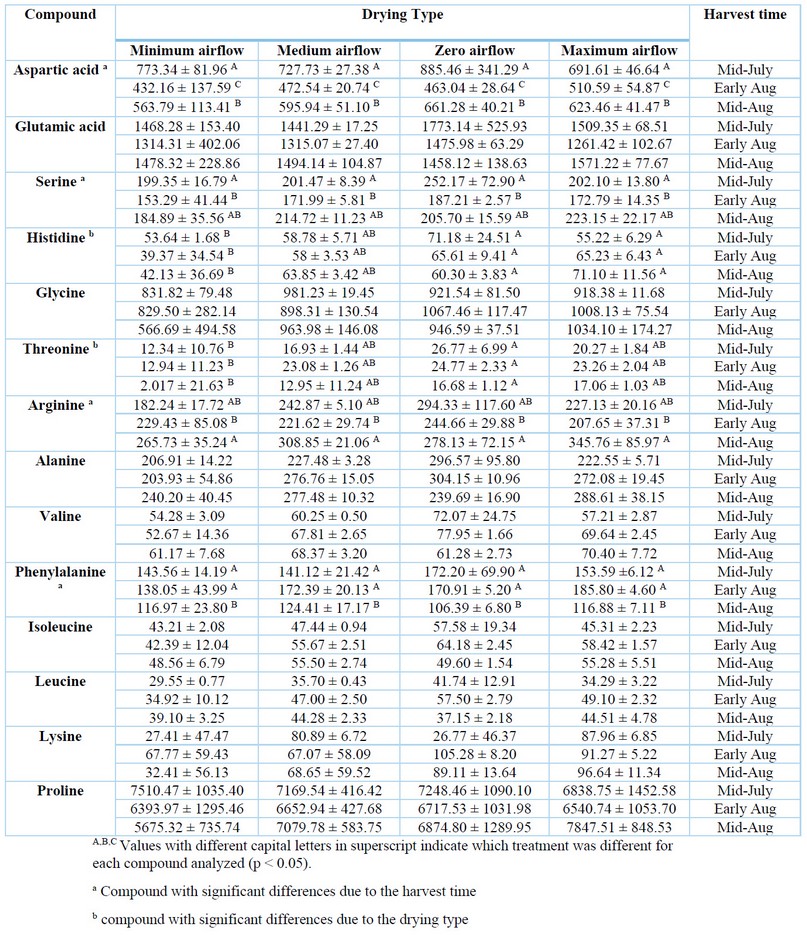
Table 2. Amino acid composition in green coffee beans (µg/g)
The volatile compounds identified in the coffee beans after standardized roasting are presented in Table 3. A total of 20 volatile compounds, including pyridines, pyrazines, alcohols, pyrroles, cyclohexanes, aldehydes, furans, and ketones, were identified, similarly as reported elsewhere 24,53. The highest concentrations of volatile compounds were obtained for samples harvested during mid-August and dried under zero airflow. No significant differences among experimental treatments were determined for the aromatic compounds.
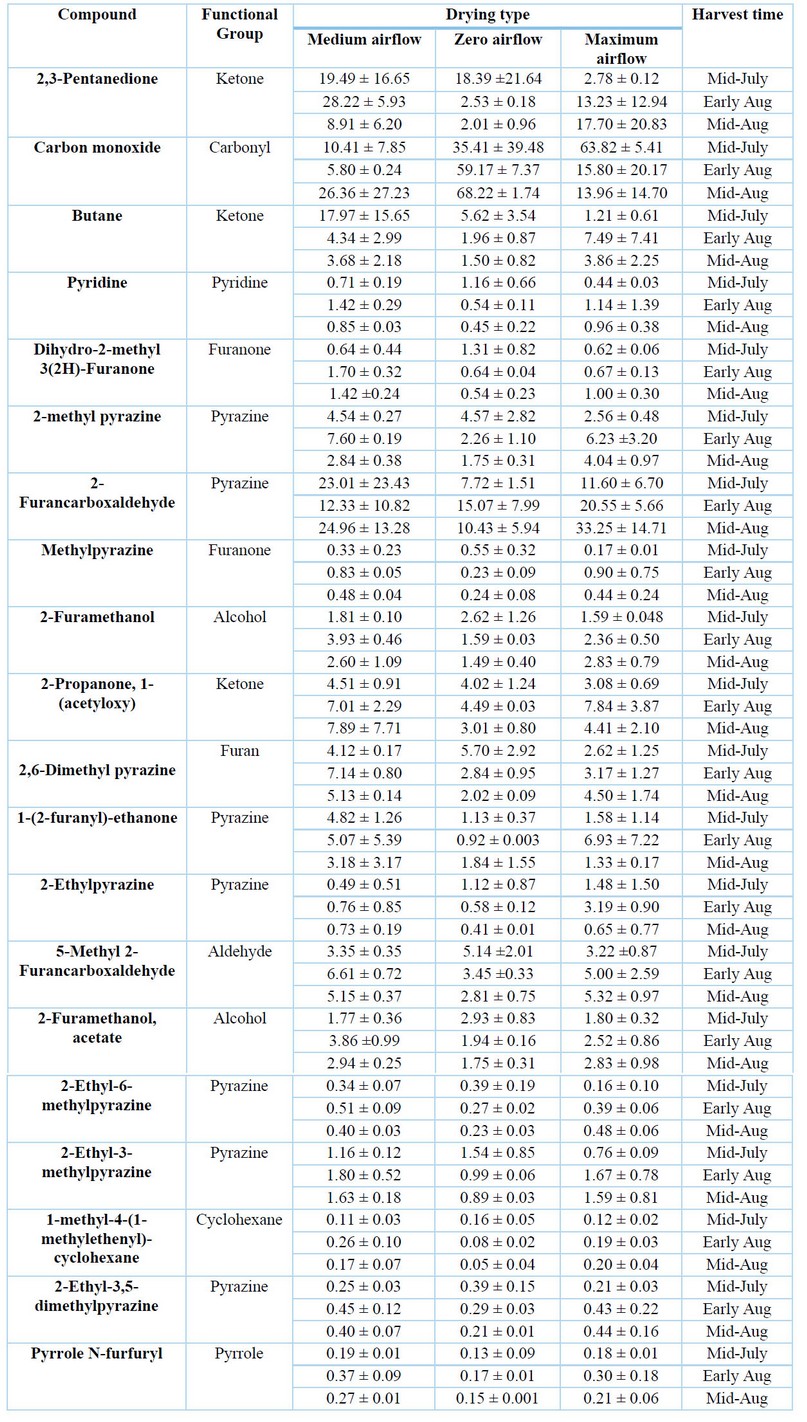
Table 3. Volatile compounds identified in roasted coffee beans (%)
Volatile compounds profile depends on a series of factors such as the species and variety grain, geographical origin, soil conditions and grains storage, as well as the time and temperature of the roasting process, among others 20,54. Cheong et al. (2013) 53 determined volatile sulfur compounds in roasted coffee, which impacted the sensory evaluation. Additionally, furans, pyrazines, pyridines, pyrroles and furanone were the main contributors to the roasted coffee aroma. Amanpour & Selli (2016) 54, mainly furans and lactones, followed by pyrazines, pyridines, acids, cyclopentane, pyrroles, furanone, ketones, thiols, alcohols, aldehydes, among others, were identified. Lee et al. (2017) 49 evaluated the effect of the reverse process of grinding and roasting coffee on volatile compounds profiles, identifying 50 compounds in coffee roasted with the conventional method and 39 using the reverse method of grinding and roasting. To Laukaleja et al. (2019), 55 main volatile compounds were furans, pyrazines, aldehydes and ketones, attributing to the last three an association with a pleasant aroma and flavor in specialty coffees. Heo et al. (2020) 56 identified 36 volatile compounds, highlighting that the extraction method and temperature could influence the volatile compound profiles.
Influence of drying processes and harvest time on coffee beans chemical composition
In this study, the content of several aroma-related compounds from specialty coffee samples harvested in different periods and subjected to other drying processes was assessed (Table 4). The harvest time significantly influenced all phenolic compounds' composition (p<0.05), except chlorogenic acid (3 CQA). Harvest time also influenced on the content of the amino acids serine (p=0.003), arginine (p=0.009), phenylalanine (p=0.0004) and leucine (p=0.00006) and the only one aromatic compound cyclohexane (p=0.04). Drying type significantly influenced on the concentration of rutin (p=0.03), trigonelline (p=0.04) and the amino acids glycine (p=0.04), alanine (p=0.01), valine (p=0.02) and isoleucine (p=0.01).
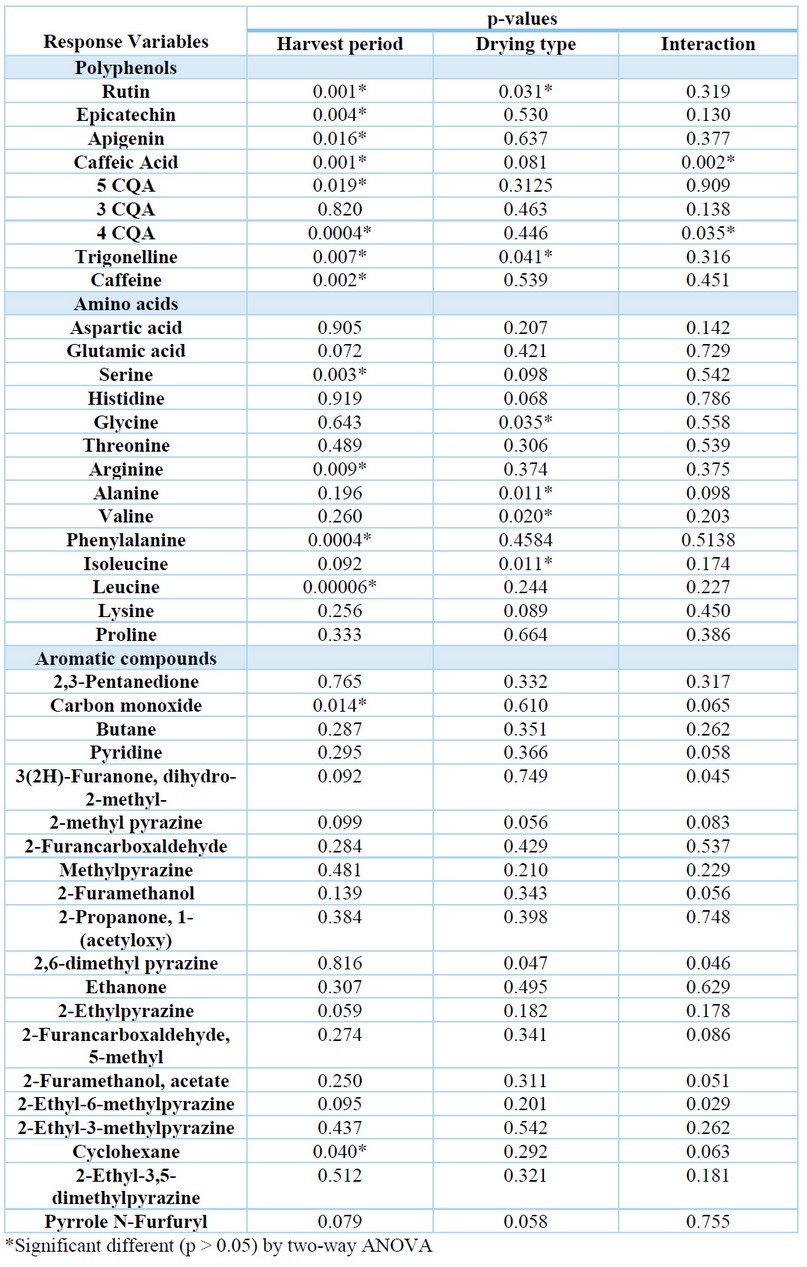
Table 4. Individual influence of the drying type and harvest time on the chemical composition of green coffee beans, evaluated by analysis of variance.
Experimental treatments that significantly differed were identified (Tables 1 & 2). For polyphenols, the quantified concentrations of rutin, 4-CQA and 5-CQA of the coffee beans collected in early August were statistically lower than the other harvest periods. For apigenin and caffeine, concentrations in the coffee beans collected in mid-August were significantly higher than in the other harvest periods. For amino acids, concentrations of aspartic acid were quite different among all harvest periods, obtaining the highest concentration in samples collected mid-July. Serine and arginine concentrations in samples collected in early August were significantly lower than those obtained from other harvest periods. For phenylalanine, statistically lower concentrations were observed in samples collected in mid-August. For histidine and threonine, significantly lower concentrations were obtained in coffee samples subjected to minimal aeration.
The combined influence of the experimental variables was explored by constructing a PCA based on the biocompounds whose simple linear regressions were statistically significant. Those compounds were one polyphenol (apigenin), five amino acids (arginine, alanine, valine, isoleucine, and leucine), and 10 aromatics (2,3-pentanedione, carbon monoxide, butane, dihydro-2-methyl 3(2H)-furanone, 2-methylpyrazine, 2-furancarboxaldehyde, 2,6-dimethylpyrazine, 2-ethylpyrazine, 2-ethyl-6-methylpyrazine, and 2-ethyl-3-methylpyrazine). Three main components were defined and explained 73% of the variation of the data based on the harvest time (PCA1 39% and PCA2 24%).
Figure 1 shows a heat map of the variation of coffee bean composition according to the drying type and harvest time. Two groups were distinguished, one for amino acids and another for aromatic compounds, except for butane and carbon monoxide. This suggested assembling early formed precursors and roasting products, discarding intermediate processes, such as ripening and drying, that were not significant when constructing the PCA model. These results may support the observed more considerable influence of the harvest period compared to the evaluated drying processes.
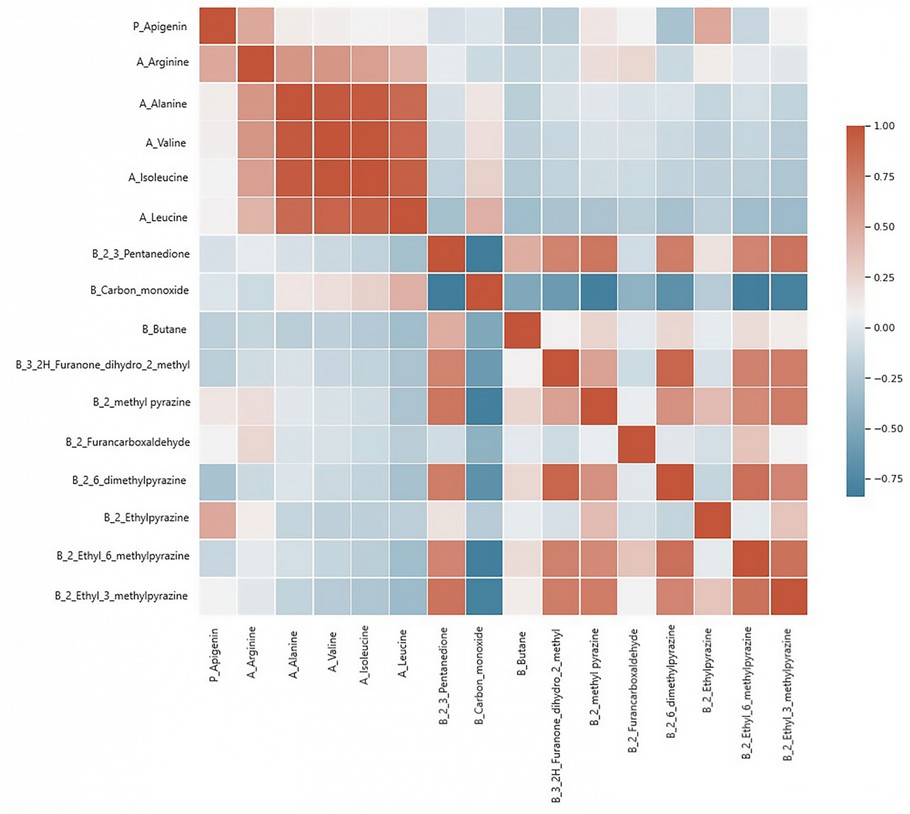
Figure 1. Heat map for coffee samples subjected to different drying airflow types and different harvest times.
Several studies refer to the interaction of the chemical composition of coffee with genotype 10, environment 10, geographical origin 57, climatic factors 58, and processing 10, among others. Kulapichitr et al. (2019) 19 evaluated the influence of heat pump drying, tray drying and sun drying on coffee's chemical composition. The drying process did not affect the caffeine content, but it influenced the concentration of histidine, as in the present study. In addition, significant differences were observed for aspartic acid and phenylalanine. Significant differences among drying methods in several compounds were described for the aromatic compounds. Green coffee beans subjected to heat pump drying presented slightly higher levels of most amino acids 19. Heat pump and tray drying shared the same profile and compound content, while both differed from the composition of sun-dried coffee samples 19. Tolessa et al., 2017 59 evaluated the influence of growing altitude, shade and harvest period on Ethiopian specialty coffee's quality and biochemical design.
It was determined that beans harvested at early and middle harvest periods were generally higher in cup quality compared to late-harvested beans. Interactions among altitude, shade and harvest periods were significant for caffeine content. The highest caffeine content (17.9 g Kg-1) was obtained in early harvested beans at middle altitude with dense shade. In comparison, the lowest range (14.5 g Kg-1) was observed in middle-harvested beans from high altitudes with the medium shade. No interactions were found for the total chlorogenic acids content of coffee beans. Laderach et al. (2011) 60 evaluated two harvest times and their correlation with the sensory properties of coffee harvested in two Colombian states and two Mexican farms. They found significant differences in the sensory attributes of the coffee and determined that for an early harvest, most characteristics score higher except for aroma/fragrance, body and sweetness. Final cupping scores for early and late harvest coffees were 77.8 points and 72.6 pints, respectively. Jeszka‑Skowron et al., 2016 43, evaluated the concentration of chlorogenic acids and caffeine in coffee beans from different geographical origins of the Arabica and Robusta varieties. They determined that there were no significant differences between the contents of caffeine and chlorogenic acids (3-CQA, 4-CQA and 5-CQA) of the coffee collected from different geographical origins for the Arabica variety. However, for the Robusta variety, there were significant differences in the contents of these compounds. Scarce information about associations between green coffee beans' chemical compositions and the harvest period has been published.
Other studies have evaluated the relationship between coffee chemical composition and drying conditions. In Dong et al. (2017), 20 five drying conditions were assessed, and, by PCA, it was determined that both hot air-dried and cold-dried samples were located in the positive direction of PC1. In contrast, the models treated with the heat pump drying, solar drying, and room temperature drying methods were close to each other and in the negative PC1 direction, indicating that the different drying methods influence coffee chemical compounds' content. In addition, solar drying significantly influenced caffeine and trigonelline content; meanwhile, freeze-drying and heat-pump drying significantly influenced the concentration of amino acids and volatile compounds, respectively 20.
Other factors before harvest, such as the species, cultural practices, fertilization, temperature and altitude, can influence the quality of the coffee cup. According to Bastian et al., 2021 61, the quality of coffee beverages is affected by the ripening time of the fruit, which is also related to geographic and climate conditions 62. Velásquez & Banchón, 2022 63 mentioned that climatic changes where there are heat waves and droughts directly affect the production of Arabica coffee due to its greater sensitivity to climatic changes. Overall, the association of different variables throughout the pre-and post-harvest coffee processing should continue being explored towards defining predictor variables for coffee classification, particularly for high-quality coffee due to its sensitiveness.
Sensory analysis results
The drink quality, given by its sensory attributes, is the main characteristic that differentiates specialty coffee from regular coffee 46,64. In this study, drink quality was subjected to sensorial panels only considering the drying type since it was the less sensitive variable related to the coffee chemical composition. The sensory scores given by professional tasters are shown in Table 5. According to the SCAA, specialty coffee must present a final sensory score greater than or equal to 80 out of 100 65. This narrow scoring is scale-based, which reduces the possibility of quantitative analysis. A proposal to match sensory attributes with the drying type was modeled by Random Forest analysis, through which the drying type could be predictable only within a cupping range between 8 and 9.5.
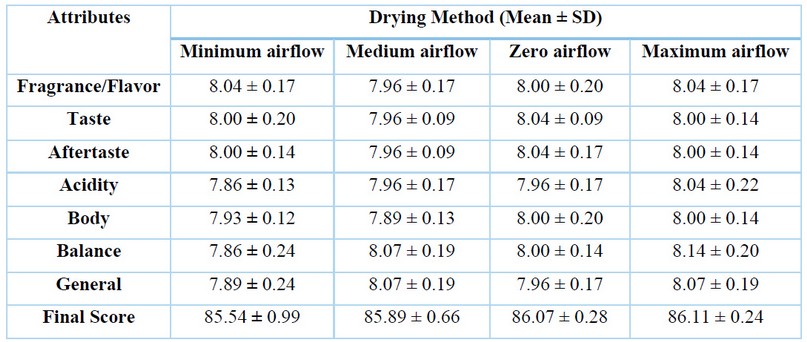
Table 5. Sensory analysis scores of coffee samples by type of drying
The primary tasting descriptors were the balance and the general tasting value—figure 2. A shows the results obtained for samples dried under minimum airflow, in which the most representative descriptors were balance, flavor and final score. A low balance and high flavor values characterized drying at minimum airflow. Figure 2.B presents the model for drying at medium airflow. This drying type was defined as a tasting result with low body values, high balance and high general tasting values. For drying at zero airflows, balance, available tasting value and body were the most relevant descriptors without defining any trend since the medium and low values were mixed (Figure 2.C). This drying type could only be defined with high aroma values. Similarly, for drying at maximum airflow, no clear trend of cupping descriptors was observed (Figure 2.D).
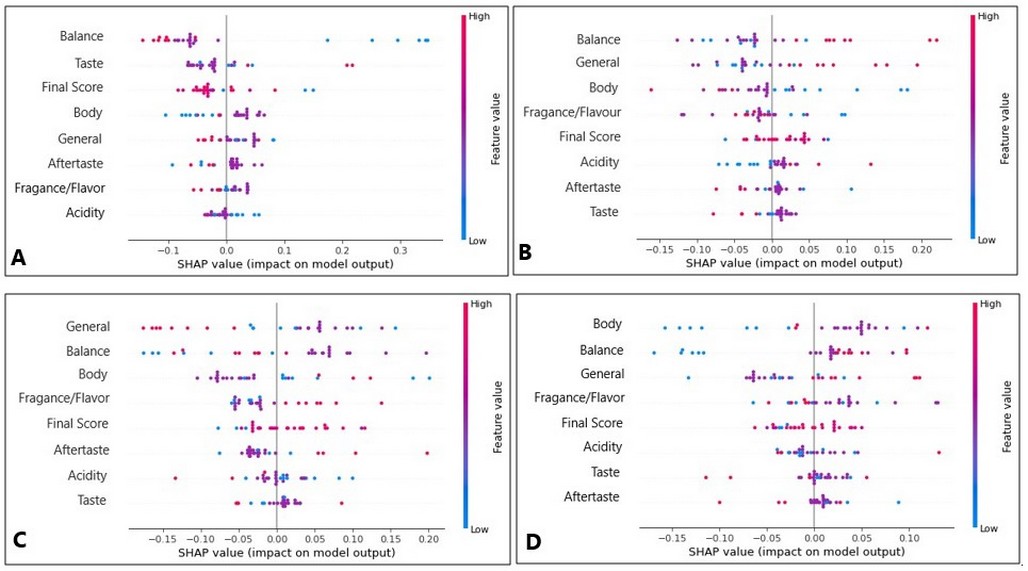
Figure 2. (A) Tasting parameters with the greatest influence on samples subjected at minimum airflow drying, (B) Tasting parameters with the greatest influence on samples subjected at medium airflow drying, (C) Tasting parameters with the greatest influence on samples dried without airflow, and (D) Tasting parameters with the greatest influence on samples subjected at maximum airflow drying.
These results suggested an association between the drying at a minimum and medium airflow with the final tasting. In contrast, extreme drying conditions, i.e., zero and maximum airflow, could trigger diverse metabolic processes that result in a mixture of tasting characteristics.
Previous studies evaluate the sensory analysis relationship of coffee with the processing type. Wet processing requires large amounts of water 66 and involves the mechanical depulping of coffee cherries, which removes most of the bean flesh 61. What is obtained is parchment coffee surrounded by mucilaginous residues, which are degraded through fermentation in water pools that cover the coffee beans entirely for a certain period; the final product is a "washed" or "parchment" coffee 67. This method is widely used in Arabica coffee 61. Pinto et al., (2013) 68 established that for the sensory attributes evaluated in their study (drink clarity, acidity, body, flavor, aftertaste, balance, general value and final score) there was a significant difference between the treatments, being the wet superior to dry processing coffees with final scores between 82.93-82.95 and 78.12-75.65, respectively. Rodriguez et al. (2020) 69 determined that post-harvest coffee processing did not affect the total cup score, obtaining a mean value for the semi-dry processing method of 85.94 ± 0.57, while for wet processing, it was 84.13 ± 0.42. In addition, none of the attributes analyzed individually for final tasting was significantly different between both processes; however, they noted slightly better values for fragrance/aroma, aftertaste, acidity, and body attributes for the wet processing. They also observed that uniformity, balance, clean cup, and sweetness parameters increased the overall rating. Ribeiro et al. (2016) 10 obtained results contrary to the studies mentioned above, where the significantly highest average values final score were observed in dry-processed coffee, with a value of 85.57 vs. 84.61 obtained with the wet method.
CONCLUSIONS
In this study, the influence of the different drying processes and harvest periods on the quality of specialty green bean coffee was evaluated through the characterization of aroma-responsible compounds and their relationship with the tasting attributes of coffee drinks. Four drying types and three harvest times were considered for 36 coffee bean samples. The techniques for extracting and analyzing chemical compounds from coffee were optimized. The concentrations of polyphenols, amino acids and aromatic compounds were quantified and some differed from those reported in the literature, attributing to a series of factors such as geographical origin, environmental factors, agricultural practices, grain species and variety, post-harvest treatments, type of roasting, among others. Slight differences were established in chemical compound content concerning harvest periods, but these differences were not significant. The drying type did not significantly influence the bio compounds concentration determined in specialty coffee. Therefore, both the harvest period and the drying type alone cannot be considered predictive scale variables that explain the sensory differences of specialty coffee. It is suggested to analyze the entire production process of specialty coffee to define other variables that adequately explain these differences in composition for the chemical compounds of coffee. Tasting according to drying type allowed to establish a predictive model, particularly for drying types with minimum and medium airflow, as long as the tasting values are within a range of 8-9.5. Considering that cupping scores for specialty coffee should be high, it is suggested to create an internal cupping scale to obtain a broader cupping range, allowing a more sensitive evaluation of processing variables and even chemical coffee composition.
Acknowledgment
To the farm "La Papaya" located in the Saraguro canton, Loja-Ecuador. The research was carried out within the framework of a joint VLIR NETWORK Ecuador postgraduate program.
Competing interest
The author(s) declare that they have no competing interests.
REFERENCES
1 Rodrigues N, Bragagnolo N. Identification and quantification of bioactive compounds in coffee brews by HPLC-DAD-MS. J Food Compos Anal 2013; 32: 105–115.
2 Borrella I, Mataix C, Carrasco-Gallego R. Smallholder Farmers in the Speciality Coffee Industry: Opportunities, Constraints and the Businesses that are Making it Possible. IDS Bull 2015; 46: 29–44.
3 González Sánchez H, Gonzales Palomares S, Rosales Reyes T. Café (Coffea arabica L.): Compuestos volátiles relacionados con el aroma y el sabor. Unacar Tecnociencia 2011; 5: 35–45.
4 Lee LW, Cheong MW, Curran P, Yu B, Liu SQ. Coffee fermentation and flavor--An intricate and delicate relationship. Food Chem 2015; 185: 182–191.
5 Anthony J. Top 10 Most Expensive Coffee In The World: Luwak Coffee Is Not The No. 1. Financesonline.com. 2014.https://financesonline.com/top-10-most-expensive-coffee-in-the-world-luwak-coffee-is-not-the-no-1/ (accessed 25 Jul2021).
6 Transparent Trade Coffee. SCRPI. Transparent Trade Coffee. 2020.https://www.transparenttradecoffee.org/scrpi (accessed 25 Jul2021).
7 Fisk ID, Kettle A, Hofmeister S, Virdie A, Kenny JS. Discrimination of roast and ground coffee aroma. Flavour 2012; 1: 14.
8 Borém FM, Figueiredo LP, Ribeiro FC, Taveira JHS, Giomo GS, Salva TJG. The relationship between organic acids, sucrose and the quality of specialty coffees. Afr J Agric Res 2016; 11: 709–717.
9 Farah A, Marino Donangelo C. Phenolic compounds in coffee. Braz J Plant Physiol 2006; 18: 23–36.
10 Ribeiro DE, Meira Borém F, Cirillo M, Bernardes MV, Ferraz V, Ramos Alves H et al. Interaction of genotype, environment and processing in the chemical composition expression and sensorial quality of Arabica coffee. Afr J Agric Res 2016; 11: 2412–2422.
11 Arruda NP, Hovell AMC, Rezende CM, Freitas SP, Couri S, Bizzo HR. Correlação entre precursores e voláteis em café arábica brasileiro processado pelas vias seca, semiúmida e úmida e discriminação através da análise por componentes principais. Quím Nova 2012; 35: 2044–2051.
12 Poisson L, Blank I, Dunkel A, Hofmann T. Chapter 12 - The Chemistry of Roasting—Decoding Flavor Formation. In: Folmer B (ed). The Craft and Science of Coffee. Academic Press, 2017, pp 273–309.
13 Chu Y-F. Coffee: Emerging Health Effects and Disease Prevention. John Wiley & Sons, 2012.
14 Grembecka M, Malinowska E, Szefer P. Differentiation of market coffee and its infusions in view of their mineral composition. Sci Total Environ 2007; 383: 59–69.
15 Arya M, Rao LJM. An impression of coffee carbohydrates. Crit Rev Food Sci Nutr 2007; 47: 51–67.
16 Bressanello D, Liberto E, Cordero C, Rubiolo P, Pellegrino G, Ruosi MR et al. Coffee aroma: Chemometric comparison of the chemical information provided by three different samplings combined with GC-MS to describe the sensory properties in cup. Food Chem 2017; 214: 218–226.
17 Gonzalez-Rios O, Suarez- Quiroz M, Renaud B, Barel M, Guyot B, Guiraud J-P et al. Impact of "ecological" post-harvest processing on coffee aroma: II. Roasted coffee. J Food Compos Anal - J FOOD COMPOS ANAL 2007; 20: 297–307.
18 Puerta G, Echeverry J. Fermentación controlada del café: Tecnología para agregar valor a la calidad. 2015.https://biblioteca.cenicafe.org/bitstream/10778/558/1/avt0454.pdf.
19 Kulapichitr F, Borompichaichartkul C, Suppavorasatit I, Cadwallader KR. Impact of drying process on chemical composition and key aroma components of Arabica coffee. Food Chem 2019; 291: 49–58.
20 Dong W, Hu R, Chu Z, Zhao J, Tan L. Effect of different drying techniques on bioactive components, fatty acid composition, and volatile profile of robusta coffee beans. Food Chem 2017; 234: 121–130.
21 Firdissa E, Mohammed A, Berecha G, Garedew W. Coffee Drying and Processing Method Influence Quality of Arabica Coffee Varieties (Coffee arabica L.) at Gomma I and Limmu Kossa, Southwest Ethiopia. J Food Qual 2022; 2022: e9184374.
22 Coradi PC, Borém FM, Saath R, Marques ER. Effect of drying and storage conditions on the quality of natural and washed coffee. Coffee Sci 2007; 2: 10.
23 Lee LW, Cheong MW, Curran P, Yu B, Liu SQ. Modulation of coffee aroma via the fermentation of green coffee beans with Rhizopus oligosporus: I. Green coffee. Food Chem 2016; 211: 916–924.
24 Petisca C, Pérez-Palacios T, Farah A, Pinho O, Ferreira IMPLVO. Furans and other volatile compounds in ground roasted and espresso coffee using headspace solid-phase microextraction: Effect of roasting speed. Food Bioprod Process 2013; 91: 233–241.
25 Yisak H, Redi-Abshiro M, Chandravanshi BS. Selective determination of caffeine and trigonelline in aqueous extract of green coffee beans by FT-MIR-ATR spectroscopy. Vib Spectrosc 2018; 97: 33–38.
26 Kitzberger CSG, Scholz MB dos S, Benassi M de T. Bioactive compounds content in roasted coffee from traditional and modern Coffea arabica cultivars grown under the same edapho-climatic conditions. Food Res Int 2014; 61: 61–66.
27 Cheng B, Furtado A, Smyth HE, Henry RJ. Influence of genotype and environment on coffee quality. Trends Food Sci Technol 2016; 57: 20–30.
28 Specialty Coffee Association of America. SCAA. Coffee Standards. 2018.https://static1.squarespace.com/static/584f6bbef5e23149e5522201/t/5d936fa1e29d4d5342049d74/1569943487417/Coffee+Standards-compressed.pdf (accessed 27 Jul2021).
29 Farah A, Monteiro MC, Calado V, Franca AS, Trugo LC. Correlation between cup quality and chemical attributes of Brazilian coffee. Food Chem 2006; 98: 373–380.
30 Barbosa M de SG, Scholz MB dos S, Kitzberger CSG, Benassi M de T. Correlation between the composition of green Arabica coffee beans and the sensory quality of coffee brews. Food Chem 2019; 292: 275–280.
31 Saquicela JE. “Optimización experimental de un método cromatográfico HPLC-DAD para el análisis de polifenoles en frutas.” 2018.http://dspace.ucuenca.edu.ec/bitstream/123456789/30853/1/TRABAJO%20DE%20TITULACI%c3%93N.pdf.
32 Murkovic M, Derler K. Analysis of amino acids and carbohydrates in green coffee. J Biochem Biophys Methods 2006; : 8.
33 Kerkaert B, Mestdagh F, Cucu T, Aedo PR, Ling SY, De Meulenaer B. Hypochlorous and peracetic acid induced oxidation of dairy proteins. J Agric Food Chem 2011; 59: 907–914.
34 Henderson JW, Ricker RD, Bidlingmeyer BA, Woodward C. Rapid, accurate, sensitive, and reproducible HPLC analysis of amino acids. Amino acid analysis using Zorbax Eclipse-AAA columns and the Agilent, 1100. Agil Technol 2000; : 1–10.
35 Mehari B, Redi-Abshiro M, Chandravanshi BS, Atlabachew M, Combrinck S, McCrindle R. Simultaneous Determination of Alkaloids in Green Coffee Beans from Ethiopia: Chemometric Evaluation of Geographical Origin. Food Anal Methods 2016; 9: 1627–1637.
36 Atlabachew M, Abebe A, Alemneh Wubieneh T, Tefera Habtemariam Y. Rapid and simultaneous determination of trigonelline, caffeine, and chlorogenic acid in green coffee bean extract. Food Sci Nutr 2021; 9: 5028–5035.
37 Macheiner L, Schmidt A, Schreiner M, Mayer HK. Green coffee infusion as a source of caffeine and chlorogenic acid. J Food Compos Anal 2019; 84: 103307.
38 Demissie EG, Woyessa GW, Abebe A. Uv/Vis spectrometer determination of caffeine in green coffee beans from Hararghe, Ethiopia, using beer-lambert's law and integrated absorption coefficient techniques. 2016; : 16.
39 De Luca S, Ciotoli E, Biancolillo A, Bucci R, Magrì AD, Marini F. Simultaneous quantification of caffeine and chlorogenic acid in coffee green beans and varietal classification of the samples by HPLC-DAD coupled with chemometrics. Environ Sci Pollut Res 2018; 25: 28748–28759.
40 Perrone D, Farah A, Donangelo C, Paulis T, Martin P. Comprehensive analysis of major and minor chlorogenic acids and lactones in economically relevant Brazilian coffee cultivars. Food Chem 2008; 106: 859–867.
41 Król K, Gantner M, Tatarak A, Hallmann E. The content of polyphenols in coffee beans as roasting, origin and storage effect. Eur Food Res Technol 2020; 246: 33–39.
42 Rostagno MA, Celeghini RMS, Debien ICN, Nogueira GC, Meireles MAA. Chapter 15 - Phenolic Compounds in Coffee Compared to Other Beverages. In: Preedy VR (ed). Coffee in Health and Disease Prevention. Academic Press: San Diego, 2015, pp 137–142.
43 Jeszka-Skowron M, Sentkowska A, Pyrzyńska K, De Peña MP. Chlorogenic acids, caffeine content and antioxidant properties of green coffee extracts: influence of green coffee bean preparation. Eur Food Res Technol 2016; 242: 1403–1409.
44 Craig AP, Fields C, Liang N, Kitts D, Erickson A. Performance review of a fast HPLC-UV method for the quantification of chlorogenic acids in green coffee bean extracts. Talanta 2016; 154: 481–485.
45 Ribeiro DE, Borém FM, Nunes CA, Alves AP de C, Santos CM dos, Taveira JH da S et al. Profile of organic acids and bioactive compounds in the sensory quality discrimination of arabica coffee. Coffee Sci - ISSN 1984-3909 2018; 13: 187–197.
46 Ribeiro DE, Borém FM, Nunes CA. Sensory quality discrimination of Coffea arabica. Coffee Sci 2018; 13: 11.
47 Wei F, Tanokura M. Organic Compounds in Green Coffee Beans. In: Coffee in Health and Disease Prevention. Elsevier, 2015, pp 149–162.
48 Casal S, Alves MR, Mendes E, Oliveira MBPP, Ferreira MA. Discrimination between Arabica and Robusta Coffee Species on the Basis of Their Amino Acid Enantiomers. J Agric Food Chem 2003; 51: 6495–6501.
49 Lee LW, Tay GY, Cheong MW, Curran P, Yu B, Liu SQ. Modulation of the volatile and non-volatile profiles of coffee fermented with Yarrowia lipolytica: I. Green coffee. LWT 2017; 77: 225–232.
50 Dong W, Tan L, Zhao J, Hu R, Lu M. Characterization of Fatty Acid, Amino Acid and Volatile Compound Compositions and Bioactive Components of Seven Coffee (Coffea robusta) Cultivars Grown in Hainan Province, China. Molecules 2015; 20: 16687–16708.
51 Wei F, Furihata K, Koda M, Hu F, Kato R, Miyakawa T et al. 13C NMR-Based Metabolomics for the Classification of Green Coffee Beans According to Variety and Origin. J Agric Food Chem 2012; 60: 10118–10125.
52 Ramón-Gonçalves M, Gómez-Mejía E, Rosales-Conrado N, León-González ME, Madrid Y. Extraction, identification and quantification of polyphenols from spent coffee grounds by chromatographic methods and chemometric analyses. Waste Manag 2019; 96: 15–24.
53 Cheong MW, Tong KH, Ong JJM, Liu SQ, Curran P, Yu B. Volatile composition and antioxidant capacity of Arabica coffee. Food Res Int 2013; 51: 388–396.
54 Amanpour A, Selli S. Differentiation of Volatile Profiles and Odor Activity Values of Turkish Coffee and French Press Coffee: Turkish Coffee and French Press Coffee Volatiles. J Food Process Preserv 2016; 40: 1116–1124.
55 Laukaleja I, Kruma Z. Phenolic and volatile compound composition influence to specialty coffee cup quality. 2019; : 441.8Kb.
56 Heo J, Adhikari K, Choi KS, Lee J. Analysis of Caffeine, Chlorogenic Acid, Trigonelline, and Volatile Compounds in Cold Brew Coffee Using High-Performance Liquid Chromatography and Solid-Phase Microextraction—Gas Chromatography-Mass Spectrometry. Foods 2020; 9: 1746.
57 Mehari B, Redi M, Chandravanshi B, Combrinck S, Atlabachew M, Mccrindle R. Profiling of Phenolic Compounds Using UPLC-MS for Determining the Geographical Origin of Green Coffee Beans from Ethiopia. J Food Compos Anal 2016; 45: 16–25.
58 Bertrand B, Renaud B, Dussert S, Laffargue A, Ribeyre F, Berthiot L et al. Climatic factors directly impact the biochemical composition and the volatile organic compounds fingerprint in green Arabica coffee bean as well coffee beverage quality. 2012.
59 Tolessa K, D'heer J, Duchateau L, Boeckx P. Influence of growing altitude, shade and harvest period on quality and biochemical composition of Ethiopian specialty coffee. J Sci Food Agric 2017; 97: 2849–2857.
60 Läderach P, Oberthür T, Cook S, Estrada Iza M, Pohlan JA, Fisher M et al. Systematic agronomic farm management for improved coffee quality. Field Crops Res 2011; 120: 321–329.
61 Bastian F, Hutabarat OS, Dirpan A, Nainu F, Harapan H, Emran TB et al. From Plantation to Cup: Changes in Bioactive Compounds during Coffee Processing. Foods 2021; 10: 2827.
62 Wintgens JN. Factors Influencing the Quality of Green Coffee. In: Coffee: Growing, Processing, Sustainable Production. John Wiley & Sons, Ltd, 2004, pp 789–809.
63 Velásquez S, Banchón C. Influence of pre-and post-harvest factors on the organoleptic and physicochemical quality of coffee: a short review. J Food Sci Technol 2022. doi:10.1007/s13197-022-05569-z.
64 Silveira A de S, Pinheiro ACT, Ferreira WPM, Silva LJ da, Rufino JL dos S, Sakiyama NS. ' Sensory analysis of specialty coffee from different environmental conditions in the region of Matas de Minas, Minas Gerais, Brazil. Rev Ceres 2016; 63: 436–443.
65 Santos DF, Franco Junior KS, da Silva CH, Da Silva Neto JF, Paiva LC, Brigante GP. Efect of lnf (cna - cnb) enzyme complex in the drying process and the coffee quality. 2020. doi:10.25186/.v15i.1677.
66 Haile M, Hee Kang W. The Harvest and Post-Harvest Management Practices' Impact on Coffee Quality. In: Toledo Castanheira D (ed). Coffee - Production and Research. IntechOpen, 2020 doi:10.5772/intechopen.89224.
67 Duarte GS, Pereira AA, Farah A. Chlorogenic acids and other relevant compounds in Brazilian coffees processed by semi-dry and wet post-harvesting methods. Food Chem 2010; 118: 851–855.
68 Pinto G, Silva Q, Ribeiro M, De Souza S. Quality of coffee produced in the Southwest region of Bahia, Brazil subjected to different forms of processing and drying. Afr J Agric Res 2013; 8: 2334–2339.
69 Rodriguez YFB, Guzman NG, Hernandez JG. Effect of the post-harvest processing method on the biochemical composition and sensory analysis of Arabica coffee. Eng Agríc 2020; 40: 177–183.
Received: September 26, 2022 / Accepted: October 15, 2022 / Published:15 February 2023
Citation: Arévalo V, Mejía W, Cevallos-Cevallos J M, Ortiz-Ulloa J . Effect of different drying airflows and harvest periods on the quality of specialty coffee (Coffea arabica L.) Revis Bionatura 2023;8 (1)17. http://dx.doi.org/10.21931/RB/2023.08.01.17